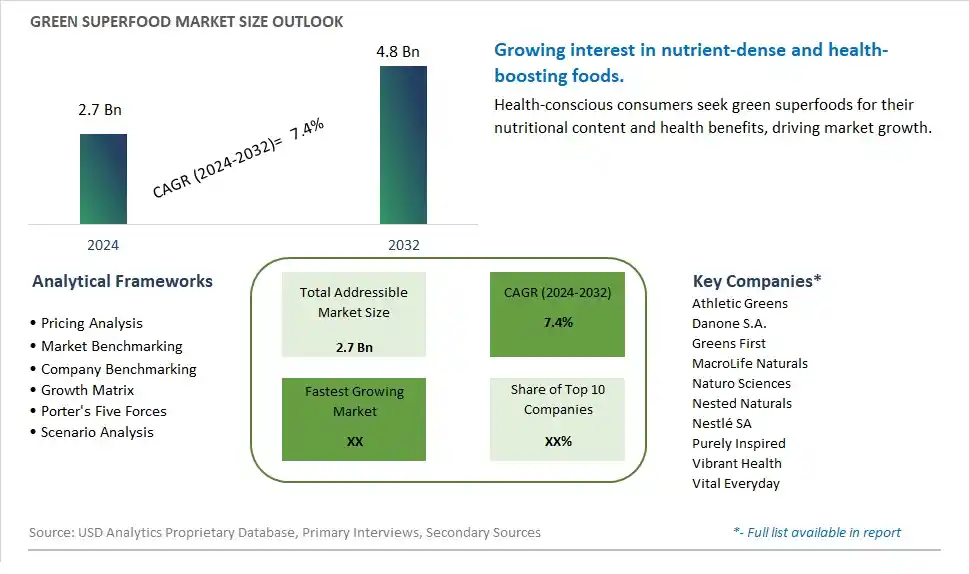
Global Green Superfood Market Size is valued at $2.7 Billion in 2024 and is forecast to register a growth rate (CAGR) of 7.4% to reach $4.8 Billion by 2032.
The global Green Superfood Market Comprehensive Study analyzes and forecasts the market size across 6 regions and 24 countries for diverse segments -By Type (Fermented Greens, Marine Sources, Grasses Sourced, Others), By Application (Supermarkets or Hypermarkets, Convenience Stores, Independent Retailers, Online Sales, Others)
An Introduction to Green Superfood Market
In 2024, the Green Superfood market is experiencing significant growth, driven by the rising demand for nutrient-rich and convenient dietary supplements. Green superfoods, such as spirulina, chlorella, and wheatgrass, are known for their high concentrations of vitamins, minerals, and antioxidants. The market benefits from advancements in drying and powdering technologies, the growing trend of health-conscious and on-the-go nutrition, and the expansion of the global functional food and dietary supplement sectors. Additionally, the increasing awareness of the benefits of green superfoods for overall health and wellness is contributing to market growth.
Green Superfood Competitive Landscape
The market report analyses the leading companies in the industry including Athletic Greens, Danone S.A., Greens First, MacroLife Naturals, Naturo Sciences, Nested Naturals, Nestlé SA, Purely Inspired, Vibrant Health, Vital Everyday, and Others.
Green Superfood Market Dynamics
Green Superfood Market Trend: Rising Demand for Nutrient-Dense Superfoods
The most prominent trend in the Green Superfood Market is the rising demand for nutrient-dense superfoods. As consumers seek to enhance their nutritional intake, green superfoods are gaining popularity for their rich nutrient profiles and health benefits. This trend is driven by the growing interest in functional foods and the desire for natural ingredients that support overall wellness.
Green Superfood Market Driver: Growth in Health and Wellness Consciousness
The key driver of the Green Superfood Market is the growth in health and wellness consciousness. As more people focus on maintaining a balanced diet and improving their overall health, there is a higher demand for superfoods that offer essential nutrients, such as green superfoods. This driver is supported by the trend towards clean-label products and the increasing availability of superfood supplements in the market, driving growth for green superfoods.
Green Superfood Market Opportunity: Innovation in Superfood Formulations and Applications
A significant opportunity in the Green Superfood Market lies in innovation in superfood formulations and applications. By developing new and unique products that incorporate green superfoods, such as powders, capsules, and functional beverages, companies can attract health-conscious consumers. Offering high-quality green superfood products that provide multiple health benefits can help expand market reach and drive growth in the functional food sector.
Green Superfood Market Share Analysis: Grasses Sourced segment generated the highest revenue share in the industry
In the Green Superfood Market, the largest segment by type is Grasses Sourced. Grasses such as wheatgrass, barley grass, and alfalfa are highly valued for their dense nutrient profiles, which include a wide array of vitamins, minerals, antioxidants, and chlorophyll. These grass-sourced superfoods are popular among health-conscious consumers seeking natural ways to enhance their nutritional intake and promote overall well-being. The versatility of grass-sourced superfoods allows them to be easily incorporated into various dietary supplements, smoothies, and health drinks. Their well-established reputation for supporting energy levels, detoxification, and immune function contributes significantly to their dominance in the green superfood market.
Green Superfood Market Share Analysis: Online Sales is the fastest growing segment over the forecast period to 2032
The fastest growing segment in the Green Superfood Market by application to 2032 is Online Sales. The growth of e-commerce has transformed consumer purchasing behavior, making online sales the most rapidly expanding distribution channel for green superfoods. Online platforms offer unparalleled convenience, providing consumers with access to a vast array of products, brands, and detailed information from the comfort of their homes. The ability to easily compare prices, read customer reviews, and benefit from frequent promotions and discounts further enhances the appeal of online shopping. The Past few yearshas accelerated this shift, with more consumers turning to online channels for their health and wellness needs. The combination of convenience, variety, and accessibility is driving the rapid growth of online sales in the green superfood market, making it the most dynamic segment in terms of future expansion.
Green Superfood Market Segmentation
By Type
Fermented Greens
Marine Sources
Grasses Sourced
Others
By Application
Supermarkets or Hypermarkets
Convenience Stores
Independent Retailers
Online Sales
Others
Countries Analyzed
North America (US, Canada, Mexico)
Europe (Germany, UK, France, Spain, Italy, Russia, Rest of Europe)
Asia Pacific (China, India, Japan, South Korea, Australia, South East Asia, Rest of Asia)
South America (Brazil, Argentina, Rest of South America)
Middle East and Africa (Saudi Arabia, UAE, Rest of Middle East, South Africa, Egypt, Rest of Africa)
Green Superfood Companies Profiled in the Study
Athletic Greens
Danone S.A.
Greens First
MacroLife Naturals
Naturo Sciences
Nested Naturals
Nestlé SA
Purely Inspired
Vibrant Health
Vital Everyday
*- List Not Exhaustive
Chapter 1. TABLE OF CONTENTS
Chapter 2. Introduction to Green Superfood Market
2.1. Market Overview
2.2. Key Statistics and Report Highlights
2.3. Scope of the Comprehensive Study
2.3.1. Market Definition
2.3.2 Countries and Regions Covered
2.3.3 Research Objective
2.3.4 Units, Currency, and Conversions
2.3.5 Industry Value Chain
2.4. Key Market Segments
2.5. Key Companies
2.6. Study Period
Chapter 3. Strategic Analysis Review
3.1. Green Superfood Pricing Analysis and Forecast
3.2. Porter’s Five Forces
3.3. Market Ecosystem
3.4. SWOT Analysis
3.5. Regulatory Scenario
3.3. Effects of Inflation, Russia-Ukraine War, moderating economic growth, and other macroeconomic factors
Chapter 4. Competitive Landscape
4.1. Market Share Analysis
4.1.1. Global Green Superfood Market Share by Company, 2023
4.1.2. Product Offerings of Leading Green Superfood Companies
4.2. Market Entropy
4.2.1. New Product Launches in the Industry
4.2.2. Mergers, Acquisitions, Joint ventures, and Partnerships
4.3. Key Strategies and Best Practices
Chapter 5. Global Market Projections: Best, Reference, and Low Case Scenarios
5.1. Growth Analysis- Case Scenario Definitions
5.2. Low Growth Case Scenario Forecasts
5.3. Reference Growth Case Scenario Forecasts
5.4. High Growth Case Scenario Forecasts
Chapter 6. Market Dynamics
6.1. Green Superfood Market Drivers
6.2. Green Superfood Market Challenges
6.6. Green Superfood Market Opportunities
6.4. Green Superfood Market Trends
Chapter 7. Global Green Superfood Market Outlook Trends
7.1. Global Green Superfood Revenue (USD Million) and CAGR (%) by Type (2021-2032)
7.2. Global Green Superfood Revenue (USD Million) and CAGR (%) by Application (2021-2032)
7.3. Global Green Superfood Revenue (USD Million) and CAGR (%) by Product (2021-2032)
By Type
Fermented Greens
Marine Sources
Grasses Sourced
Others
By Application
Supermarkets or Hypermarkets
Convenience Stores
Independent Retailers
Online Sales
Others
Chapter 8. Global Green Superfood Regional Analysis and Outlook
8.1. Global Green Superfood Revenue (USD Million) By Regions (2021- 2032)
8.2. North America Green Superfood Revenue (USD Million) by Country (2021-2032)
8.2.1. United States Green Superfood Regional Analysis and Outlook
8.2.2. Canada Green Superfood Regional Analysis and Outlook
8.2.3. Mexico Green Superfood Regional Analysis and Outlook
8.3. Europe Green Superfood Revenue (USD Million), by Country (2021-2032)
8.3.1. Germany Green Superfood Regional Analysis and Outlook
8.3.2. France Green Superfood Regional Analysis and Outlook
8.3.3. United Kingdom Green Superfood Regional Analysis and Outlook
8.3.4. Spain Green Superfood Regional Analysis and Outlook
8.3.5. Italy Green Superfood Regional Analysis and Outlook
8.3.6. Russia Green Superfood Regional Analysis and Outlook
8.3.7. Rest of Europe Green Superfood Regional Analysis and Outlook
8.4. Asia Pacific Green Superfood Revenue (USD Million) by Country (2021-2032)
8.4.1. China Green Superfood Regional Analysis and Outlook
8.4.2. Japan Green Superfood Regional Analysis and Outlook
8.4.3. India Green Superfood Regional Analysis and Outlook
8.4.4. South Korea Green Superfood Regional Analysis and Outlook
8.4.5. Australia Green Superfood Regional Analysis and Outlook
8.4.6. South East Asia Green Superfood Regional Analysis and Outlook
8.4.7. Rest of Asia Pacific Green Superfood Regional Analysis and Outlook
8.5. South America Green Superfood Revenue (USD Million), by Country (2021-2032)
8.5.1. Brazil Green Superfood Regional Analysis and Outlook
8.5.2. Argentina Green Superfood Regional Analysis and Outlook
8.5.3. Rest of South America Green Superfood Regional Analysis and Outlook
8.6. Middle East and Africa Green Superfood Revenue (USD Million) by Country (2021-2032)
8.6.1. Middle East Green Superfood Regional Analysis and Outlook
8.6.2. Africa Green Superfood Regional Analysis and Outlook
Chapter 9. North America Green Superfood Analysis and Outlook
9.1. North America Green Superfood Revenue (USD Million) by Segments (2021-2032)
9.1.1. North America Green Superfood Revenue (USD Million) by Type (2021-2032)
9.1.2. North America Green Superfood Revenue (USD Million) by Application (2021-2032)
9.1.3. North America Green Superfood Revenue (USD Million) by Product (2021-2032)
By Type
Fermented Greens
Marine Sources
Grasses Sourced
Others
By Application
Supermarkets or Hypermarkets
Convenience Stores
Independent Retailers
Online Sales
Others
Chapter 10. Europe Green Superfood Analysis and Outlook
10.1. Europe Green Superfood Revenue (USD Million), by Segments (USD Million) (2021-2032)
10.1.1. Europe Green Superfood Revenue (USD Million) by Type (2021-2032)
10.1.2. Europe Green Superfood Revenue (USD Million) by Application (2021-2032)
10.1.3. Europe Green Superfood Revenue (USD Million) by Product (2021-2032)
By Type
Fermented Greens
Marine Sources
Grasses Sourced
Others
By Application
Supermarkets or Hypermarkets
Convenience Stores
Independent Retailers
Online Sales
Others
Chapter 11. Asia Pacific Green Superfood Analysis and Outlook
11.1. Asia Pacific Green Superfood Revenue (USD Million), and Revenue (USD Million) by Segments (2021-2032)
11.1.1. Asia Pacific Green Superfood Revenue (USD Million) by Type (2021-2032)
11.1.2. Asia Pacific Green Superfood Revenue (USD Million) by Application (2021-2032)
11.1.3. Asia Pacific Green Superfood Revenue (USD Million) by Product (2021-2032)
By Type
Fermented Greens
Marine Sources
Grasses Sourced
Others
By Application
Supermarkets or Hypermarkets
Convenience Stores
Independent Retailers
Online Sales
Others
Chapter 12. South America Green Superfood Analysis and Outlook
12.1. South America Green Superfood Revenue (USD Million), by Segments (2021-2032)
12.1.1. South America Green Superfood Revenue (USD Million) by Type (2021-2032)
12.1.2. South America Green Superfood Revenue (USD Million) by Application (2021-2032)
12.1.3. South America Green Superfood Revenue (USD Million) by Product (2021-2032)
By Type
Fermented Greens
Marine Sources
Grasses Sourced
Others
By Application
Supermarkets or Hypermarkets
Convenience Stores
Independent Retailers
Online Sales
Others
Chapter 13. Middle East and Africa Green Superfood Analysis and Outlook
13.1. Middle East and Africa Green Superfood Revenue (USD Million), by Segments (2021-2032)
13.1.1. Middle East and Africa Green Superfood Revenue (USD Million) by Type (2021-2032)
13.1.2. Middle East and Africa Green Superfood Revenue (USD Million) by Application (2021-2032)
13.1.3. Middle East and Africa Green Superfood Revenue (USD Million) by Product (2021-2032)
By Type
Fermented Greens
Marine Sources
Grasses Sourced
Others
By Application
Supermarkets or Hypermarkets
Convenience Stores
Independent Retailers
Online Sales
Others
Chapter 14. Green Superfood Company Profiles
14.1 Business Overview
14.2 Product Profiles
14.3 SWOT Profiles
14.5 Recent Developments
14.6 Financial Profile
List of Companies
Athletic Greens
Danone S.A.
Greens First
MacroLife Naturals
Naturo Sciences
Nested Naturals
Nestlé SA
Purely Inspired
Vibrant Health
Vital Everyday
15. Methodology and Data Sources
15.1 Customization Offerings
15.2 Subscription Services
15.3 Related Reports
15.4 Publisher Expertise
LIST OF TABLES
Table 1 Market Segmentation Analysis
Table 2 Global Green Superfood Market Share of Leading Companies, 2023
Table 3 Product Offerings of Leading Companies
Table 4 Low Growth Scenario Forecasts
Table 5 Reference Case Growth Scenario
Table 6 High Growth Case Scenario
Table 7 Global Green Superfood Revenue (USD Million) And CAGR (%) By Type (2021-2032)
Table 8 Global Green Superfood Revenue (USD Million) And CAGR (%) By Application (2021-2032)
Table 9 Global Green Superfood Revenue (USD Million) And CAGR (%) By Product (2021-2032)
Table 10 Global Green Superfood Market Revenue (USD Million) By Regions (2021-2032)
Table 11 Global Green Superfood Market Share (%) By Regions (2021-2032)
Table 12 North America Green Superfood Revenue (USD Million) By Country (2021-2032)
Table 13 Europe Green Superfood Revenue (USD Million) By Country (2021-2032)
Table 14 Asia Pacific Green Superfood Revenue (USD Million) By Country (2021-2032)
Table 15 South America Green Superfood Revenue (USD Million) By Country (2021-2032)
Table 16 Middle East and Africa Green Superfood Revenue (USD Million) By Region (2021-2032)
Table 17 North America Green Superfood Revenue (USD Million) By Type (2021-2032)
Table 18 North America Green Superfood Revenue (USD Million) By Application (2021-2032)
Table 19 North America Green Superfood Revenue (USD Million) By Product (2021-2032)
Table 20 Europe Green Superfood Revenue (USD Million) By Type (2021-2032)
Table 21 Europe Green Superfood Revenue (USD Million) By Application (2021-2032)
Table 22 Europe Green Superfood Revenue (USD Million) By Product (2021-2032)
Table 23 Asia Pacific Green Superfood Revenue (USD Million) By Type (2021-2032)
Table 24 Asia Pacific Green Superfood Revenue (USD Million) By Application (2021-2032)
Table 25 Asia Pacific Green Superfood Revenue (USD Million) By Product (2021-2032)
Table 26 South America Green Superfood Revenue (USD Million) By Type (2021-2032)
Table 27 South America Green Superfood Revenue (USD Million) By Application (2021-2032)
Table 28 South America Green Superfood Revenue (USD Million) By Product (2021-2032)
Table 29 Middle East and Africa Green Superfood Revenue (USD Million) By Type (2021-2032)
Table 30 Middle East and Africa Green Superfood Revenue (USD Million) By Application (2021-2032)
Table 31 Middle East and Africa Green Superfood Revenue (USD Million) By Product (2021-2032)
LIST OF FIGURES
Figure 1. Market Scope
Figure 2. Pricing Forecasts Per Unit, 2023- 2032
Figure 3. Porter’s Five Forces
Figure 4. Global Green Superfood Market Revenue (USD Million) By Regions (2021-2032)
Figure 5. Global Green Superfood Market Share (%) By Regions (2023)
Figure 6. North America Green Superfood Revenue (USD Million) By Country (2021-2032)
Figure 7. United States Green Superfood Revenue (USD Million) By Country (2021-2032)
Figure 8. Canada Green Superfood Revenue (USD Million) By Country (2021-2032)
Figure 9. Mexico Green Superfood Revenue (USD Million) By Country (2021-2032)
Figure 10. Europe Green Superfood Revenue (USD Million) By Country (2021-2032)
Figure 11. Germany Green Superfood Revenue (USD Million) By Country (2021-2032)
Figure 12. France Green Superfood Revenue (USD Million) By Country (2021-2032)
Figure 13. United Kingdom Green Superfood Revenue (USD Million) By Country (2021-2032)
Figure 14. Spain Green Superfood Revenue (USD Million) By Country (2021-2032)
Figure 15. Italy Green Superfood Revenue (USD Million) By Country (2021-2032)
Figure 16. Russia Green Superfood Revenue (USD Million) By Country (2021-2032)
Figure 17. Rest of Europe Green Superfood Revenue (USD Million) By Country (2021-2032)
Figure 11. Asia Pacific Green Superfood Revenue (USD Million) By Country (2021-2032)
Figure 12. China Green Superfood Revenue (USD Million) By Country (2021-2032)
Figure 13. Japan Green Superfood Revenue (USD Million) By Country (2021-2032)
Figure 14. India Green Superfood Revenue (USD Million) By Country (2021-2032)
Figure 15. South Korea Green Superfood Revenue (USD Million) By Country (2021-2032)
Figure 16. Australia Green Superfood Revenue (USD Million) By Country (2021-2032)
Figure 17. South East Asia Green Superfood Revenue (USD Million) By Country (2021-2032)
Figure 18. South America Green Superfood Revenue (USD Million) By Country (2021-2032)
Figure 19. Brazil Green Superfood Revenue (USD Million) By Country (2021-2032)
Figure 20. Argentina Green Superfood Revenue (USD Million) By Country (2021-2032)
Figure 21. Rest of Asia Pacific Green Superfood Revenue (USD Million) By Country (2021-2032)
Figure 22. Middle East and Africa Green Superfood Revenue (USD Million) By Region (2021-2032)
Figure 23. Saudi Arabia Green Superfood Revenue (USD Million) By Region (2021-2032)
Figure 24. The UAE Green Superfood Revenue (USD Million) By Region (2021-2032)
Figure 25. Rest of Middle East Green Superfood Revenue (USD Million) By Region (2021-2032)
Figure 26. South Africa Green Superfood Revenue (USD Million) By Region (2021-2032)
Figure 27. Africa Green Superfood Revenue (USD Million) By Region (2021-2032)
Figure 28. North America Green Superfood Revenue (USD Million) By Type (2021-2032)
Figure 29. North America Green Superfood Revenue (USD Million) By Application (2021-2032)
Figure 30. North America Green Superfood Revenue (USD Million) By Product (2021-2032)
Figure 31. Europe Green Superfood Revenue (USD Million) By Type (2021-2032)
Figure 32. Europe Green Superfood Revenue (USD Million) By Application (2021-2032)
Figure 33. Europe Green Superfood Revenue (USD Million) By Product (2021-2032)
Figure 34. Asia Pacific Green Superfood Revenue (USD Million) By Type (2021-2032)
Figure 35. Asia Pacific Green Superfood Revenue (USD Million) By Application (2021-2032)
Figure 36. Asia Pacific Green Superfood Revenue (USD Million) By Product (2021-2032)
Figure 37. South America Green Superfood Revenue (USD Million) By Type (2021-2032)
Figure 38. South America Green Superfood Revenue (USD Million) By Application (2021-2032)
Figure 39. South America Green Superfood Revenue (USD Million) By Product (2021-2032)
Figure 40. Middle East and Africa Green Superfood Revenue (USD Million) By Type (2021-2032)
Figure 41. Middle East and Africa Green Superfood Revenue (USD Million) By Application (2021-2032)
Figure 42. Middle East and Africa Green Superfood Revenue (USD Million) By Product (2021-2032)
By Type
Fermented Greens
Marine Sources
Grasses Sourced
Others
By Application
Supermarkets or Hypermarkets
Convenience Stores
Independent Retailers
Online Sales
Others
Countries Analyzed
North America (US, Canada, Mexico)
Europe (Germany, UK, France, Spain, Italy, Russia, Rest of Europe)
Asia Pacific (China, India, Japan, South Korea, Australia, South East Asia, Rest of Asia)
South America (Brazil, Argentina, Rest of South America)
Middle East and Africa (Saudi Arabia, UAE, Rest of Middle East, South Africa, Egypt, Rest of Africa)
