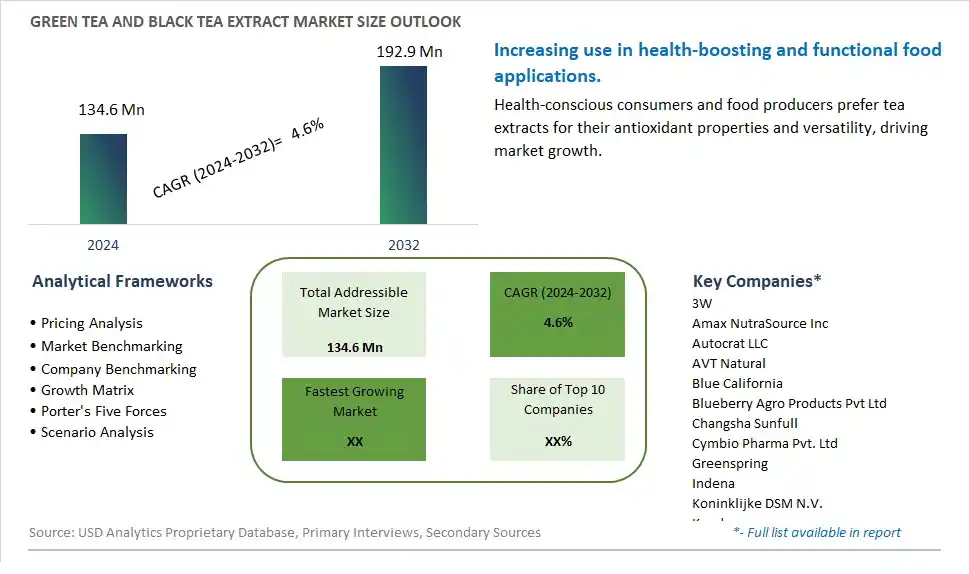
Global Green Tea and Black Tea Extract Market Size is valued at $134.6 Million in 2024 and is forecast to register a growth rate (CAGR) of 4.6% to reach $192.9 Million by 2032.
The global Green Tea and Black Tea Extract Market Comprehensive Study analyzes and forecasts the market size across 6 regions and 24 countries for diverse segments -By Type (Powder, Liquid, Encapsulated), By Application (Functional Food, Beverages, Cosmetics, Beauty Supplements, Others)
An Introduction to Green Tea and Black Tea Extract Market
The Green Tea and Black Tea Extract market in 2024 is thriving, fueled by the rising demand for natural and effective health supplements and food additives. Green and black tea extracts, rich in antioxidants and polyphenols, are popular for their potential health benefits, including weight management and cardiovascular support. The market benefits from advancements in extraction and formulation technologies, the growing trend of natural and functional ingredients, and the expansion of the global nutraceutical and food sectors. Additionally, the increasing focus on clean label and scientifically backed ingredients is contributing to market growth.
Green Tea and Black Tea Extract Competitive Landscape
The market report analyses the leading companies in the industry including 3W, Amax NutraSource Inc, Autocrat LLC, AVT Natural, Blue California, Blueberry Agro Products Pvt Ltd, Changsha Sunfull, Cymbio Pharma Pvt. Ltd, Greenspring, Indena, Koninklijke DSM N.V., Kunda, Martin Bauer Group, Meihe, Phyto Life Sciences P. Ltd, Synthite, Taiyo, Tate & Lyle Plc, Teawolf, and Others.
Green Tea and Black Tea Extract Market Dynamics
Green Tea and Black Tea Extract Market Trend: Increasing Use of Tea Extracts in Health Products
The most prominent trend in the Green Tea and Black Tea Extract Market is the increasing use of tea extracts in health products. As consumers seek natural and effective health supplements, green tea and black tea extracts are gaining popularity for their antioxidant and metabolic benefits. This trend is driven by the growing interest in natural health supplements that offer specific benefits.
Green Tea and Black Tea Extract Market Driver: Growth in Health and Wellness Consciousness
The key driver of the Green Tea and Black Tea Extract Market is the growth in health and wellness consciousness. As more people focus on maintaining a healthy lifestyle, there is a higher demand for natural supplements that offer specific health benefits, such as tea extracts. This driver is supported by the trend towards clean-label products and the increasing availability of natural health supplements in the market, driving growth for green tea and black tea extracts.
Green Tea and Black Tea Extract Market Opportunity: Expansion into Functional Food and Beverage Applications
A significant opportunity in the Green Tea and Black Tea Extract Market lies in the expansion into functional food and beverage applications. By developing innovative products that incorporate tea extracts, such as fortified drinks, dietary supplements, and skincare items, companies can attract health-conscious consumers. Offering high-quality tea extract products that provide multiple health benefits can help expand market reach and drive growth in the functional food and health supplement sector.
Green Tea and Black Tea Extract Market Share Analysis: Powder segment generated the highest revenue share in the industry
In the Green Tea and Black Tea Extract Market, the largest segment by type is Powder. Powdered tea extracts are highly versatile and widely used across various industries, including food and beverages, dietary supplements, and cosmetics. The powder form allows for easy incorporation into a variety of products, providing the benefits of tea extracts such as antioxidants, catechins, and polyphenols in a convenient and stable form. The ease of storage, extended shelf life, and ability to maintain the nutritional and therapeutic properties of the tea contribute to the dominance of the powdered segment. Its popularity in functional foods and health supplements further underscores its leading position in the market.
Green Tea and Black Tea Extract Market Share Analysis: Cosmetics is the fastest growing segment over the forecast period to 2032
The fastest growing segment in the Green Tea and Black Tea Extract Market by application to 2032 is Cosmetics. Tea extracts, particularly those from green and black tea, are increasingly being incorporated into cosmetic and skincare products due to their powerful antioxidant properties, which help in combating free radicals and preventing skin aging. The anti-inflammatory and antimicrobial properties of tea extracts make them valuable ingredients in formulations aimed at soothing the skin, reducing redness, and treating acne. As consumers become more aware of the benefits of natural and plant-based ingredients in their beauty and skincare routines, the demand for products containing tea extracts is expected to surge. This trend is driving the rapid growth of the cosmetics segment within the green tea and black tea extract market, with manufacturers innovating and expanding their product lines to include these beneficial extracts.
Green Tea and Black Tea Extract Market Segmentation
By Type
Powder
Liquid
Encapsulated
By Application
Functional Food
Beverages
Cosmetics
Beauty Supplements
Others
Countries Analyzed
North America (US, Canada, Mexico)
Europe (Germany, UK, France, Spain, Italy, Russia, Rest of Europe)
Asia Pacific (China, India, Japan, South Korea, Australia, South East Asia, Rest of Asia)
South America (Brazil, Argentina, Rest of South America)
Middle East and Africa (Saudi Arabia, UAE, Rest of Middle East, South Africa, Egypt, Rest of Africa)
Green Tea and Black Tea Extract Companies Profiled in the Study
3W
Amax NutraSource Inc
Autocrat LLC
AVT Natural
Blue California
Blueberry Agro Products Pvt Ltd
Changsha Sunfull
Cymbio Pharma Pvt. Ltd
Greenspring
Indena
Koninklijke DSM N.V.
Kunda
Martin Bauer Group
Meihe
Phyto Life Sciences P. Ltd
Synthite
Taiyo
Tate & Lyle Plc
Teawolf
*- List Not Exhaustive
Chapter 1. TABLE OF CONTENTS
Chapter 2. Introduction to Green Tea and Black Tea Extract Market
2.1. Market Overview
2.2. Key Statistics and Report Highlights
2.3. Scope of the Comprehensive Study
2.3.1. Market Definition
2.3.2 Countries and Regions Covered
2.3.3 Research Objective
2.3.4 Units, Currency, and Conversions
2.3.5 Industry Value Chain
2.4. Key Market Segments
2.5. Key Companies
2.6. Study Period
Chapter 3. Strategic Analysis Review
3.1. Green Tea and Black Tea Extract Pricing Analysis and Forecast
3.2. Porter’s Five Forces
3.3. Market Ecosystem
3.4. SWOT Analysis
3.5. Regulatory Scenario
3.3. Effects of Inflation, Russia-Ukraine War, moderating economic growth, and other macroeconomic factors
Chapter 4. Competitive Landscape
4.1. Market Share Analysis
4.1.1. Global Green Tea and Black Tea Extract Market Share by Company, 2023
4.1.2. Product Offerings of Leading Green Tea and Black Tea Extract Companies
4.2. Market Entropy
4.2.1. New Product Launches in the Industry
4.2.2. Mergers, Acquisitions, Joint ventures, and Partnerships
4.3. Key Strategies and Best Practices
Chapter 5. Global Market Projections: Best, Reference, and Low Case Scenarios
5.1. Growth Analysis- Case Scenario Definitions
5.2. Low Growth Case Scenario Forecasts
5.3. Reference Growth Case Scenario Forecasts
5.4. High Growth Case Scenario Forecasts
Chapter 6. Market Dynamics
6.1. Green Tea and Black Tea Extract Market Drivers
6.2. Green Tea and Black Tea Extract Market Challenges
6.6. Green Tea and Black Tea Extract Market Opportunities
6.4. Green Tea and Black Tea Extract Market Trends
Chapter 7. Global Green Tea and Black Tea Extract Market Outlook Trends
7.1. Global Green Tea and Black Tea Extract Revenue (USD Million) and CAGR (%) by Type (2021-2032)
7.2. Global Green Tea and Black Tea Extract Revenue (USD Million) and CAGR (%) by Application (2021-2032)
7.3. Global Green Tea and Black Tea Extract Revenue (USD Million) and CAGR (%) by Product (2021-2032)
By Type
Powder
Liquid
Encapsulated
By Application
Functional Food
Beverages
Cosmetics
Beauty Supplements
Others
Chapter 8. Global Green Tea and Black Tea Extract Regional Analysis and Outlook
8.1. Global Green Tea and Black Tea Extract Revenue (USD Million) By Regions (2021- 2032)
8.2. North America Green Tea and Black Tea Extract Revenue (USD Million) by Country (2021-2032)
8.2.1. United States Green Tea and Black Tea Extract Regional Analysis and Outlook
8.2.2. Canada Green Tea and Black Tea Extract Regional Analysis and Outlook
8.2.3. Mexico Green Tea and Black Tea Extract Regional Analysis and Outlook
8.3. Europe Green Tea and Black Tea Extract Revenue (USD Million), by Country (2021-2032)
8.3.1. Germany Green Tea and Black Tea Extract Regional Analysis and Outlook
8.3.2. France Green Tea and Black Tea Extract Regional Analysis and Outlook
8.3.3. United Kingdom Green Tea and Black Tea Extract Regional Analysis and Outlook
8.3.4. Spain Green Tea and Black Tea Extract Regional Analysis and Outlook
8.3.5. Italy Green Tea and Black Tea Extract Regional Analysis and Outlook
8.3.6. Russia Green Tea and Black Tea Extract Regional Analysis and Outlook
8.3.7. Rest of Europe Green Tea and Black Tea Extract Regional Analysis and Outlook
8.4. Asia Pacific Green Tea and Black Tea Extract Revenue (USD Million) by Country (2021-2032)
8.4.1. China Green Tea and Black Tea Extract Regional Analysis and Outlook
8.4.2. Japan Green Tea and Black Tea Extract Regional Analysis and Outlook
8.4.3. India Green Tea and Black Tea Extract Regional Analysis and Outlook
8.4.4. South Korea Green Tea and Black Tea Extract Regional Analysis and Outlook
8.4.5. Australia Green Tea and Black Tea Extract Regional Analysis and Outlook
8.4.6. South East Asia Green Tea and Black Tea Extract Regional Analysis and Outlook
8.4.7. Rest of Asia Pacific Green Tea and Black Tea Extract Regional Analysis and Outlook
8.5. South America Green Tea and Black Tea Extract Revenue (USD Million), by Country (2021-2032)
8.5.1. Brazil Green Tea and Black Tea Extract Regional Analysis and Outlook
8.5.2. Argentina Green Tea and Black Tea Extract Regional Analysis and Outlook
8.5.3. Rest of South America Green Tea and Black Tea Extract Regional Analysis and Outlook
8.6. Middle East and Africa Green Tea and Black Tea Extract Revenue (USD Million) by Country (2021-2032)
8.6.1. Middle East Green Tea and Black Tea Extract Regional Analysis and Outlook
8.6.2. Africa Green Tea and Black Tea Extract Regional Analysis and Outlook
Chapter 9. North America Green Tea and Black Tea Extract Analysis and Outlook
9.1. North America Green Tea and Black Tea Extract Revenue (USD Million) by Segments (2021-2032)
9.1.1. North America Green Tea and Black Tea Extract Revenue (USD Million) by Type (2021-2032)
9.1.2. North America Green Tea and Black Tea Extract Revenue (USD Million) by Application (2021-2032)
9.1.3. North America Green Tea and Black Tea Extract Revenue (USD Million) by Product (2021-2032)
By Type
Powder
Liquid
Encapsulated
By Application
Functional Food
Beverages
Cosmetics
Beauty Supplements
Others
Chapter 10. Europe Green Tea and Black Tea Extract Analysis and Outlook
10.1. Europe Green Tea and Black Tea Extract Revenue (USD Million), by Segments (USD Million) (2021-2032)
10.1.1. Europe Green Tea and Black Tea Extract Revenue (USD Million) by Type (2021-2032)
10.1.2. Europe Green Tea and Black Tea Extract Revenue (USD Million) by Application (2021-2032)
10.1.3. Europe Green Tea and Black Tea Extract Revenue (USD Million) by Product (2021-2032)
By Type
Powder
Liquid
Encapsulated
By Application
Functional Food
Beverages
Cosmetics
Beauty Supplements
Others
Chapter 11. Asia Pacific Green Tea and Black Tea Extract Analysis and Outlook
11.1. Asia Pacific Green Tea and Black Tea Extract Revenue (USD Million), and Revenue (USD Million) by Segments (2021-2032)
11.1.1. Asia Pacific Green Tea and Black Tea Extract Revenue (USD Million) by Type (2021-2032)
11.1.2. Asia Pacific Green Tea and Black Tea Extract Revenue (USD Million) by Application (2021-2032)
11.1.3. Asia Pacific Green Tea and Black Tea Extract Revenue (USD Million) by Product (2021-2032)
By Type
Powder
Liquid
Encapsulated
By Application
Functional Food
Beverages
Cosmetics
Beauty Supplements
Others
Chapter 12. South America Green Tea and Black Tea Extract Analysis and Outlook
12.1. South America Green Tea and Black Tea Extract Revenue (USD Million), by Segments (2021-2032)
12.1.1. South America Green Tea and Black Tea Extract Revenue (USD Million) by Type (2021-2032)
12.1.2. South America Green Tea and Black Tea Extract Revenue (USD Million) by Application (2021-2032)
12.1.3. South America Green Tea and Black Tea Extract Revenue (USD Million) by Product (2021-2032)
By Type
Powder
Liquid
Encapsulated
By Application
Functional Food
Beverages
Cosmetics
Beauty Supplements
Others
Chapter 13. Middle East and Africa Green Tea and Black Tea Extract Analysis and Outlook
13.1. Middle East and Africa Green Tea and Black Tea Extract Revenue (USD Million), by Segments (2021-2032)
13.1.1. Middle East and Africa Green Tea and Black Tea Extract Revenue (USD Million) by Type (2021-2032)
13.1.2. Middle East and Africa Green Tea and Black Tea Extract Revenue (USD Million) by Application (2021-2032)
13.1.3. Middle East and Africa Green Tea and Black Tea Extract Revenue (USD Million) by Product (2021-2032)
By Type
Powder
Liquid
Encapsulated
By Application
Functional Food
Beverages
Cosmetics
Beauty Supplements
Others
Chapter 14. Green Tea and Black Tea Extract Company Profiles
14.1 Business Overview
14.2 Product Profiles
14.3 SWOT Profiles
14.5 Recent Developments
14.6 Financial Profile
List of Companies
3W
Amax NutraSource Inc
Autocrat LLC
AVT Natural
Blue California
Blueberry Agro Products Pvt Ltd
Changsha Sunfull
Cymbio Pharma Pvt. Ltd
Greenspring
Indena
Koninklijke DSM N.V.
Kunda
Martin Bauer Group
Meihe
Phyto Life Sciences P. Ltd
Synthite
Taiyo
Tate & Lyle Plc
Teawolf
15. Methodology and Data Sources
15.1 Customization Offerings
15.2 Subscription Services
15.3 Related Reports
15.4 Publisher Expertise
LIST OF TABLES
Table 1 Market Segmentation Analysis
Table 2 Global Green Tea and Black Tea Extract Market Share of Leading Companies, 2023
Table 3 Product Offerings of Leading Companies
Table 4 Low Growth Scenario Forecasts
Table 5 Reference Case Growth Scenario
Table 6 High Growth Case Scenario
Table 7 Global Green Tea and Black Tea Extract Revenue (USD Million) And CAGR (%) By Type (2021-2032)
Table 8 Global Green Tea and Black Tea Extract Revenue (USD Million) And CAGR (%) By Application (2021-2032)
Table 9 Global Green Tea and Black Tea Extract Revenue (USD Million) And CAGR (%) By Product (2021-2032)
Table 10 Global Green Tea and Black Tea Extract Market Revenue (USD Million) By Regions (2021-2032)
Table 11 Global Green Tea and Black Tea Extract Market Share (%) By Regions (2021-2032)
Table 12 North America Green Tea and Black Tea Extract Revenue (USD Million) By Country (2021-2032)
Table 13 Europe Green Tea and Black Tea Extract Revenue (USD Million) By Country (2021-2032)
Table 14 Asia Pacific Green Tea and Black Tea Extract Revenue (USD Million) By Country (2021-2032)
Table 15 South America Green Tea and Black Tea Extract Revenue (USD Million) By Country (2021-2032)
Table 16 Middle East and Africa Green Tea and Black Tea Extract Revenue (USD Million) By Region (2021-2032)
Table 17 North America Green Tea and Black Tea Extract Revenue (USD Million) By Type (2021-2032)
Table 18 North America Green Tea and Black Tea Extract Revenue (USD Million) By Application (2021-2032)
Table 19 North America Green Tea and Black Tea Extract Revenue (USD Million) By Product (2021-2032)
Table 20 Europe Green Tea and Black Tea Extract Revenue (USD Million) By Type (2021-2032)
Table 21 Europe Green Tea and Black Tea Extract Revenue (USD Million) By Application (2021-2032)
Table 22 Europe Green Tea and Black Tea Extract Revenue (USD Million) By Product (2021-2032)
Table 23 Asia Pacific Green Tea and Black Tea Extract Revenue (USD Million) By Type (2021-2032)
Table 24 Asia Pacific Green Tea and Black Tea Extract Revenue (USD Million) By Application (2021-2032)
Table 25 Asia Pacific Green Tea and Black Tea Extract Revenue (USD Million) By Product (2021-2032)
Table 26 South America Green Tea and Black Tea Extract Revenue (USD Million) By Type (2021-2032)
Table 27 South America Green Tea and Black Tea Extract Revenue (USD Million) By Application (2021-2032)
Table 28 South America Green Tea and Black Tea Extract Revenue (USD Million) By Product (2021-2032)
Table 29 Middle East and Africa Green Tea and Black Tea Extract Revenue (USD Million) By Type (2021-2032)
Table 30 Middle East and Africa Green Tea and Black Tea Extract Revenue (USD Million) By Application (2021-2032)
Table 31 Middle East and Africa Green Tea and Black Tea Extract Revenue (USD Million) By Product (2021-2032)
LIST OF FIGURES
Figure 1. Market Scope
Figure 2. Pricing Forecasts Per Unit, 2023- 2032
Figure 3. Porter’s Five Forces
Figure 4. Global Green Tea and Black Tea Extract Market Revenue (USD Million) By Regions (2021-2032)
Figure 5. Global Green Tea and Black Tea Extract Market Share (%) By Regions (2023)
Figure 6. North America Green Tea and Black Tea Extract Revenue (USD Million) By Country (2021-2032)
Figure 7. United States Green Tea and Black Tea Extract Revenue (USD Million) By Country (2021-2032)
Figure 8. Canada Green Tea and Black Tea Extract Revenue (USD Million) By Country (2021-2032)
Figure 9. Mexico Green Tea and Black Tea Extract Revenue (USD Million) By Country (2021-2032)
Figure 10. Europe Green Tea and Black Tea Extract Revenue (USD Million) By Country (2021-2032)
Figure 11. Germany Green Tea and Black Tea Extract Revenue (USD Million) By Country (2021-2032)
Figure 12. France Green Tea and Black Tea Extract Revenue (USD Million) By Country (2021-2032)
Figure 13. United Kingdom Green Tea and Black Tea Extract Revenue (USD Million) By Country (2021-2032)
Figure 14. Spain Green Tea and Black Tea Extract Revenue (USD Million) By Country (2021-2032)
Figure 15. Italy Green Tea and Black Tea Extract Revenue (USD Million) By Country (2021-2032)
Figure 16. Russia Green Tea and Black Tea Extract Revenue (USD Million) By Country (2021-2032)
Figure 17. Rest of Europe Green Tea and Black Tea Extract Revenue (USD Million) By Country (2021-2032)
Figure 11. Asia Pacific Green Tea and Black Tea Extract Revenue (USD Million) By Country (2021-2032)
Figure 12. China Green Tea and Black Tea Extract Revenue (USD Million) By Country (2021-2032)
Figure 13. Japan Green Tea and Black Tea Extract Revenue (USD Million) By Country (2021-2032)
Figure 14. India Green Tea and Black Tea Extract Revenue (USD Million) By Country (2021-2032)
Figure 15. South Korea Green Tea and Black Tea Extract Revenue (USD Million) By Country (2021-2032)
Figure 16. Australia Green Tea and Black Tea Extract Revenue (USD Million) By Country (2021-2032)
Figure 17. South East Asia Green Tea and Black Tea Extract Revenue (USD Million) By Country (2021-2032)
Figure 18. South America Green Tea and Black Tea Extract Revenue (USD Million) By Country (2021-2032)
Figure 19. Brazil Green Tea and Black Tea Extract Revenue (USD Million) By Country (2021-2032)
Figure 20. Argentina Green Tea and Black Tea Extract Revenue (USD Million) By Country (2021-2032)
Figure 21. Rest of Asia Pacific Green Tea and Black Tea Extract Revenue (USD Million) By Country (2021-2032)
Figure 22. Middle East and Africa Green Tea and Black Tea Extract Revenue (USD Million) By Region (2021-2032)
Figure 23. Saudi Arabia Green Tea and Black Tea Extract Revenue (USD Million) By Region (2021-2032)
Figure 24. The UAE Green Tea and Black Tea Extract Revenue (USD Million) By Region (2021-2032)
Figure 25. Rest of Middle East Green Tea and Black Tea Extract Revenue (USD Million) By Region (2021-2032)
Figure 26. South Africa Green Tea and Black Tea Extract Revenue (USD Million) By Region (2021-2032)
Figure 27. Africa Green Tea and Black Tea Extract Revenue (USD Million) By Region (2021-2032)
Figure 28. North America Green Tea and Black Tea Extract Revenue (USD Million) By Type (2021-2032)
Figure 29. North America Green Tea and Black Tea Extract Revenue (USD Million) By Application (2021-2032)
Figure 30. North America Green Tea and Black Tea Extract Revenue (USD Million) By Product (2021-2032)
Figure 31. Europe Green Tea and Black Tea Extract Revenue (USD Million) By Type (2021-2032)
Figure 32. Europe Green Tea and Black Tea Extract Revenue (USD Million) By Application (2021-2032)
Figure 33. Europe Green Tea and Black Tea Extract Revenue (USD Million) By Product (2021-2032)
Figure 34. Asia Pacific Green Tea and Black Tea Extract Revenue (USD Million) By Type (2021-2032)
Figure 35. Asia Pacific Green Tea and Black Tea Extract Revenue (USD Million) By Application (2021-2032)
Figure 36. Asia Pacific Green Tea and Black Tea Extract Revenue (USD Million) By Product (2021-2032)
Figure 37. South America Green Tea and Black Tea Extract Revenue (USD Million) By Type (2021-2032)
Figure 38. South America Green Tea and Black Tea Extract Revenue (USD Million) By Application (2021-2032)
Figure 39. South America Green Tea and Black Tea Extract Revenue (USD Million) By Product (2021-2032)
Figure 40. Middle East and Africa Green Tea and Black Tea Extract Revenue (USD Million) By Type (2021-2032)
Figure 41. Middle East and Africa Green Tea and Black Tea Extract Revenue (USD Million) By Application (2021-2032)
Figure 42. Middle East and Africa Green Tea and Black Tea Extract Revenue (USD Million) By Product (2021-2032)
By Type
Powder
Liquid
Encapsulated
By Application
Functional Food
Beverages
Cosmetics
Beauty Supplements
Others
Countries Analyzed
North America (US, Canada, Mexico)
Europe (Germany, UK, France, Spain, Italy, Russia, Rest of Europe)
Asia Pacific (China, India, Japan, South Korea, Australia, South East Asia, Rest of Asia)
South America (Brazil, Argentina, Rest of South America)
Middle East and Africa (Saudi Arabia, UAE, Rest of Middle East, South Africa, Egypt, Rest of Africa)
