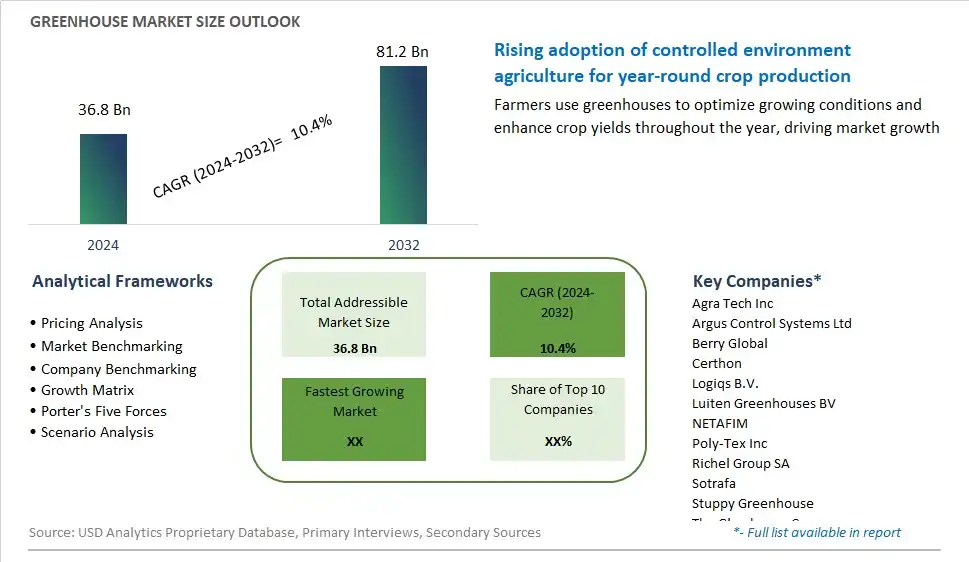
Global Greenhouse Market Size is valued at $36.8 Billion in 2024 and is forecast to register a growth rate (CAGR) of 10.4% to reach $81.2 Billion by 2032.
The global Greenhouse Market Comprehensive Study analyzes and forecasts the market size across 6 regions and 24 countries for diverse segments -By Type (Glass Greenhouse, Plastic Greenhouse), By Offering (Hardware, Software, Services), By Crop (Fruits, Vegetables & Herbs, Flowers & Ornamentals, Others), By End-User (Commercial Growers, Research and Educational Institutes, Retail Gardens, Others)
An Introduction to Greenhouse Market
In 2024, the global greenhouse market is experiencing significant expansion driven by the imperative to enhance agricultural productivity, ensure food security, and mitigate the adverse effects of climate change on crop yields. Greenhouses provide a controlled environment for cultivating crops year-round, offering protection from extreme weather conditions, pests, and diseases while optimizing resource utilization such as water and fertilizers. The adoption of advanced greenhouse technologies, including automated climate control systems, hydroponic and aeroponic cultivation methods, and renewable energy solutions, has revolutionized modern greenhouse farming practices, enabling growers to achieve higher yields and better crop quality. Additionally, increasing consumer demand for locally grown, sustainably sourced produce has spurred the proliferation of greenhouses in urban and peri-urban areas, facilitating farm-to-table supply chains and reducing food miles. As governments incentivize greenhouse farming initiatives and stakeholders invest in research and development to further innovate and optimize greenhouse operations, the global greenhouse market is poised for continued growth and transformation.
Greenhouse Competitive Landscape
The market report analyses the leading companies in the industry including Agra Tech Inc, Argus Control Systems Ltd, Berry Global, Certhon, Logiqs B.V., Luiten Greenhouses BV, NETAFIM, Poly-Tex Inc, Richel Group SA, Sotrafa, Stuppy Greenhouse, The Glasshouse Company, and Others.
Greenhouse Market Dynamics
Greenhouse Market Trend: Increasing Adoption of Controlled Environment Agriculture
A prominent trend in the greenhouse market is the rising adoption of controlled environment agriculture (CEA) practices. With growing concerns about food security, climate change, and resource conservation, there's a shift towards more sustainable and efficient methods of food production. Greenhouses offer controlled environments where variables such as temperature, humidity, light, and pests can be managed to optimize plant growth and crop yield. This trend is driven by the desire for year-round production, higher-quality crops, reduced dependence on conventional farming methods, and the ability to grow crops in regions with unfavorable climates or limited arable land.
Market Driver: Growing Demand for Fresh, Locally Grown Produce
A key driver of the greenhouse market is the increasing demand for fresh, locally grown produce. Consumers are increasingly seeking out fruits, vegetables, herbs, and flowers that are grown closer to home, as they perceive locally sourced products to be fresher, safer, and more environmentally sustainable. Greenhouses enable year-round production of a wide variety of crops, allowing growers to supply fresh produce to local markets and retailers regardless of seasonal limitations. This demand for locally grown, greenhouse-produced food drives investments in greenhouse infrastructure, technology, and cultivation practices to meet the needs of both consumers and the food industry.
Market Opportunity: Expansion of Urban and Vertical Farming
An opportunity for growth in the greenhouse market lies in the expansion of urban and vertical farming initiatives. As urbanization continues to increase and available land for traditional agriculture diminishes, there's growing interest in utilizing vertical spaces within urban environments for food production. Greenhouses play a crucial role in urban farming by providing controlled environments for growing crops vertically or on rooftops, balconies, and vacant lots. By leveraging greenhouse technology and vertical farming systems, growers can maximize space utilization, increase crop productivity, and supply fresh produce to urban populations. This presents opportunities for greenhouse manufacturers, technology providers, and urban farmers to collaborate and innovate solutions tailored to the unique challenges and opportunities of urban agriculture.
Greenhouse Market Share Analysis: Plastic Greenhouse market is poised to register the fastest growth rae over the forecast period to 2032
Among the segments delineated within the Greenhouse Market, the Plastic Greenhouse sector is the largest and fastest-growing. The surge in demand for plastic greenhouses, particularly those utilizing polyethylene, polycarbonate, and polymethyl-methacrylate, stems from several factors. Firstly, these materials offer cost-effectiveness and durability, catering to a diverse range of agricultural needs. Additionally, the flexibility and versatility of plastic structures enable growers to create customized environments conducive to optimal plant growth, thus enhancing productivity and yield. Further, the advancements in technology associated with plastic greenhouse construction, including improved insulation and climate control features, further contribute to their popularity. As sustainable agriculture gains momentum globally, the adoption of plastic greenhouses aligns with eco-friendly practices by minimizing water consumption and pesticide usage while maximizing energy efficiency. Consequently, the Plastic Greenhouse segment not only dominates the market but also signifies a pivotal shift towards innovative, environmentally-conscious farming practices.
Greenhouse Market Share Analysis: Climate Control Systems market is poised to register the fastest growth rae over the forecast period to 2032
Within the Greenhouse Market segmentation based on offerings, the Climate Control Systems segment is the fastest-growing sector, propelled by several key factors. With climate variability and extreme weather events becoming increasingly prevalent, growers worldwide seek innovative solutions to maintain optimal growing conditions for their crops. Climate control systems provide a comprehensive suite of functionalities, including temperature and humidity regulation, ventilation, and CO2 management, thus empowering growers to create tailored environments conducive to plant growth and productivity. Further, advancements in sensor technology and automation capabilities have enhanced the precision and efficiency of climate control systems, enabling real-time monitoring and adjustment of environmental parameters. Furthermore, the growing awareness and adoption of sustainable farming practices drive the demand for energy-efficient climate control solutions, which not only optimize resource utilization but also reduce operational costs in the long run. As a result, the Climate Control Systems segment not only spearheads growth within the greenhouse market but also signifies a paradigm shift towards precision agriculture and sustainable food production.
Greenhouse Market Share Analysis: Vegetables & Herbs held the dominant market share in 2024
Within the Greenhouse Market categorized by crop types, the segment of Vegetables & Herbs stands out as the largest, commanding a significant portion of market share. This dominance can be attributed to several factors that underscore the enduring appeal of greenhouse cultivation for vegetables and herbs. Firstly, the increasing consumer demand for fresh, locally-grown produce year-round drives the expansion of greenhouse operations dedicated to cultivating a diverse range of vegetables such as tomatoes, lettuce, bell peppers, cucumbers, and leafy greens, along with various culinary herbs. Further, the controlled environment provided by greenhouses offers growers the flexibility to optimize growing conditions, thereby enhancing crop quality, yield, and consistency. Additionally, the rise of urban agriculture and vertical farming initiatives further propels the growth of greenhouse vegetable and herb production, as these systems enable efficient land use and minimize environmental impact. Furthermore, advancements in greenhouse technology, including hydroponic and aquaponic systems, contribute to the sustainability and productivity of vegetable and herb cultivation within greenhouse settings. Thus, the Vegetables & Herbs segment not only dominates the greenhouse market but also reflects the evolving preferences of consumers towards fresh, sustainably-produced food options.
Greenhouse Market Segmentation
By Type
Glass Greenhouse
-Horticulture Glass
-Others
Plastic Greenhouse
-Polyethylene
-Polycarbonate
-Polymethyl-methacrylate
By Offering
Hardware
-Climate control systems
-Lighting Systems
-Irrigation Systems
-Sensors
-Others
Software
-Cloud-based
-Web-based
Services
-System Integration & Consulting
-Managed Services
-Assisted Professional Services
By Crop
Fruits
Vegetables & Herbs
-Tomato
-Lettuce
-Bell and Chili Pepper
-Strawberry
-Cucumber
-Leafy Greens
-Herbs
-Others
Flowers & Ornamentals
-Perennials
-Annuals
-Ornamentals
Others
By End-User
Commercial Growers
Research and Educational Institutes
Retail Gardens
Others
Countries Analyzed
North America (US, Canada, Mexico)
Europe (Germany, UK, France, Spain, Italy, Russia, Rest of Europe)
Asia Pacific (China, India, Japan, South Korea, Australia, South East Asia, Rest of Asia)
South America (Brazil, Argentina, Rest of South America)
Middle East and Africa (Saudi Arabia, UAE, Rest of Middle East, South Africa, Egypt, Rest of Africa)
Greenhouse Companies Profiled in the Study
Agra Tech Inc
Argus Control Systems Ltd
Berry Global
Certhon
Logiqs B.V.
Luiten Greenhouses BV
NETAFIM
Poly-Tex Inc
Richel Group SA
Sotrafa
Stuppy Greenhouse
The Glasshouse Company
*- List Not Exhaustive
Chapter 1. TABLE OF CONTENTS
Chapter 2. Introduction to Greenhouse Market
2.1. Market Overview
2.2. Key Statistics and Report Highlights
2.3. Scope of the Comprehensive Study
2.3.1. Market Definition
2.3.2 Countries and Regions Covered
2.3.3 Research Objective
2.3.4 Units, Currency, and Conversions
2.3.5 Industry Value Chain
2.4. Key Market Segments
2.5. Key Companies
2.6. Study Period
Chapter 3. Strategic Analysis Review
3.1. Greenhouse Pricing Analysis and Forecast
3.2. Porter’s Five Forces
3.3. Market Ecosystem
3.4. SWOT Analysis
3.5. Regulatory Scenario
3.3. Effects of Inflation, Russia-Ukraine War, moderating economic growth, and other macroeconomic factors
Chapter 4. Competitive Landscape
4.1. Market Share Analysis
4.1.1. Global Greenhouse Market Share by Company, 2023
4.1.2. Product Offerings of Leading Greenhouse Companies
4.2. Market Entropy
4.2.1. New Product Launches in the Industry
4.2.2. Mergers, Acquisitions, Joint ventures, and Partnerships
4.3. Key Strategies and Best Practices
Chapter 5. Global Market Projections: Best, Reference, and Low Case Scenarios
5.1. Growth Analysis- Case Scenario Definitions
5.2. Low Growth Case Scenario Forecasts
5.3. Reference Growth Case Scenario Forecasts
5.4. High Growth Case Scenario Forecasts
Chapter 6. Market Dynamics
6.1. Greenhouse Market Drivers
6.2. Greenhouse Market Challenges
6.6. Greenhouse Market Opportunities
6.4. Greenhouse Market Trends
Chapter 7. Global Greenhouse Market Outlook Trends
7.1. Global Greenhouse Revenue (USD Million) and CAGR (%) by Type (2021-2032)
7.2. Global Greenhouse Revenue (USD Million) and CAGR (%) by Application (2021-2032)
7.3. Global Greenhouse Revenue (USD Million) and CAGR (%) by Product (2021-2032)
By Type
Glass Greenhouse
-Horticulture Glass
-Others
Plastic Greenhouse
-Polyethylene
-Polycarbonate
-Polymethyl-methacrylate
By Offering
Hardware
-Climate control systems
-Lighting Systems
-Irrigation Systems
-Sensors
-Others
Software
-Cloud-based
-Web-based
Services
-System Integration & Consulting
-Managed Services
-Assisted Professional Services
By Crop
Fruits
Vegetables & Herbs
-Tomato
-Lettuce
-Bell and Chili Pepper
-Strawberry
-Cucumber
-Leafy Greens
-Herbs
-Others
Flowers & Ornamentals
-Perennials
-Annuals
-Ornamentals
Others
By End-User
Commercial Growers
Research and Educational Institutes
Retail Gardens
Others
Chapter 8. Global Greenhouse Regional Analysis and Outlook
8.1. Global Greenhouse Revenue (USD Million) By Regions (2021- 2032)
8.2. North America Greenhouse Revenue (USD Million) by Country (2021-2032)
8.2.1. United States Greenhouse Regional Analysis and Outlook
8.2.2. Canada Greenhouse Regional Analysis and Outlook
8.2.3. Mexico Greenhouse Regional Analysis and Outlook
8.3. Europe Greenhouse Revenue (USD Million), by Country (2021-2032)
8.3.1. Germany Greenhouse Regional Analysis and Outlook
8.3.2. France Greenhouse Regional Analysis and Outlook
8.3.3. United Kingdom Greenhouse Regional Analysis and Outlook
8.3.4. Spain Greenhouse Regional Analysis and Outlook
8.3.5. Italy Greenhouse Regional Analysis and Outlook
8.3.6. Russia Greenhouse Regional Analysis and Outlook
8.3.7. Rest of Europe Greenhouse Regional Analysis and Outlook
8.4. Asia Pacific Greenhouse Revenue (USD Million) by Country (2021-2032)
8.4.1. China Greenhouse Regional Analysis and Outlook
8.4.2. Japan Greenhouse Regional Analysis and Outlook
8.4.3. India Greenhouse Regional Analysis and Outlook
8.4.4. South Korea Greenhouse Regional Analysis and Outlook
8.4.5. Australia Greenhouse Regional Analysis and Outlook
8.4.6. South East Asia Greenhouse Regional Analysis and Outlook
8.4.7. Rest of Asia Pacific Greenhouse Regional Analysis and Outlook
8.5. South America Greenhouse Revenue (USD Million), by Country (2021-2032)
8.5.1. Brazil Greenhouse Regional Analysis and Outlook
8.5.2. Argentina Greenhouse Regional Analysis and Outlook
8.5.3. Rest of South America Greenhouse Regional Analysis and Outlook
8.6. Middle East and Africa Greenhouse Revenue (USD Million) by Country (2021-2032)
8.6.1. Middle East Greenhouse Regional Analysis and Outlook
8.6.2. Africa Greenhouse Regional Analysis and Outlook
Chapter 9. North America Greenhouse Analysis and Outlook
9.1. North America Greenhouse Revenue (USD Million) by Segments (2021-2032)
9.1.1. North America Greenhouse Revenue (USD Million) by Type (2021-2032)
9.1.2. North America Greenhouse Revenue (USD Million) by Application (2021-2032)
9.1.3. North America Greenhouse Revenue (USD Million) by Product (2021-2032)
By Type
Glass Greenhouse
-Horticulture Glass
-Others
Plastic Greenhouse
-Polyethylene
-Polycarbonate
-Polymethyl-methacrylate
By Offering
Hardware
-Climate control systems
-Lighting Systems
-Irrigation Systems
-Sensors
-Others
Software
-Cloud-based
-Web-based
Services
-System Integration & Consulting
-Managed Services
-Assisted Professional Services
By Crop
Fruits
Vegetables & Herbs
-Tomato
-Lettuce
-Bell and Chili Pepper
-Strawberry
-Cucumber
-Leafy Greens
-Herbs
-Others
Flowers & Ornamentals
-Perennials
-Annuals
-Ornamentals
Others
By End-User
Commercial Growers
Research and Educational Institutes
Retail Gardens
Others
Chapter 10. Europe Greenhouse Analysis and Outlook
10.1. Europe Greenhouse Revenue (USD Million), by Segments (USD Million) (2021-2032)
10.1.1. Europe Greenhouse Revenue (USD Million) by Type (2021-2032)
10.1.2. Europe Greenhouse Revenue (USD Million) by Application (2021-2032)
10.1.3. Europe Greenhouse Revenue (USD Million) by Product (2021-2032)
By Type
Glass Greenhouse
-Horticulture Glass
-Others
Plastic Greenhouse
-Polyethylene
-Polycarbonate
-Polymethyl-methacrylate
By Offering
Hardware
-Climate control systems
-Lighting Systems
-Irrigation Systems
-Sensors
-Others
Software
-Cloud-based
-Web-based
Services
-System Integration & Consulting
-Managed Services
-Assisted Professional Services
By Crop
Fruits
Vegetables & Herbs
-Tomato
-Lettuce
-Bell and Chili Pepper
-Strawberry
-Cucumber
-Leafy Greens
-Herbs
-Others
Flowers & Ornamentals
-Perennials
-Annuals
-Ornamentals
Others
By End-User
Commercial Growers
Research and Educational Institutes
Retail Gardens
Others
Chapter 11. Asia Pacific Greenhouse Analysis and Outlook
11.1. Asia Pacific Greenhouse Revenue (USD Million), and Revenue (USD Million) by Segments (2021-2032)
11.1.1. Asia Pacific Greenhouse Revenue (USD Million) by Type (2021-2032)
11.1.2. Asia Pacific Greenhouse Revenue (USD Million) by Application (2021-2032)
11.1.3. Asia Pacific Greenhouse Revenue (USD Million) by Product (2021-2032)
By Type
Glass Greenhouse
-Horticulture Glass
-Others
Plastic Greenhouse
-Polyethylene
-Polycarbonate
-Polymethyl-methacrylate
By Offering
Hardware
-Climate control systems
-Lighting Systems
-Irrigation Systems
-Sensors
-Others
Software
-Cloud-based
-Web-based
Services
-System Integration & Consulting
-Managed Services
-Assisted Professional Services
By Crop
Fruits
Vegetables & Herbs
-Tomato
-Lettuce
-Bell and Chili Pepper
-Strawberry
-Cucumber
-Leafy Greens
-Herbs
-Others
Flowers & Ornamentals
-Perennials
-Annuals
-Ornamentals
Others
By End-User
Commercial Growers
Research and Educational Institutes
Retail Gardens
Others
Chapter 12. South America Greenhouse Analysis and Outlook
12.1. South America Greenhouse Revenue (USD Million), by Segments (2021-2032)
12.1.1. South America Greenhouse Revenue (USD Million) by Type (2021-2032)
12.1.2. South America Greenhouse Revenue (USD Million) by Application (2021-2032)
12.1.3. South America Greenhouse Revenue (USD Million) by Product (2021-2032)
By Type
Glass Greenhouse
-Horticulture Glass
-Others
Plastic Greenhouse
-Polyethylene
-Polycarbonate
-Polymethyl-methacrylate
By Offering
Hardware
-Climate control systems
-Lighting Systems
-Irrigation Systems
-Sensors
-Others
Software
-Cloud-based
-Web-based
Services
-System Integration & Consulting
-Managed Services
-Assisted Professional Services
By Crop
Fruits
Vegetables & Herbs
-Tomato
-Lettuce
-Bell and Chili Pepper
-Strawberry
-Cucumber
-Leafy Greens
-Herbs
-Others
Flowers & Ornamentals
-Perennials
-Annuals
-Ornamentals
Others
By End-User
Commercial Growers
Research and Educational Institutes
Retail Gardens
Others
Chapter 13. Middle East and Africa Greenhouse Analysis and Outlook
13.1. Middle East and Africa Greenhouse Revenue (USD Million), by Segments (2021-2032)
13.1.1. Middle East and Africa Greenhouse Revenue (USD Million) by Type (2021-2032)
13.1.2. Middle East and Africa Greenhouse Revenue (USD Million) by Application (2021-2032)
13.1.3. Middle East and Africa Greenhouse Revenue (USD Million) by Product (2021-2032)
By Type
Glass Greenhouse
-Horticulture Glass
-Others
Plastic Greenhouse
-Polyethylene
-Polycarbonate
-Polymethyl-methacrylate
By Offering
Hardware
-Climate control systems
-Lighting Systems
-Irrigation Systems
-Sensors
-Others
Software
-Cloud-based
-Web-based
Services
-System Integration & Consulting
-Managed Services
-Assisted Professional Services
By Crop
Fruits
Vegetables & Herbs
-Tomato
-Lettuce
-Bell and Chili Pepper
-Strawberry
-Cucumber
-Leafy Greens
-Herbs
-Others
Flowers & Ornamentals
-Perennials
-Annuals
-Ornamentals
Others
By End-User
Commercial Growers
Research and Educational Institutes
Retail Gardens
Others
Chapter 14. Greenhouse Company Profiles
14.1 Business Overview
14.2 Product Profiles
14.3 SWOT Profiles
14.5 Recent Developments
14.6 Financial Profile
List of Companies
Agra Tech Inc
Argus Control Systems Ltd
Berry Global
Certhon
Logiqs B.V.
Luiten Greenhouses BV
NETAFIM
Poly-Tex Inc
Richel Group SA
Sotrafa
Stuppy Greenhouse
The Glasshouse Company
15. Methodology and Data Sources
15.1 Customization Offerings
15.2 Subscription Services
15.3 Related Reports
15.4 Publisher Expertise
LIST OF TABLES
Table 1 Market Segmentation Analysis
Table 2 Global Greenhouse Market Share of Leading Companies, 2023
Table 3 Product Offerings of Leading Companies
Table 4 Low Growth Scenario Forecasts
Table 5 Reference Case Growth Scenario
Table 6 High Growth Case Scenario
Table 7 Global Greenhouse Revenue (USD Million) And CAGR (%) By Type (2021-2032)
Table 8 Global Greenhouse Revenue (USD Million) And CAGR (%) By Application (2021-2032)
Table 9 Global Greenhouse Revenue (USD Million) And CAGR (%) By Product (2021-2032)
Table 10 Global Greenhouse Market Revenue (USD Million) By Regions (2021-2032)
Table 11 Global Greenhouse Market Share (%) By Regions (2021-2032)
Table 12 North America Greenhouse Revenue (USD Million) By Country (2021-2032)
Table 13 Europe Greenhouse Revenue (USD Million) By Country (2021-2032)
Table 14 Asia Pacific Greenhouse Revenue (USD Million) By Country (2021-2032)
Table 15 South America Greenhouse Revenue (USD Million) By Country (2021-2032)
Table 16 Middle East and Africa Greenhouse Revenue (USD Million) By Region (2021-2032)
Table 17 North America Greenhouse Revenue (USD Million) By Type (2021-2032)
Table 18 North America Greenhouse Revenue (USD Million) By Application (2021-2032)
Table 19 North America Greenhouse Revenue (USD Million) By Product (2021-2032)
Table 20 Europe Greenhouse Revenue (USD Million) By Type (2021-2032)
Table 21 Europe Greenhouse Revenue (USD Million) By Application (2021-2032)
Table 22 Europe Greenhouse Revenue (USD Million) By Product (2021-2032)
Table 23 Asia Pacific Greenhouse Revenue (USD Million) By Type (2021-2032)
Table 24 Asia Pacific Greenhouse Revenue (USD Million) By Application (2021-2032)
Table 25 Asia Pacific Greenhouse Revenue (USD Million) By Product (2021-2032)
Table 26 South America Greenhouse Revenue (USD Million) By Type (2021-2032)
Table 27 South America Greenhouse Revenue (USD Million) By Application (2021-2032)
Table 28 South America Greenhouse Revenue (USD Million) By Product (2021-2032)
Table 29 Middle East and Africa Greenhouse Revenue (USD Million) By Type (2021-2032)
Table 30 Middle East and Africa Greenhouse Revenue (USD Million) By Application (2021-2032)
Table 31 Middle East and Africa Greenhouse Revenue (USD Million) By Product (2021-2032)
LIST OF FIGURES
Figure 1. Market Scope
Figure 2. Pricing Forecasts Per Unit, 2023- 2032
Figure 3. Porter’s Five Forces
Figure 4. Global Greenhouse Market Revenue (USD Million) By Regions (2021-2032)
Figure 5. Global Greenhouse Market Share (%) By Regions (2023)
Figure 6. North America Greenhouse Revenue (USD Million) By Country (2021-2032)
Figure 7. United States Greenhouse Revenue (USD Million) By Country (2021-2032)
Figure 8. Canada Greenhouse Revenue (USD Million) By Country (2021-2032)
Figure 9. Mexico Greenhouse Revenue (USD Million) By Country (2021-2032)
Figure 10. Europe Greenhouse Revenue (USD Million) By Country (2021-2032)
Figure 11. Germany Greenhouse Revenue (USD Million) By Country (2021-2032)
Figure 12. France Greenhouse Revenue (USD Million) By Country (2021-2032)
Figure 13. United Kingdom Greenhouse Revenue (USD Million) By Country (2021-2032)
Figure 14. Spain Greenhouse Revenue (USD Million) By Country (2021-2032)
Figure 15. Italy Greenhouse Revenue (USD Million) By Country (2021-2032)
Figure 16. Russia Greenhouse Revenue (USD Million) By Country (2021-2032)
Figure 17. Rest of Europe Greenhouse Revenue (USD Million) By Country (2021-2032)
Figure 11. Asia Pacific Greenhouse Revenue (USD Million) By Country (2021-2032)
Figure 12. China Greenhouse Revenue (USD Million) By Country (2021-2032)
Figure 13. Japan Greenhouse Revenue (USD Million) By Country (2021-2032)
Figure 14. India Greenhouse Revenue (USD Million) By Country (2021-2032)
Figure 15. South Korea Greenhouse Revenue (USD Million) By Country (2021-2032)
Figure 16. Australia Greenhouse Revenue (USD Million) By Country (2021-2032)
Figure 17. South East Asia Greenhouse Revenue (USD Million) By Country (2021-2032)
Figure 18. South America Greenhouse Revenue (USD Million) By Country (2021-2032)
Figure 19. Brazil Greenhouse Revenue (USD Million) By Country (2021-2032)
Figure 20. Argentina Greenhouse Revenue (USD Million) By Country (2021-2032)
Figure 21. Rest of Asia Pacific Greenhouse Revenue (USD Million) By Country (2021-2032)
Figure 22. Middle East and Africa Greenhouse Revenue (USD Million) By Region (2021-2032)
Figure 23. Saudi Arabia Greenhouse Revenue (USD Million) By Region (2021-2032)
Figure 24. The UAE Greenhouse Revenue (USD Million) By Region (2021-2032)
Figure 25. Rest of Middle East Greenhouse Revenue (USD Million) By Region (2021-2032)
Figure 26. South Africa Greenhouse Revenue (USD Million) By Region (2021-2032)
Figure 27. Africa Greenhouse Revenue (USD Million) By Region (2021-2032)
Figure 28. North America Greenhouse Revenue (USD Million) By Type (2021-2032)
Figure 29. North America Greenhouse Revenue (USD Million) By Application (2021-2032)
Figure 30. North America Greenhouse Revenue (USD Million) By Product (2021-2032)
Figure 31. Europe Greenhouse Revenue (USD Million) By Type (2021-2032)
Figure 32. Europe Greenhouse Revenue (USD Million) By Application (2021-2032)
Figure 33. Europe Greenhouse Revenue (USD Million) By Product (2021-2032)
Figure 34. Asia Pacific Greenhouse Revenue (USD Million) By Type (2021-2032)
Figure 35. Asia Pacific Greenhouse Revenue (USD Million) By Application (2021-2032)
Figure 36. Asia Pacific Greenhouse Revenue (USD Million) By Product (2021-2032)
Figure 37. South America Greenhouse Revenue (USD Million) By Type (2021-2032)
Figure 38. South America Greenhouse Revenue (USD Million) By Application (2021-2032)
Figure 39. South America Greenhouse Revenue (USD Million) By Product (2021-2032)
Figure 40. Middle East and Africa Greenhouse Revenue (USD Million) By Type (2021-2032)
Figure 41. Middle East and Africa Greenhouse Revenue (USD Million) By Application (2021-2032)
Figure 42. Middle East and Africa Greenhouse Revenue (USD Million) By Product (2021-2032)
By Type
Glass Greenhouse
-Horticulture Glass
-Others
Plastic Greenhouse
-Polyethylene
-Polycarbonate
-Polymethyl-methacrylate
By Offering
Hardware
-Climate control systems
-Lighting Systems
-Irrigation Systems
-Sensors
-Others
Software
-Cloud-based
-Web-based
Services
-System Integration & Consulting
-Managed Services
-Assisted Professional Services
By Crop
Fruits
Vegetables & Herbs
-Tomato
-Lettuce
-Bell and Chili Pepper
-Strawberry
-Cucumber
-Leafy Greens
-Herbs
-Others
Flowers & Ornamentals
-Perennials
-Annuals
-Ornamentals
Others
By End-User
Commercial Growers
Research and Educational Institutes
Retail Gardens
Others
Countries Analyzed
North America (US, Canada, Mexico)
Europe (Germany, UK, France, Spain, Italy, Russia, Rest of Europe)
Asia Pacific (China, India, Japan, South Korea, Australia, South East Asia, Rest of Asia)
South America (Brazil, Argentina, Rest of South America)
Middle East and Africa (Saudi Arabia, UAE, Rest of Middle East, South Africa, Egypt, Rest of Africa)
