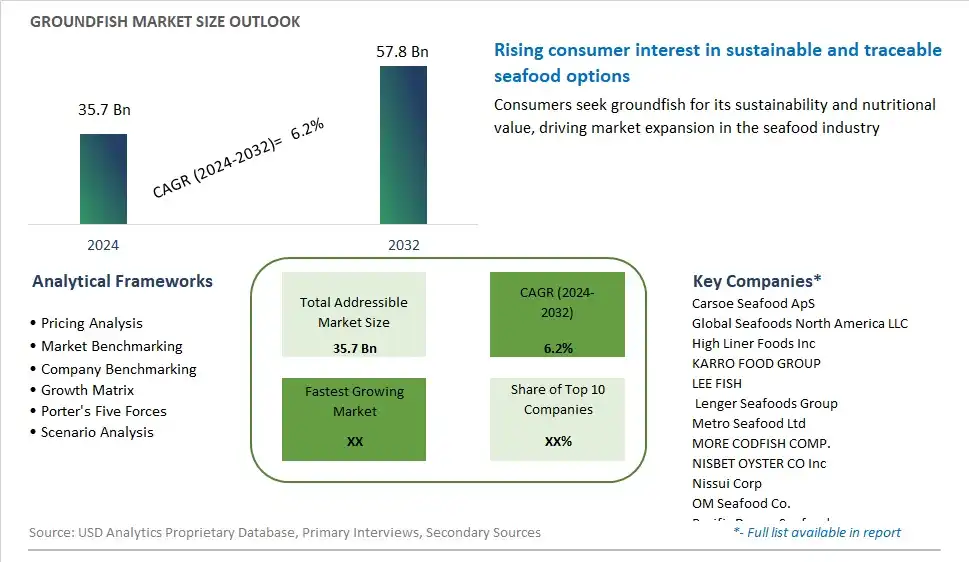
Global Groundfish Market Size is valued at $35.7 Billion in 2024 and is forecast to register a growth rate (CAGR) of 6.2% to reach $57.8 Billion by 2032.
The global Groundfish Market Comprehensive Study analyzes and forecasts the market size across 6 regions and 24 countries for diverse segments -By Type (Alaska pollock, Blue whiting, Atlantic cod, Hake, Others), By Application (Direct retail, Food processing)
An Introduction to Groundfish Market
In 2024, the groundfish market encompasses a diverse range of fish species that are harvested from the ocean floor or near-bottom waters, representing a vital component of global seafood supply chains. Groundfish, including species such as cod, haddock, and flounder, are prized for their mild flavor, versatility in culinary applications, and nutritional benefits. As consumer preferences shift towards sustainable and responsibly sourced seafood, the groundfish industry is undergoing significant transformation to address environmental concerns and promote responsible fishing practices. Stakeholders across the seafood value chain, including fishermen, processors, and retailers, are collaborating to implement sustainable fisheries management practices, reduce bycatch, and minimize the ecological impact of fishing operations. Moreover, technological advancements in fishing gear, processing techniques, and transportation logistics are enhancing efficiency and traceability within the groundfish supply chain, ensuring product quality and safety from sea to table. With increasing consumer demand for traceable, sustainable seafood options, the groundfish market is poised for continued growth, driven by innovation, transparency, and commitment to environmental stewardship.
Groundfish Competitive Landscape
The market report analyses the leading companies in the industry including Carsoe Seafood ApS, Global Seafoods North America LLC, High Liner Foods Inc, KARRO FOOD GROUP, LEE FISH, Lenger Seafoods Group, Metro Seafood Ltd, MORE CODFISH COMP., NISBET OYSTER CO Inc, Nissui Corp, OM Seafood Co., Pacific Dream Seafood, and Others.
Groundfish Market Dynamics
Groundfish Market Trend: Sustainable Fishing Practices and Traceability
One of the most prominent trends in the groundfish market is the increasing emphasis on sustainable fishing practices and traceability. With growing concerns about overfishing and environmental degradation, consumers, retailers, and regulatory bodies are placing greater importance on ensuring that seafood products, including groundfish, are sourced using sustainable methods that minimize negative impacts on marine ecosystems. As a result, there is a rising demand for groundfish products that are certified as sustainably harvested, as well as for transparent supply chains that allow consumers to trace the origin of their seafood purchases back to the fishing vessel or location.
Market Driver: Health Benefits and Nutritional Value of Groundfish
A key driver of the groundfish market is the recognition of the health benefits and nutritional value associated with consuming groundfish species. Groundfish, such as cod, haddock, and pollock, are rich sources of lean protein, omega-3 fatty acids, vitamins, and minerals. These nutrients contribute to various health benefits, including supporting heart health, brain function, and overall well-being. As consumers increasingly prioritize health-conscious food choices and seek out protein-rich, nutrient-dense foods, groundfish products appeal to those looking for a healthy and sustainable protein source.
Market Opportunity: Product Innovation and Market Diversification
An opportunity for the groundfish market lies in product innovation and market diversification. While groundfish species are commonly used in traditional seafood products such as fish fillets, fish sticks, and fish cakes, there is potential to expand the range of groundfish-based offerings to cater to evolving consumer preferences and culinary trends. This includes developing value-added products such as groundfish-based burgers, sausages, meatballs, and ready-to-cook meal kits. Furthermore, there is an opportunity to target niche markets such as health-conscious consumers, flexitarians, and individuals following specific dietary preferences or restrictions (e.g., gluten-free, paleo) by introducing groundfish products that align with their needs and preferences. By leveraging innovation and diversification, companies can tap into new consumer segments and drive growth in the groundfish market.
Groundfish Market Share Analysis: Alaska Pollock market is poised to register the fastest growth rae over the forecast period to 2032
Alaska Pollock is the largest segment within the Groundfish Market due to its remarkable growth trajectory. This fish species, scientifically known as Theragra chalcogramma, thrives in the cold waters of the North Pacific, primarily the Bering Sea. Its popularity stems from its versatility, making it a staple ingredient in various cuisines worldwide, including surimi, fish sticks, and imitation crab meat. Additionally, Alaska Pollock is recognized for its sustainable fishing practices, with the majority of its catch certified by organizations like the Marine Stewardship Council (MSC). The increasing demand for seafood, coupled with its affordability and nutritional value, has fueled the rapid expansion of the Alaska Pollock market. Furthermore, technological advancements in fishing methods and processing techniques have enhanced the efficiency of harvesting and utilizing this abundant resource, contributing to its continuous growth within the groundfish market segment.
Groundfish Market Share Analysis: Food Processing market is poised to register the fastest growth rae over the forecast period to 2032
Among the segments within the Groundfish Market, Food Processing stands out as the fastest-growing category. This growth is propelled by several factors, primarily driven by the rising demand for processed seafood products globally. Food processing offers numerous advantages, such as extended shelf life, convenience, and diverse product offerings, which appeal to both consumers and businesses in the food industry. Additionally, advancements in food processing technologies and techniques have enabled manufacturers to innovate and introduce new products, catering to evolving consumer preferences and dietary trends. Furthermore, the growing awareness of the health benefits associated with seafood consumption has contributed to the increased demand for processed groundfish products. With the expansion of the food processing sector and the continuous development of value-added seafood products, the Food Processing segment is positioned for sustained growth within the groundfish market.
Groundfish Market Segmentation
By Type
Alaska pollock
Blue whiting
Atlantic cod
Hake
Others
By Application
Direct retail
Food processing
Countries Analyzed
North America (US, Canada, Mexico)
Europe (Germany, UK, France, Spain, Italy, Russia, Rest of Europe)
Asia Pacific (China, India, Japan, South Korea, Australia, South East Asia, Rest of Asia)
South America (Brazil, Argentina, Rest of South America)
Middle East and Africa (Saudi Arabia, UAE, Rest of Middle East, South Africa, Egypt, Rest of Africa)
Groundfish Companies Profiled in the Study
Carsoe Seafood ApS
Global Seafoods North America LLC
High Liner Foods Inc
KARRO FOOD GROUP
LEE FISH
Lenger Seafoods Group
Metro Seafood Ltd
MORE CODFISH COMP.
NISBET OYSTER CO Inc
Nissui Corp
OM Seafood Co.
Pacific Dream Seafood
*- List Not Exhaustive
Chapter 1. TABLE OF CONTENTS
Chapter 2. Introduction to Groundfish Market
2.1. Market Overview
2.2. Key Statistics and Report Highlights
2.3. Scope of the Comprehensive Study
2.3.1. Market Definition
2.3.2 Countries and Regions Covered
2.3.3 Research Objective
2.3.4 Units, Currency, and Conversions
2.3.5 Industry Value Chain
2.4. Key Market Segments
2.5. Key Companies
2.6. Study Period
Chapter 3. Strategic Analysis Review
3.1. Groundfish Pricing Analysis and Forecast
3.2. Porter’s Five Forces
3.3. Market Ecosystem
3.4. SWOT Analysis
3.5. Regulatory Scenario
3.3. Effects of Inflation, Russia-Ukraine War, moderating economic growth, and other macroeconomic factors
Chapter 4. Competitive Landscape
4.1. Market Share Analysis
4.1.1. Global Groundfish Market Share by Company, 2023
4.1.2. Product Offerings of Leading Groundfish Companies
4.2. Market Entropy
4.2.1. New Product Launches in the Industry
4.2.2. Mergers, Acquisitions, Joint ventures, and Partnerships
4.3. Key Strategies and Best Practices
Chapter 5. Global Market Projections: Best, Reference, and Low Case Scenarios
5.1. Growth Analysis- Case Scenario Definitions
5.2. Low Growth Case Scenario Forecasts
5.3. Reference Growth Case Scenario Forecasts
5.4. High Growth Case Scenario Forecasts
Chapter 6. Market Dynamics
6.1. Groundfish Market Drivers
6.2. Groundfish Market Challenges
6.6. Groundfish Market Opportunities
6.4. Groundfish Market Trends
Chapter 7. Global Groundfish Market Outlook Trends
7.1. Global Groundfish Revenue (USD Million) and CAGR (%) by Type (2021-2032)
7.2. Global Groundfish Revenue (USD Million) and CAGR (%) by Application (2021-2032)
7.3. Global Groundfish Revenue (USD Million) and CAGR (%) by Product (2021-2032)
By Type
Alaska pollock
Blue whiting
Atlantic cod
Hake
Others
By Application
Direct retail
Food processing
Chapter 8. Global Groundfish Regional Analysis and Outlook
8.1. Global Groundfish Revenue (USD Million) By Regions (2021- 2032)
8.2. North America Groundfish Revenue (USD Million) by Country (2021-2032)
8.2.1. United States Groundfish Regional Analysis and Outlook
8.2.2. Canada Groundfish Regional Analysis and Outlook
8.2.3. Mexico Groundfish Regional Analysis and Outlook
8.3. Europe Groundfish Revenue (USD Million), by Country (2021-2032)
8.3.1. Germany Groundfish Regional Analysis and Outlook
8.3.2. France Groundfish Regional Analysis and Outlook
8.3.3. United Kingdom Groundfish Regional Analysis and Outlook
8.3.4. Spain Groundfish Regional Analysis and Outlook
8.3.5. Italy Groundfish Regional Analysis and Outlook
8.3.6. Russia Groundfish Regional Analysis and Outlook
8.3.7. Rest of Europe Groundfish Regional Analysis and Outlook
8.4. Asia Pacific Groundfish Revenue (USD Million) by Country (2021-2032)
8.4.1. China Groundfish Regional Analysis and Outlook
8.4.2. Japan Groundfish Regional Analysis and Outlook
8.4.3. India Groundfish Regional Analysis and Outlook
8.4.4. South Korea Groundfish Regional Analysis and Outlook
8.4.5. Australia Groundfish Regional Analysis and Outlook
8.4.6. South East Asia Groundfish Regional Analysis and Outlook
8.4.7. Rest of Asia Pacific Groundfish Regional Analysis and Outlook
8.5. South America Groundfish Revenue (USD Million), by Country (2021-2032)
8.5.1. Brazil Groundfish Regional Analysis and Outlook
8.5.2. Argentina Groundfish Regional Analysis and Outlook
8.5.3. Rest of South America Groundfish Regional Analysis and Outlook
8.6. Middle East and Africa Groundfish Revenue (USD Million) by Country (2021-2032)
8.6.1. Middle East Groundfish Regional Analysis and Outlook
8.6.2. Africa Groundfish Regional Analysis and Outlook
Chapter 9. North America Groundfish Analysis and Outlook
9.1. North America Groundfish Revenue (USD Million) by Segments (2021-2032)
9.1.1. North America Groundfish Revenue (USD Million) by Type (2021-2032)
9.1.2. North America Groundfish Revenue (USD Million) by Application (2021-2032)
9.1.3. North America Groundfish Revenue (USD Million) by Product (2021-2032)
By Type
Alaska pollock
Blue whiting
Atlantic cod
Hake
Others
By Application
Direct retail
Food processing
Chapter 10. Europe Groundfish Analysis and Outlook
10.1. Europe Groundfish Revenue (USD Million), by Segments (USD Million) (2021-2032)
10.1.1. Europe Groundfish Revenue (USD Million) by Type (2021-2032)
10.1.2. Europe Groundfish Revenue (USD Million) by Application (2021-2032)
10.1.3. Europe Groundfish Revenue (USD Million) by Product (2021-2032)
By Type
Alaska pollock
Blue whiting
Atlantic cod
Hake
Others
By Application
Direct retail
Food processing
Chapter 11. Asia Pacific Groundfish Analysis and Outlook
11.1. Asia Pacific Groundfish Revenue (USD Million), and Revenue (USD Million) by Segments (2021-2032)
11.1.1. Asia Pacific Groundfish Revenue (USD Million) by Type (2021-2032)
11.1.2. Asia Pacific Groundfish Revenue (USD Million) by Application (2021-2032)
11.1.3. Asia Pacific Groundfish Revenue (USD Million) by Product (2021-2032)
By Type
Alaska pollock
Blue whiting
Atlantic cod
Hake
Others
By Application
Direct retail
Food processing
Chapter 12. South America Groundfish Analysis and Outlook
12.1. South America Groundfish Revenue (USD Million), by Segments (2021-2032)
12.1.1. South America Groundfish Revenue (USD Million) by Type (2021-2032)
12.1.2. South America Groundfish Revenue (USD Million) by Application (2021-2032)
12.1.3. South America Groundfish Revenue (USD Million) by Product (2021-2032)
By Type
Alaska pollock
Blue whiting
Atlantic cod
Hake
Others
By Application
Direct retail
Food processing
Chapter 13. Middle East and Africa Groundfish Analysis and Outlook
13.1. Middle East and Africa Groundfish Revenue (USD Million), by Segments (2021-2032)
13.1.1. Middle East and Africa Groundfish Revenue (USD Million) by Type (2021-2032)
13.1.2. Middle East and Africa Groundfish Revenue (USD Million) by Application (2021-2032)
13.1.3. Middle East and Africa Groundfish Revenue (USD Million) by Product (2021-2032)
By Type
Alaska pollock
Blue whiting
Atlantic cod
Hake
Others
By Application
Direct retail
Food processing
Chapter 14. Groundfish Company Profiles
14.1 Business Overview
14.2 Product Profiles
14.3 SWOT Profiles
14.5 Recent Developments
14.6 Financial Profile
List of Companies
Carsoe Seafood ApS
Global Seafoods North America LLC
High Liner Foods Inc
KARRO FOOD GROUP
LEE FISH
Lenger Seafoods Group
Metro Seafood Ltd
MORE CODFISH COMP.
NISBET OYSTER CO Inc
Nissui Corp
OM Seafood Co.
Pacific Dream Seafood
15. Methodology and Data Sources
15.1 Customization Offerings
15.2 Subscription Services
15.3 Related Reports
15.4 Publisher Expertise
LIST OF TABLES
Table 1 Market Segmentation Analysis
Table 2 Global Groundfish Market Share of Leading Companies, 2023
Table 3 Product Offerings of Leading Companies
Table 4 Low Growth Scenario Forecasts
Table 5 Reference Case Growth Scenario
Table 6 High Growth Case Scenario
Table 7 Global Groundfish Revenue (USD Million) And CAGR (%) By Type (2021-2032)
Table 8 Global Groundfish Revenue (USD Million) And CAGR (%) By Application (2021-2032)
Table 9 Global Groundfish Revenue (USD Million) And CAGR (%) By Product (2021-2032)
Table 10 Global Groundfish Market Revenue (USD Million) By Regions (2021-2032)
Table 11 Global Groundfish Market Share (%) By Regions (2021-2032)
Table 12 North America Groundfish Revenue (USD Million) By Country (2021-2032)
Table 13 Europe Groundfish Revenue (USD Million) By Country (2021-2032)
Table 14 Asia Pacific Groundfish Revenue (USD Million) By Country (2021-2032)
Table 15 South America Groundfish Revenue (USD Million) By Country (2021-2032)
Table 16 Middle East and Africa Groundfish Revenue (USD Million) By Region (2021-2032)
Table 17 North America Groundfish Revenue (USD Million) By Type (2021-2032)
Table 18 North America Groundfish Revenue (USD Million) By Application (2021-2032)
Table 19 North America Groundfish Revenue (USD Million) By Product (2021-2032)
Table 20 Europe Groundfish Revenue (USD Million) By Type (2021-2032)
Table 21 Europe Groundfish Revenue (USD Million) By Application (2021-2032)
Table 22 Europe Groundfish Revenue (USD Million) By Product (2021-2032)
Table 23 Asia Pacific Groundfish Revenue (USD Million) By Type (2021-2032)
Table 24 Asia Pacific Groundfish Revenue (USD Million) By Application (2021-2032)
Table 25 Asia Pacific Groundfish Revenue (USD Million) By Product (2021-2032)
Table 26 South America Groundfish Revenue (USD Million) By Type (2021-2032)
Table 27 South America Groundfish Revenue (USD Million) By Application (2021-2032)
Table 28 South America Groundfish Revenue (USD Million) By Product (2021-2032)
Table 29 Middle East and Africa Groundfish Revenue (USD Million) By Type (2021-2032)
Table 30 Middle East and Africa Groundfish Revenue (USD Million) By Application (2021-2032)
Table 31 Middle East and Africa Groundfish Revenue (USD Million) By Product (2021-2032)
LIST OF FIGURES
Figure 1. Market Scope
Figure 2. Pricing Forecasts Per Unit, 2023- 2032
Figure 3. Porter’s Five Forces
Figure 4. Global Groundfish Market Revenue (USD Million) By Regions (2021-2032)
Figure 5. Global Groundfish Market Share (%) By Regions (2023)
Figure 6. North America Groundfish Revenue (USD Million) By Country (2021-2032)
Figure 7. United States Groundfish Revenue (USD Million) By Country (2021-2032)
Figure 8. Canada Groundfish Revenue (USD Million) By Country (2021-2032)
Figure 9. Mexico Groundfish Revenue (USD Million) By Country (2021-2032)
Figure 10. Europe Groundfish Revenue (USD Million) By Country (2021-2032)
Figure 11. Germany Groundfish Revenue (USD Million) By Country (2021-2032)
Figure 12. France Groundfish Revenue (USD Million) By Country (2021-2032)
Figure 13. United Kingdom Groundfish Revenue (USD Million) By Country (2021-2032)
Figure 14. Spain Groundfish Revenue (USD Million) By Country (2021-2032)
Figure 15. Italy Groundfish Revenue (USD Million) By Country (2021-2032)
Figure 16. Russia Groundfish Revenue (USD Million) By Country (2021-2032)
Figure 17. Rest of Europe Groundfish Revenue (USD Million) By Country (2021-2032)
Figure 11. Asia Pacific Groundfish Revenue (USD Million) By Country (2021-2032)
Figure 12. China Groundfish Revenue (USD Million) By Country (2021-2032)
Figure 13. Japan Groundfish Revenue (USD Million) By Country (2021-2032)
Figure 14. India Groundfish Revenue (USD Million) By Country (2021-2032)
Figure 15. South Korea Groundfish Revenue (USD Million) By Country (2021-2032)
Figure 16. Australia Groundfish Revenue (USD Million) By Country (2021-2032)
Figure 17. South East Asia Groundfish Revenue (USD Million) By Country (2021-2032)
Figure 18. South America Groundfish Revenue (USD Million) By Country (2021-2032)
Figure 19. Brazil Groundfish Revenue (USD Million) By Country (2021-2032)
Figure 20. Argentina Groundfish Revenue (USD Million) By Country (2021-2032)
Figure 21. Rest of Asia Pacific Groundfish Revenue (USD Million) By Country (2021-2032)
Figure 22. Middle East and Africa Groundfish Revenue (USD Million) By Region (2021-2032)
Figure 23. Saudi Arabia Groundfish Revenue (USD Million) By Region (2021-2032)
Figure 24. The UAE Groundfish Revenue (USD Million) By Region (2021-2032)
Figure 25. Rest of Middle East Groundfish Revenue (USD Million) By Region (2021-2032)
Figure 26. South Africa Groundfish Revenue (USD Million) By Region (2021-2032)
Figure 27. Africa Groundfish Revenue (USD Million) By Region (2021-2032)
Figure 28. North America Groundfish Revenue (USD Million) By Type (2021-2032)
Figure 29. North America Groundfish Revenue (USD Million) By Application (2021-2032)
Figure 30. North America Groundfish Revenue (USD Million) By Product (2021-2032)
Figure 31. Europe Groundfish Revenue (USD Million) By Type (2021-2032)
Figure 32. Europe Groundfish Revenue (USD Million) By Application (2021-2032)
Figure 33. Europe Groundfish Revenue (USD Million) By Product (2021-2032)
Figure 34. Asia Pacific Groundfish Revenue (USD Million) By Type (2021-2032)
Figure 35. Asia Pacific Groundfish Revenue (USD Million) By Application (2021-2032)
Figure 36. Asia Pacific Groundfish Revenue (USD Million) By Product (2021-2032)
Figure 37. South America Groundfish Revenue (USD Million) By Type (2021-2032)
Figure 38. South America Groundfish Revenue (USD Million) By Application (2021-2032)
Figure 39. South America Groundfish Revenue (USD Million) By Product (2021-2032)
Figure 40. Middle East and Africa Groundfish Revenue (USD Million) By Type (2021-2032)
Figure 41. Middle East and Africa Groundfish Revenue (USD Million) By Application (2021-2032)
Figure 42. Middle East and Africa Groundfish Revenue (USD Million) By Product (2021-2032)
By Type
Alaska pollock
Blue whiting
Atlantic cod
Hake
Others
By Application
Direct retail
Food processing
Countries Analyzed
North America (US, Canada, Mexico)
Europe (Germany, UK, France, Spain, Italy, Russia, Rest of Europe)
Asia Pacific (China, India, Japan, South Korea, Australia, South East Asia, Rest of Asia)
South America (Brazil, Argentina, Rest of South America)
Middle East and Africa (Saudi Arabia, UAE, Rest of Middle East, South Africa, Egypt, Rest of Africa)
