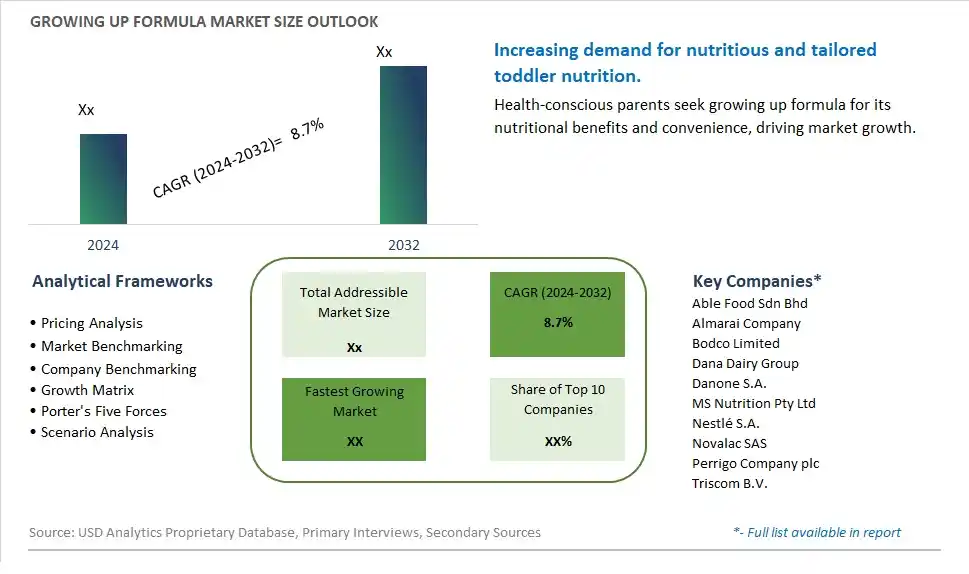
Global Growing Up Formula Market Size is valued at $XX Million in 2024 and is forecast to register a growth rate (CAGR) of 8.7% to reach $XX Million by 2032.
The global Growing Up Formula Market Comprehensive Study analyzes and forecasts the market size across 6 regions and 24 countries for diverse segments -By Type (Organic, Conventional), By Application (Supermarkets/ Hypermarkets, Convenience Stores, Specialty Stores, Online Retail, Others)
An Introduction to Growing Up Formula Market
The Growing Up Formula market in 2024 is experiencing significant growth, driven by the rising demand for nutritionally balanced formulas for toddlers and young children. Growing up formulas, designed to support the nutritional needs of children aged one to three, are popular among parents seeking convenient and complete nutrition solutions. The market benefits from advancements in formula production and nutrient fortification technologies, the growing trend of health-conscious and informed parenting, and the expansion of the global infant nutrition sector. Additionally, the increasing focus on clean label and organic growing up formulas is contributing to market growth.
Growing Up Formula Competitive Landscape
The market report analyses the leading companies in the industry including Able Food Sdn Bhd, Almarai Company, Bodco Limited, Dana Dairy Group, Danone S.A., MS Nutrition Pty Ltd, Nestlé S.A., Novalac SAS, Perrigo Company plc, Triscom B.V., and Others.
Growing Up Formula Market Dynamics
Growing Up Formula Market Trend: Rising Demand for Nutrient-Rich Infant Formulas
The most prominent trend in the Growing Up Formula Market is the rising demand for nutrient-rich infant formulas. As parents seek high-quality and nutritious options for their children's growth and development, growing up formulas are gaining popularity for their enhanced nutritional profiles. This trend is driven by the increasing awareness of the importance of early childhood nutrition.
Growing Up Formula Market Driver: Growth in Health and Wellness Consciousness
The key driver of the Growing Up Formula Market is the growth in health and wellness consciousness. As more parents focus on providing the best nutrition for their children, there is a higher demand for infant formulas that offer essential nutrients and support healthy development. This driver is supported by the trend towards functional foods and the increasing availability of premium infant nutrition products in the market, driving growth for growing up formulas.
Growing Up Formula Market Opportunity: Innovation in Formula Ingredients and Packaging
A significant opportunity in the Growing Up Formula Market lies in innovation in formula ingredients and packaging. By developing new and unique formulas that incorporate advanced nutritional ingredients, such as probiotics, DHA, and organic components, companies can attract health-conscious parents. Offering innovative packaging solutions that enhance convenience and safety can help expand market reach and drive growth in the premium infant nutrition sector.
Growing Up Formula Market Share Analysis: Conventional segment generated the highest revenue share in the industry
Conventional growing up formula is the largest segment in the Growing Up Formula Market by type. This dominance is primarily due to its widespread availability and affordability, making it the go-to choice for a majority of parents globally. Conventional formulas are produced using standard farming practices, which helps in keeping the production costs lower than organic alternatives. Further, established brands have a strong presence in the conventional segment, providing a wide range of product options that cater to various nutritional needs and preferences. The familiarity and trust built over years of consistent quality and regulatory compliance also play a crucial role in maintaining the conventional segment's lead in the market.
Growing Up Formula Market Share Analysis: Online Retail is the fastest growing segment over the forecast period to 2032
Online retail is the fastest-growing segment in the Growing Up Formula Market by application, projected to see significant growth by 2032. This rapid expansion is driven by the increasing penetration of the internet and the convenience of online shopping, which allows parents to easily compare products, read reviews, and have items delivered directly to their homes. The rise of e-commerce platforms, along with dedicated baby product websites, has made it easier for consumers to access a wide variety of growing up formulas from both local and international brands. Additionally, the ability to subscribe for regular deliveries and access exclusive online discounts further fuels the growth of this segment. The Past few yearshas also accelerated the shift towards online shopping, making it a preferred channel for purchasing baby formula. As more consumers adopt digital shopping habits, the online retail segment is expected to continue its robust growth trajectory.
Growing Up Formula Market Segmentation
By Type
Organic
Conventional
By Application
Supermarkets/ Hypermarkets
Convenience Stores
Specialty Stores
Online Retail
Others
Countries Analyzed
North America (US, Canada, Mexico)
Europe (Germany, UK, France, Spain, Italy, Russia, Rest of Europe)
Asia Pacific (China, India, Japan, South Korea, Australia, South East Asia, Rest of Asia)
South America (Brazil, Argentina, Rest of South America)
Middle East and Africa (Saudi Arabia, UAE, Rest of Middle East, South Africa, Egypt, Rest of Africa)
Growing Up Formula Companies Profiled in the Study
Able Food Sdn Bhd
Almarai Company
Bodco Limited
Dana Dairy Group
Danone S.A.
MS Nutrition Pty Ltd
Nestlé S.A.
Novalac SAS
Perrigo Company plc
Triscom B.V.
*- List Not Exhaustive
Chapter 1. TABLE OF CONTENTS
Chapter 2. Introduction to Growing Up Formula Market
2.1. Market Overview
2.2. Key Statistics and Report Highlights
2.3. Scope of the Comprehensive Study
2.3.1. Market Definition
2.3.2 Countries and Regions Covered
2.3.3 Research Objective
2.3.4 Units, Currency, and Conversions
2.3.5 Industry Value Chain
2.4. Key Market Segments
2.5. Key Companies
2.6. Study Period
Chapter 3. Strategic Analysis Review
3.1. Growing Up Formula Pricing Analysis and Forecast
3.2. Porter’s Five Forces
3.3. Market Ecosystem
3.4. SWOT Analysis
3.5. Regulatory Scenario
3.3. Effects of Inflation, Russia-Ukraine War, moderating economic growth, and other macroeconomic factors
Chapter 4. Competitive Landscape
4.1. Market Share Analysis
4.1.1. Global Growing Up Formula Market Share by Company, 2023
4.1.2. Product Offerings of Leading Growing Up Formula Companies
4.2. Market Entropy
4.2.1. New Product Launches in the Industry
4.2.2. Mergers, Acquisitions, Joint ventures, and Partnerships
4.3. Key Strategies and Best Practices
Chapter 5. Global Market Projections: Best, Reference, and Low Case Scenarios
5.1. Growth Analysis- Case Scenario Definitions
5.2. Low Growth Case Scenario Forecasts
5.3. Reference Growth Case Scenario Forecasts
5.4. High Growth Case Scenario Forecasts
Chapter 6. Market Dynamics
6.1. Growing Up Formula Market Drivers
6.2. Growing Up Formula Market Challenges
6.6. Growing Up Formula Market Opportunities
6.4. Growing Up Formula Market Trends
Chapter 7. Global Growing Up Formula Market Outlook Trends
7.1. Global Growing Up Formula Revenue (USD Million) and CAGR (%) by Type (2021-2032)
7.2. Global Growing Up Formula Revenue (USD Million) and CAGR (%) by Application (2021-2032)
7.3. Global Growing Up Formula Revenue (USD Million) and CAGR (%) by Product (2021-2032)
By Type
Organic
Conventional
By Application
Supermarkets/ Hypermarkets
Convenience Stores
Specialty Stores
Online Retail
Others
Chapter 8. Global Growing Up Formula Regional Analysis and Outlook
8.1. Global Growing Up Formula Revenue (USD Million) By Regions (2021- 2032)
8.2. North America Growing Up Formula Revenue (USD Million) by Country (2021-2032)
8.2.1. United States Growing Up Formula Regional Analysis and Outlook
8.2.2. Canada Growing Up Formula Regional Analysis and Outlook
8.2.3. Mexico Growing Up Formula Regional Analysis and Outlook
8.3. Europe Growing Up Formula Revenue (USD Million), by Country (2021-2032)
8.3.1. Germany Growing Up Formula Regional Analysis and Outlook
8.3.2. France Growing Up Formula Regional Analysis and Outlook
8.3.3. United Kingdom Growing Up Formula Regional Analysis and Outlook
8.3.4. Spain Growing Up Formula Regional Analysis and Outlook
8.3.5. Italy Growing Up Formula Regional Analysis and Outlook
8.3.6. Russia Growing Up Formula Regional Analysis and Outlook
8.3.7. Rest of Europe Growing Up Formula Regional Analysis and Outlook
8.4. Asia Pacific Growing Up Formula Revenue (USD Million) by Country (2021-2032)
8.4.1. China Growing Up Formula Regional Analysis and Outlook
8.4.2. Japan Growing Up Formula Regional Analysis and Outlook
8.4.3. India Growing Up Formula Regional Analysis and Outlook
8.4.4. South Korea Growing Up Formula Regional Analysis and Outlook
8.4.5. Australia Growing Up Formula Regional Analysis and Outlook
8.4.6. South East Asia Growing Up Formula Regional Analysis and Outlook
8.4.7. Rest of Asia Pacific Growing Up Formula Regional Analysis and Outlook
8.5. South America Growing Up Formula Revenue (USD Million), by Country (2021-2032)
8.5.1. Brazil Growing Up Formula Regional Analysis and Outlook
8.5.2. Argentina Growing Up Formula Regional Analysis and Outlook
8.5.3. Rest of South America Growing Up Formula Regional Analysis and Outlook
8.6. Middle East and Africa Growing Up Formula Revenue (USD Million) by Country (2021-2032)
8.6.1. Middle East Growing Up Formula Regional Analysis and Outlook
8.6.2. Africa Growing Up Formula Regional Analysis and Outlook
Chapter 9. North America Growing Up Formula Analysis and Outlook
9.1. North America Growing Up Formula Revenue (USD Million) by Segments (2021-2032)
9.1.1. North America Growing Up Formula Revenue (USD Million) by Type (2021-2032)
9.1.2. North America Growing Up Formula Revenue (USD Million) by Application (2021-2032)
9.1.3. North America Growing Up Formula Revenue (USD Million) by Product (2021-2032)
By Type
Organic
Conventional
By Application
Supermarkets/ Hypermarkets
Convenience Stores
Specialty Stores
Online Retail
Others
Chapter 10. Europe Growing Up Formula Analysis and Outlook
10.1. Europe Growing Up Formula Revenue (USD Million), by Segments (USD Million) (2021-2032)
10.1.1. Europe Growing Up Formula Revenue (USD Million) by Type (2021-2032)
10.1.2. Europe Growing Up Formula Revenue (USD Million) by Application (2021-2032)
10.1.3. Europe Growing Up Formula Revenue (USD Million) by Product (2021-2032)
By Type
Organic
Conventional
By Application
Supermarkets/ Hypermarkets
Convenience Stores
Specialty Stores
Online Retail
Others
Chapter 11. Asia Pacific Growing Up Formula Analysis and Outlook
11.1. Asia Pacific Growing Up Formula Revenue (USD Million), and Revenue (USD Million) by Segments (2021-2032)
11.1.1. Asia Pacific Growing Up Formula Revenue (USD Million) by Type (2021-2032)
11.1.2. Asia Pacific Growing Up Formula Revenue (USD Million) by Application (2021-2032)
11.1.3. Asia Pacific Growing Up Formula Revenue (USD Million) by Product (2021-2032)
By Type
Organic
Conventional
By Application
Supermarkets/ Hypermarkets
Convenience Stores
Specialty Stores
Online Retail
Others
Chapter 12. South America Growing Up Formula Analysis and Outlook
12.1. South America Growing Up Formula Revenue (USD Million), by Segments (2021-2032)
12.1.1. South America Growing Up Formula Revenue (USD Million) by Type (2021-2032)
12.1.2. South America Growing Up Formula Revenue (USD Million) by Application (2021-2032)
12.1.3. South America Growing Up Formula Revenue (USD Million) by Product (2021-2032)
By Type
Organic
Conventional
By Application
Supermarkets/ Hypermarkets
Convenience Stores
Specialty Stores
Online Retail
Others
Chapter 13. Middle East and Africa Growing Up Formula Analysis and Outlook
13.1. Middle East and Africa Growing Up Formula Revenue (USD Million), by Segments (2021-2032)
13.1.1. Middle East and Africa Growing Up Formula Revenue (USD Million) by Type (2021-2032)
13.1.2. Middle East and Africa Growing Up Formula Revenue (USD Million) by Application (2021-2032)
13.1.3. Middle East and Africa Growing Up Formula Revenue (USD Million) by Product (2021-2032)
By Type
Organic
Conventional
By Application
Supermarkets/ Hypermarkets
Convenience Stores
Specialty Stores
Online Retail
Others
Chapter 14. Growing Up Formula Company Profiles
14.1 Business Overview
14.2 Product Profiles
14.3 SWOT Profiles
14.5 Recent Developments
14.6 Financial Profile
List of Companies
Able Food Sdn Bhd
Almarai Company
Bodco Limited
Dana Dairy Group
Danone S.A.
MS Nutrition Pty Ltd
Nestlé S.A.
Novalac SAS
Perrigo Company plc
Triscom B.V.
15. Methodology and Data Sources
15.1 Customization Offerings
15.2 Subscription Services
15.3 Related Reports
15.4 Publisher Expertise
LIST OF TABLES
Table 1 Market Segmentation Analysis
Table 2 Global Growing Up Formula Market Share of Leading Companies, 2023
Table 3 Product Offerings of Leading Companies
Table 4 Low Growth Scenario Forecasts
Table 5 Reference Case Growth Scenario
Table 6 High Growth Case Scenario
Table 7 Global Growing Up Formula Revenue (USD Million) And CAGR (%) By Type (2021-2032)
Table 8 Global Growing Up Formula Revenue (USD Million) And CAGR (%) By Application (2021-2032)
Table 9 Global Growing Up Formula Revenue (USD Million) And CAGR (%) By Product (2021-2032)
Table 10 Global Growing Up Formula Market Revenue (USD Million) By Regions (2021-2032)
Table 11 Global Growing Up Formula Market Share (%) By Regions (2021-2032)
Table 12 North America Growing Up Formula Revenue (USD Million) By Country (2021-2032)
Table 13 Europe Growing Up Formula Revenue (USD Million) By Country (2021-2032)
Table 14 Asia Pacific Growing Up Formula Revenue (USD Million) By Country (2021-2032)
Table 15 South America Growing Up Formula Revenue (USD Million) By Country (2021-2032)
Table 16 Middle East and Africa Growing Up Formula Revenue (USD Million) By Region (2021-2032)
Table 17 North America Growing Up Formula Revenue (USD Million) By Type (2021-2032)
Table 18 North America Growing Up Formula Revenue (USD Million) By Application (2021-2032)
Table 19 North America Growing Up Formula Revenue (USD Million) By Product (2021-2032)
Table 20 Europe Growing Up Formula Revenue (USD Million) By Type (2021-2032)
Table 21 Europe Growing Up Formula Revenue (USD Million) By Application (2021-2032)
Table 22 Europe Growing Up Formula Revenue (USD Million) By Product (2021-2032)
Table 23 Asia Pacific Growing Up Formula Revenue (USD Million) By Type (2021-2032)
Table 24 Asia Pacific Growing Up Formula Revenue (USD Million) By Application (2021-2032)
Table 25 Asia Pacific Growing Up Formula Revenue (USD Million) By Product (2021-2032)
Table 26 South America Growing Up Formula Revenue (USD Million) By Type (2021-2032)
Table 27 South America Growing Up Formula Revenue (USD Million) By Application (2021-2032)
Table 28 South America Growing Up Formula Revenue (USD Million) By Product (2021-2032)
Table 29 Middle East and Africa Growing Up Formula Revenue (USD Million) By Type (2021-2032)
Table 30 Middle East and Africa Growing Up Formula Revenue (USD Million) By Application (2021-2032)
Table 31 Middle East and Africa Growing Up Formula Revenue (USD Million) By Product (2021-2032)
LIST OF FIGURES
Figure 1. Market Scope
Figure 2. Pricing Forecasts Per Unit, 2023- 2032
Figure 3. Porter’s Five Forces
Figure 4. Global Growing Up Formula Market Revenue (USD Million) By Regions (2021-2032)
Figure 5. Global Growing Up Formula Market Share (%) By Regions (2023)
Figure 6. North America Growing Up Formula Revenue (USD Million) By Country (2021-2032)
Figure 7. United States Growing Up Formula Revenue (USD Million) By Country (2021-2032)
Figure 8. Canada Growing Up Formula Revenue (USD Million) By Country (2021-2032)
Figure 9. Mexico Growing Up Formula Revenue (USD Million) By Country (2021-2032)
Figure 10. Europe Growing Up Formula Revenue (USD Million) By Country (2021-2032)
Figure 11. Germany Growing Up Formula Revenue (USD Million) By Country (2021-2032)
Figure 12. France Growing Up Formula Revenue (USD Million) By Country (2021-2032)
Figure 13. United Kingdom Growing Up Formula Revenue (USD Million) By Country (2021-2032)
Figure 14. Spain Growing Up Formula Revenue (USD Million) By Country (2021-2032)
Figure 15. Italy Growing Up Formula Revenue (USD Million) By Country (2021-2032)
Figure 16. Russia Growing Up Formula Revenue (USD Million) By Country (2021-2032)
Figure 17. Rest of Europe Growing Up Formula Revenue (USD Million) By Country (2021-2032)
Figure 11. Asia Pacific Growing Up Formula Revenue (USD Million) By Country (2021-2032)
Figure 12. China Growing Up Formula Revenue (USD Million) By Country (2021-2032)
Figure 13. Japan Growing Up Formula Revenue (USD Million) By Country (2021-2032)
Figure 14. India Growing Up Formula Revenue (USD Million) By Country (2021-2032)
Figure 15. South Korea Growing Up Formula Revenue (USD Million) By Country (2021-2032)
Figure 16. Australia Growing Up Formula Revenue (USD Million) By Country (2021-2032)
Figure 17. South East Asia Growing Up Formula Revenue (USD Million) By Country (2021-2032)
Figure 18. South America Growing Up Formula Revenue (USD Million) By Country (2021-2032)
Figure 19. Brazil Growing Up Formula Revenue (USD Million) By Country (2021-2032)
Figure 20. Argentina Growing Up Formula Revenue (USD Million) By Country (2021-2032)
Figure 21. Rest of Asia Pacific Growing Up Formula Revenue (USD Million) By Country (2021-2032)
Figure 22. Middle East and Africa Growing Up Formula Revenue (USD Million) By Region (2021-2032)
Figure 23. Saudi Arabia Growing Up Formula Revenue (USD Million) By Region (2021-2032)
Figure 24. The UAE Growing Up Formula Revenue (USD Million) By Region (2021-2032)
Figure 25. Rest of Middle East Growing Up Formula Revenue (USD Million) By Region (2021-2032)
Figure 26. South Africa Growing Up Formula Revenue (USD Million) By Region (2021-2032)
Figure 27. Africa Growing Up Formula Revenue (USD Million) By Region (2021-2032)
Figure 28. North America Growing Up Formula Revenue (USD Million) By Type (2021-2032)
Figure 29. North America Growing Up Formula Revenue (USD Million) By Application (2021-2032)
Figure 30. North America Growing Up Formula Revenue (USD Million) By Product (2021-2032)
Figure 31. Europe Growing Up Formula Revenue (USD Million) By Type (2021-2032)
Figure 32. Europe Growing Up Formula Revenue (USD Million) By Application (2021-2032)
Figure 33. Europe Growing Up Formula Revenue (USD Million) By Product (2021-2032)
Figure 34. Asia Pacific Growing Up Formula Revenue (USD Million) By Type (2021-2032)
Figure 35. Asia Pacific Growing Up Formula Revenue (USD Million) By Application (2021-2032)
Figure 36. Asia Pacific Growing Up Formula Revenue (USD Million) By Product (2021-2032)
Figure 37. South America Growing Up Formula Revenue (USD Million) By Type (2021-2032)
Figure 38. South America Growing Up Formula Revenue (USD Million) By Application (2021-2032)
Figure 39. South America Growing Up Formula Revenue (USD Million) By Product (2021-2032)
Figure 40. Middle East and Africa Growing Up Formula Revenue (USD Million) By Type (2021-2032)
Figure 41. Middle East and Africa Growing Up Formula Revenue (USD Million) By Application (2021-2032)
Figure 42. Middle East and Africa Growing Up Formula Revenue (USD Million) By Product (2021-2032)
By Type
Organic
Conventional
By Application
Supermarkets/ Hypermarkets
Convenience Stores
Specialty Stores
Online Retail
Others
Countries Analyzed
North America (US, Canada, Mexico)
Europe (Germany, UK, France, Spain, Italy, Russia, Rest of Europe)
Asia Pacific (China, India, Japan, South Korea, Australia, South East Asia, Rest of Asia)
South America (Brazil, Argentina, Rest of South America)
Middle East and Africa (Saudi Arabia, UAE, Rest of Middle East, South Africa, Egypt, Rest of Africa)
