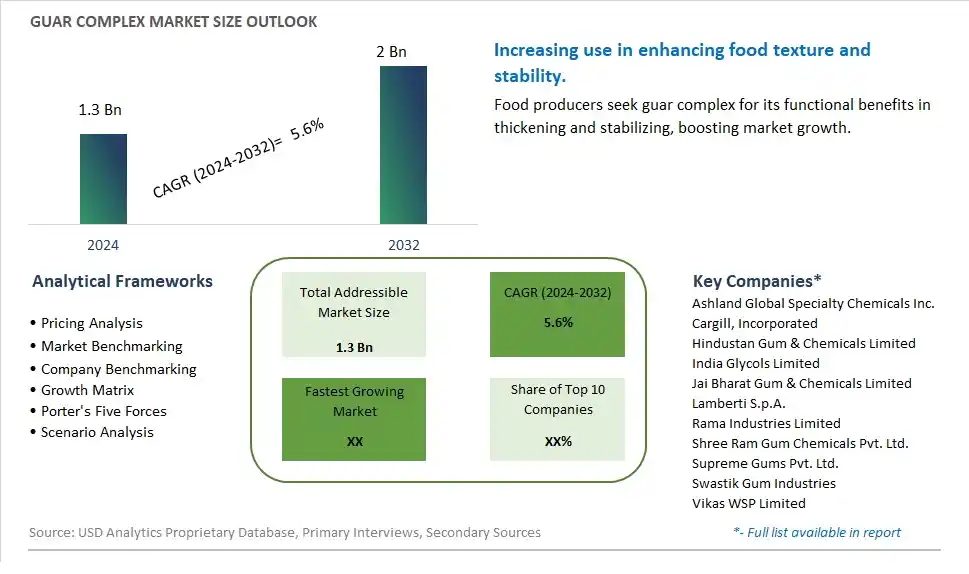
Global Guar Complex Market Size is valued at $1.3 Billion in 2024 and is forecast to register a growth rate (CAGR) of 5.6% to reach $2 Billion by 2032.
The global Guar Complex Market Comprehensive Study analyzes and forecasts the market size across 6 regions and 24 countries for diverse segments -By Type (Guar Seed, Guar Gum, Guar Meal, Others), By Application (Food and Beverages, Fracking, Textiles, Pharmaceuticals, Others), By Distribution Channel (Direct, Indirect)
An Introduction to Guar Complex Market
The Guar Complex market in 2024 is experiencing significant growth, driven by the rising demand for natural and versatile ingredients in food, cosmetics, and industrial applications. Guar complex, derived from guar beans, includes guar gum and other derivatives used for their thickening, stabilizing, and emulsifying properties. The market benefits from advancements in guar processing and application technologies, the growing trend of natural and clean label ingredients, and the expansion of the global food and industrial sectors. Additionally, the increasing focus on sustainable and plant-based ingredients is contributing to market growth.
Guar Complex Competitive Landscape
The market report analyses the leading companies in the industry including Ashland Global Specialty Chemicals Inc., Cargill, Incorporated, Hindustan Gum & Chemicals Limited, India Glycols Limited, Jai Bharat Gum & Chemicals Limited, Lamberti S.p.A., Rama Industries Limited, Shree Ram Gum Chemicals Pvt. Ltd., Supreme Gums Pvt. Ltd., Swastik Gum Industries, Vikas WSP Limited, and Others.
Guar Complex Market Dynamics
Guar Complex Market Trend: Increasing Demand for Natural and Functional Ingredients
The most prominent trend in the Guar Complex Market is the increasing demand for natural and functional ingredients. As consumers and industries seek natural additives that offer specific health benefits and functional properties, guar complex is gaining popularity for its versatility and effectiveness. This trend is driven by the growing interest in clean-label products and the desire for ingredients that support overall wellness.
Guar Complex Market Driver: Growth in Food and Beverage Applications
The key driver of the Guar Complex Market is the growth in food and beverage applications. As more manufacturers seek natural thickeners, stabilizers, and emulsifiers for their products, there is a higher demand for guar complex, which provides these functional benefits. This driver is supported by the trend towards natural and organic food products and the increasing use of functional ingredients in various food and beverage formulations, driving market growth for guar complex.
Guar Complex Market Opportunity: Expansion into New Industrial Applications
A significant opportunity in the Guar Complex Market lies in the expansion into new industrial applications. By developing innovative products that leverage the functional properties of guar complex, such as in pharmaceuticals, cosmetics, and personal care products, companies can attract a broader audience. Offering high-quality guar complex products that provide multiple benefits can help expand market reach and drive growth in various industrial sectors.
Guar Complex Market Share Analysis: Guar Gum segment generated the highest revenue share in the industry
Guar gum is the largest segment in the Guar Complex Market by type. This prominence is attributed to its extensive application across various industries. Guar gum, a natural thickening agent, is highly valued in the food and beverage industry for its ability to improve texture and stability in products such as ice cream, sauces, and baked goods. In the oil and gas industry, guar gum is crucial for hydraulic fracturing (fracking) processes, where it helps to create fractures in rock formations to extract oil and natural gas. The pharmaceutical and cosmetics industries also utilize guar gum for its binding, thickening, and stabilizing properties. The versatility, functionality, and demand across multiple sectors solidify guar gum's position as the largest segment in the guar complex market.
Guar Complex Market Share Analysis: Fracking is the fastest growing segment over the forecast period to 2032
The fracking segment is the fastest-growing segment in the Guar Complex Market by application, projected to experience significant growth by 2032. This growth is driven by the increasing demand for energy and the expansion of shale gas exploration activities. Guar gum plays a vital role in the fracking process, where it is used to thicken the water-based fluids that are pumped into the ground to fracture rock formations and release oil and natural gas. As the global energy landscape shifts towards unconventional oil and gas sources, the demand for fracking fluids and, consequently, guar gum is expected to rise significantly. The advancements in fracking technologies and the exploration of new shale reserves further bolster the growth of this segment. Additionally, the economic benefits and energy independence associated with shale gas extraction contribute to the increasing adoption of fracking, making it the fastest-growing application for guar complex products.
Guar Complex Market Share Analysis: Indirect segment generated the highest revenue share in the industry
The indirect distribution channel is the largest segment in the Guar Complex Market by distribution channel. This segment includes sales through intermediaries such as wholesalers, distributors, and retailers. The prevalence of indirect distribution is driven by the established supply chain infrastructure that ensures wide reach and accessibility of guar complex products across various regions. Indirect channels allow manufacturers to leverage the market presence and logistical capabilities of intermediaries to reach a broader customer base, including small and medium-sized enterprises that may not have direct purchasing arrangements. The extensive network of distributors and the ability to cater to diverse market needs through indirect channels reinforce its dominance in the guar complex market. Additionally, the indirect distribution model provides manufacturers with the flexibility to focus on production and innovation while relying on intermediaries to handle sales and distribution, ensuring efficient market penetration and customer service.
Guar Complex Market Segmentation
By Type
Guar Seed
Guar Gum
Guar Meal
Others
By Application
Food and Beverages
Fracking
Textiles
Pharmaceuticals
Others
By Distribution Channel
Direct
Indirect
Countries Analyzed
North America (US, Canada, Mexico)
Europe (Germany, UK, France, Spain, Italy, Russia, Rest of Europe)
Asia Pacific (China, India, Japan, South Korea, Australia, South East Asia, Rest of Asia)
South America (Brazil, Argentina, Rest of South America)
Middle East and Africa (Saudi Arabia, UAE, Rest of Middle East, South Africa, Egypt, Rest of Africa)
Guar Complex Companies Profiled in the Study
Ashland Global Specialty Chemicals Inc.
Cargill, Incorporated
Hindustan Gum & Chemicals Limited
India Glycols Limited
Jai Bharat Gum & Chemicals Limited
Lamberti S.p.A.
Rama Industries Limited
Shree Ram Gum Chemicals Pvt. Ltd.
Supreme Gums Pvt. Ltd.
Swastik Gum Industries
Vikas WSP Limited
*- List Not Exhaustive
Chapter 1. TABLE OF CONTENTS
Chapter 2. Introduction to Guar Complex Market
2.1. Market Overview
2.2. Key Statistics and Report Highlights
2.3. Scope of the Comprehensive Study
2.3.1. Market Definition
2.3.2 Countries and Regions Covered
2.3.3 Research Objective
2.3.4 Units, Currency, and Conversions
2.3.5 Industry Value Chain
2.4. Key Market Segments
2.5. Key Companies
2.6. Study Period
Chapter 3. Strategic Analysis Review
3.1. Guar Complex Pricing Analysis and Forecast
3.2. Porter’s Five Forces
3.3. Market Ecosystem
3.4. SWOT Analysis
3.5. Regulatory Scenario
3.3. Effects of Inflation, Russia-Ukraine War, moderating economic growth, and other macroeconomic factors
Chapter 4. Competitive Landscape
4.1. Market Share Analysis
4.1.1. Global Guar Complex Market Share by Company, 2023
4.1.2. Product Offerings of Leading Guar Complex Companies
4.2. Market Entropy
4.2.1. New Product Launches in the Industry
4.2.2. Mergers, Acquisitions, Joint ventures, and Partnerships
4.3. Key Strategies and Best Practices
Chapter 5. Global Market Projections: Best, Reference, and Low Case Scenarios
5.1. Growth Analysis- Case Scenario Definitions
5.2. Low Growth Case Scenario Forecasts
5.3. Reference Growth Case Scenario Forecasts
5.4. High Growth Case Scenario Forecasts
Chapter 6. Market Dynamics
6.1. Guar Complex Market Drivers
6.2. Guar Complex Market Challenges
6.6. Guar Complex Market Opportunities
6.4. Guar Complex Market Trends
Chapter 7. Global Guar Complex Market Outlook Trends
7.1. Global Guar Complex Revenue (USD Million) and CAGR (%) by Type (2021-2032)
7.2. Global Guar Complex Revenue (USD Million) and CAGR (%) by Application (2021-2032)
7.3. Global Guar Complex Revenue (USD Million) and CAGR (%) by Product (2021-2032)
By Type
Guar Seed
Guar Gum
Guar Meal
Others
By Application
Food and Beverages
Fracking
Textiles
Pharmaceuticals
Others
By Distribution Channel
Direct
Indirect
Chapter 8. Global Guar Complex Regional Analysis and Outlook
8.1. Global Guar Complex Revenue (USD Million) By Regions (2021- 2032)
8.2. North America Guar Complex Revenue (USD Million) by Country (2021-2032)
8.2.1. United States Guar Complex Regional Analysis and Outlook
8.2.2. Canada Guar Complex Regional Analysis and Outlook
8.2.3. Mexico Guar Complex Regional Analysis and Outlook
8.3. Europe Guar Complex Revenue (USD Million), by Country (2021-2032)
8.3.1. Germany Guar Complex Regional Analysis and Outlook
8.3.2. France Guar Complex Regional Analysis and Outlook
8.3.3. United Kingdom Guar Complex Regional Analysis and Outlook
8.3.4. Spain Guar Complex Regional Analysis and Outlook
8.3.5. Italy Guar Complex Regional Analysis and Outlook
8.3.6. Russia Guar Complex Regional Analysis and Outlook
8.3.7. Rest of Europe Guar Complex Regional Analysis and Outlook
8.4. Asia Pacific Guar Complex Revenue (USD Million) by Country (2021-2032)
8.4.1. China Guar Complex Regional Analysis and Outlook
8.4.2. Japan Guar Complex Regional Analysis and Outlook
8.4.3. India Guar Complex Regional Analysis and Outlook
8.4.4. South Korea Guar Complex Regional Analysis and Outlook
8.4.5. Australia Guar Complex Regional Analysis and Outlook
8.4.6. South East Asia Guar Complex Regional Analysis and Outlook
8.4.7. Rest of Asia Pacific Guar Complex Regional Analysis and Outlook
8.5. South America Guar Complex Revenue (USD Million), by Country (2021-2032)
8.5.1. Brazil Guar Complex Regional Analysis and Outlook
8.5.2. Argentina Guar Complex Regional Analysis and Outlook
8.5.3. Rest of South America Guar Complex Regional Analysis and Outlook
8.6. Middle East and Africa Guar Complex Revenue (USD Million) by Country (2021-2032)
8.6.1. Middle East Guar Complex Regional Analysis and Outlook
8.6.2. Africa Guar Complex Regional Analysis and Outlook
Chapter 9. North America Guar Complex Analysis and Outlook
9.1. North America Guar Complex Revenue (USD Million) by Segments (2021-2032)
9.1.1. North America Guar Complex Revenue (USD Million) by Type (2021-2032)
9.1.2. North America Guar Complex Revenue (USD Million) by Application (2021-2032)
9.1.3. North America Guar Complex Revenue (USD Million) by Product (2021-2032)
By Type
Guar Seed
Guar Gum
Guar Meal
Others
By Application
Food and Beverages
Fracking
Textiles
Pharmaceuticals
Others
By Distribution Channel
Direct
Indirect
Chapter 10. Europe Guar Complex Analysis and Outlook
10.1. Europe Guar Complex Revenue (USD Million), by Segments (USD Million) (2021-2032)
10.1.1. Europe Guar Complex Revenue (USD Million) by Type (2021-2032)
10.1.2. Europe Guar Complex Revenue (USD Million) by Application (2021-2032)
10.1.3. Europe Guar Complex Revenue (USD Million) by Product (2021-2032)
By Type
Guar Seed
Guar Gum
Guar Meal
Others
By Application
Food and Beverages
Fracking
Textiles
Pharmaceuticals
Others
By Distribution Channel
Direct
Indirect
Chapter 11. Asia Pacific Guar Complex Analysis and Outlook
11.1. Asia Pacific Guar Complex Revenue (USD Million), and Revenue (USD Million) by Segments (2021-2032)
11.1.1. Asia Pacific Guar Complex Revenue (USD Million) by Type (2021-2032)
11.1.2. Asia Pacific Guar Complex Revenue (USD Million) by Application (2021-2032)
11.1.3. Asia Pacific Guar Complex Revenue (USD Million) by Product (2021-2032)
By Type
Guar Seed
Guar Gum
Guar Meal
Others
By Application
Food and Beverages
Fracking
Textiles
Pharmaceuticals
Others
By Distribution Channel
Direct
Indirect
Chapter 12. South America Guar Complex Analysis and Outlook
12.1. South America Guar Complex Revenue (USD Million), by Segments (2021-2032)
12.1.1. South America Guar Complex Revenue (USD Million) by Type (2021-2032)
12.1.2. South America Guar Complex Revenue (USD Million) by Application (2021-2032)
12.1.3. South America Guar Complex Revenue (USD Million) by Product (2021-2032)
By Type
Guar Seed
Guar Gum
Guar Meal
Others
By Application
Food and Beverages
Fracking
Textiles
Pharmaceuticals
Others
By Distribution Channel
Direct
Indirect
Chapter 13. Middle East and Africa Guar Complex Analysis and Outlook
13.1. Middle East and Africa Guar Complex Revenue (USD Million), by Segments (2021-2032)
13.1.1. Middle East and Africa Guar Complex Revenue (USD Million) by Type (2021-2032)
13.1.2. Middle East and Africa Guar Complex Revenue (USD Million) by Application (2021-2032)
13.1.3. Middle East and Africa Guar Complex Revenue (USD Million) by Product (2021-2032)
By Type
Guar Seed
Guar Gum
Guar Meal
Others
By Application
Food and Beverages
Fracking
Textiles
Pharmaceuticals
Others
By Distribution Channel
Direct
Indirect
Chapter 14. Guar Complex Company Profiles
14.1 Business Overview
14.2 Product Profiles
14.3 SWOT Profiles
14.5 Recent Developments
14.6 Financial Profile
List of Companies
Ashland Global Specialty Chemicals Inc.
Cargill, Incorporated
Hindustan Gum & Chemicals Limited
India Glycols Limited
Jai Bharat Gum & Chemicals Limited
Lamberti S.p.A.
Rama Industries Limited
Shree Ram Gum Chemicals Pvt. Ltd.
Supreme Gums Pvt. Ltd.
Swastik Gum Industries
Vikas WSP Limited
15. Methodology and Data Sources
15.1 Customization Offerings
15.2 Subscription Services
15.3 Related Reports
15.4 Publisher Expertise
LIST OF TABLES
Table 1 Market Segmentation Analysis
Table 2 Global Guar Complex Market Share of Leading Companies, 2023
Table 3 Product Offerings of Leading Companies
Table 4 Low Growth Scenario Forecasts
Table 5 Reference Case Growth Scenario
Table 6 High Growth Case Scenario
Table 7 Global Guar Complex Revenue (USD Million) And CAGR (%) By Type (2021-2032)
Table 8 Global Guar Complex Revenue (USD Million) And CAGR (%) By Application (2021-2032)
Table 9 Global Guar Complex Revenue (USD Million) And CAGR (%) By Product (2021-2032)
Table 10 Global Guar Complex Market Revenue (USD Million) By Regions (2021-2032)
Table 11 Global Guar Complex Market Share (%) By Regions (2021-2032)
Table 12 North America Guar Complex Revenue (USD Million) By Country (2021-2032)
Table 13 Europe Guar Complex Revenue (USD Million) By Country (2021-2032)
Table 14 Asia Pacific Guar Complex Revenue (USD Million) By Country (2021-2032)
Table 15 South America Guar Complex Revenue (USD Million) By Country (2021-2032)
Table 16 Middle East and Africa Guar Complex Revenue (USD Million) By Region (2021-2032)
Table 17 North America Guar Complex Revenue (USD Million) By Type (2021-2032)
Table 18 North America Guar Complex Revenue (USD Million) By Application (2021-2032)
Table 19 North America Guar Complex Revenue (USD Million) By Product (2021-2032)
Table 20 Europe Guar Complex Revenue (USD Million) By Type (2021-2032)
Table 21 Europe Guar Complex Revenue (USD Million) By Application (2021-2032)
Table 22 Europe Guar Complex Revenue (USD Million) By Product (2021-2032)
Table 23 Asia Pacific Guar Complex Revenue (USD Million) By Type (2021-2032)
Table 24 Asia Pacific Guar Complex Revenue (USD Million) By Application (2021-2032)
Table 25 Asia Pacific Guar Complex Revenue (USD Million) By Product (2021-2032)
Table 26 South America Guar Complex Revenue (USD Million) By Type (2021-2032)
Table 27 South America Guar Complex Revenue (USD Million) By Application (2021-2032)
Table 28 South America Guar Complex Revenue (USD Million) By Product (2021-2032)
Table 29 Middle East and Africa Guar Complex Revenue (USD Million) By Type (2021-2032)
Table 30 Middle East and Africa Guar Complex Revenue (USD Million) By Application (2021-2032)
Table 31 Middle East and Africa Guar Complex Revenue (USD Million) By Product (2021-2032)
LIST OF FIGURES
Figure 1. Market Scope
Figure 2. Pricing Forecasts Per Unit, 2023- 2032
Figure 3. Porter’s Five Forces
Figure 4. Global Guar Complex Market Revenue (USD Million) By Regions (2021-2032)
Figure 5. Global Guar Complex Market Share (%) By Regions (2023)
Figure 6. North America Guar Complex Revenue (USD Million) By Country (2021-2032)
Figure 7. United States Guar Complex Revenue (USD Million) By Country (2021-2032)
Figure 8. Canada Guar Complex Revenue (USD Million) By Country (2021-2032)
Figure 9. Mexico Guar Complex Revenue (USD Million) By Country (2021-2032)
Figure 10. Europe Guar Complex Revenue (USD Million) By Country (2021-2032)
Figure 11. Germany Guar Complex Revenue (USD Million) By Country (2021-2032)
Figure 12. France Guar Complex Revenue (USD Million) By Country (2021-2032)
Figure 13. United Kingdom Guar Complex Revenue (USD Million) By Country (2021-2032)
Figure 14. Spain Guar Complex Revenue (USD Million) By Country (2021-2032)
Figure 15. Italy Guar Complex Revenue (USD Million) By Country (2021-2032)
Figure 16. Russia Guar Complex Revenue (USD Million) By Country (2021-2032)
Figure 17. Rest of Europe Guar Complex Revenue (USD Million) By Country (2021-2032)
Figure 11. Asia Pacific Guar Complex Revenue (USD Million) By Country (2021-2032)
Figure 12. China Guar Complex Revenue (USD Million) By Country (2021-2032)
Figure 13. Japan Guar Complex Revenue (USD Million) By Country (2021-2032)
Figure 14. India Guar Complex Revenue (USD Million) By Country (2021-2032)
Figure 15. South Korea Guar Complex Revenue (USD Million) By Country (2021-2032)
Figure 16. Australia Guar Complex Revenue (USD Million) By Country (2021-2032)
Figure 17. South East Asia Guar Complex Revenue (USD Million) By Country (2021-2032)
Figure 18. South America Guar Complex Revenue (USD Million) By Country (2021-2032)
Figure 19. Brazil Guar Complex Revenue (USD Million) By Country (2021-2032)
Figure 20. Argentina Guar Complex Revenue (USD Million) By Country (2021-2032)
Figure 21. Rest of Asia Pacific Guar Complex Revenue (USD Million) By Country (2021-2032)
Figure 22. Middle East and Africa Guar Complex Revenue (USD Million) By Region (2021-2032)
Figure 23. Saudi Arabia Guar Complex Revenue (USD Million) By Region (2021-2032)
Figure 24. The UAE Guar Complex Revenue (USD Million) By Region (2021-2032)
Figure 25. Rest of Middle East Guar Complex Revenue (USD Million) By Region (2021-2032)
Figure 26. South Africa Guar Complex Revenue (USD Million) By Region (2021-2032)
Figure 27. Africa Guar Complex Revenue (USD Million) By Region (2021-2032)
Figure 28. North America Guar Complex Revenue (USD Million) By Type (2021-2032)
Figure 29. North America Guar Complex Revenue (USD Million) By Application (2021-2032)
Figure 30. North America Guar Complex Revenue (USD Million) By Product (2021-2032)
Figure 31. Europe Guar Complex Revenue (USD Million) By Type (2021-2032)
Figure 32. Europe Guar Complex Revenue (USD Million) By Application (2021-2032)
Figure 33. Europe Guar Complex Revenue (USD Million) By Product (2021-2032)
Figure 34. Asia Pacific Guar Complex Revenue (USD Million) By Type (2021-2032)
Figure 35. Asia Pacific Guar Complex Revenue (USD Million) By Application (2021-2032)
Figure 36. Asia Pacific Guar Complex Revenue (USD Million) By Product (2021-2032)
Figure 37. South America Guar Complex Revenue (USD Million) By Type (2021-2032)
Figure 38. South America Guar Complex Revenue (USD Million) By Application (2021-2032)
Figure 39. South America Guar Complex Revenue (USD Million) By Product (2021-2032)
Figure 40. Middle East and Africa Guar Complex Revenue (USD Million) By Type (2021-2032)
Figure 41. Middle East and Africa Guar Complex Revenue (USD Million) By Application (2021-2032)
Figure 42. Middle East and Africa Guar Complex Revenue (USD Million) By Product (2021-2032)
By Type
Guar Seed
Guar Gum
Guar Meal
Others
By Application
Food and Beverages
Fracking
Textiles
Pharmaceuticals
Others
By Distribution Channel
Direct
Indirect
Countries Analyzed
North America (US, Canada, Mexico)
Europe (Germany, UK, France, Spain, Italy, Russia, Rest of Europe)
Asia Pacific (China, India, Japan, South Korea, Australia, South East Asia, Rest of Asia)
South America (Brazil, Argentina, Rest of South America)
Middle East and Africa (Saudi Arabia, UAE, Rest of Middle East, South Africa, Egypt, Rest of Africa)
