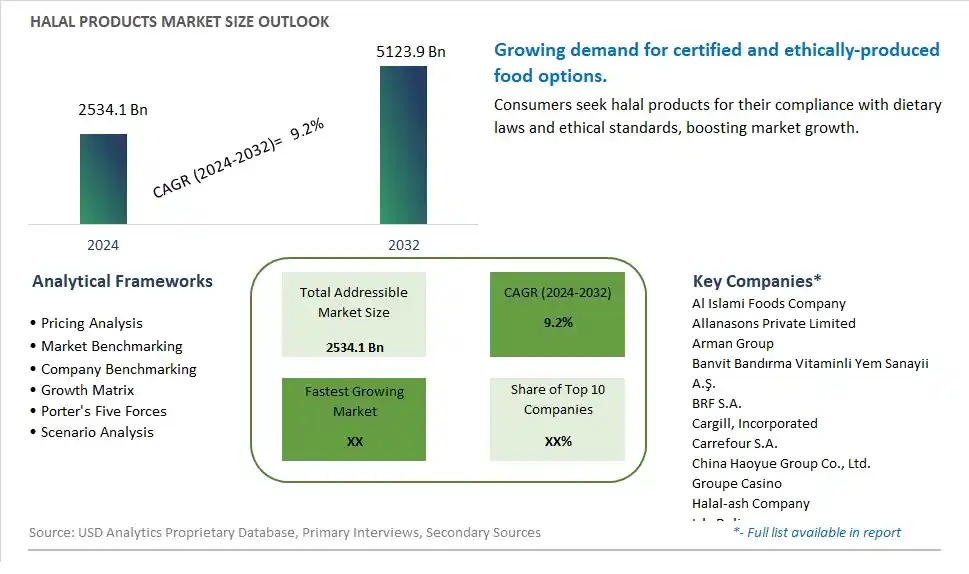
Global Halal Products Market Size is valued at $2534.1 Billion in 2024 and is forecast to register a growth rate (CAGR) of 9.2% to reach $5123.9 Billion by 2032.
The global Halal Products Market Comprehensive Study analyzes and forecasts the market size across 6 regions and 24 countries for diverse segments -By Product (Processed food and beverages., Halal meat products, Halal convenience food, Halal dairy products, Halal sauces, seasoning and condiments, Others), By Application (Pharmaceuticals, Cosmetics and personal care, Skin Care Products, Color Cosmetics Products, Hair Care Products, Fragrances Products, Others), By Distribution Channel (Supermarkets/Hypermarkets, Convenience Store, Retail Store, Specialty Store, Online store, Others)
An Introduction to Halal Products Market
The Halal Products market in 2024 is witnessing robust growth, driven by the rising demand for halal-certified foods and products among Muslim consumers and beyond. Halal products, adhering to Islamic dietary laws, are popular for their assurance of quality and ethical standards. The market benefits from advancements in halal certification processes and supply chain logistics, the growing trend of ethical and clean label foods, and the expansion of the global food and beverage sector. Additionally, the increasing awareness of halal products as a marker of quality and safety is contributing to market growth.
Halal Products Competitive Landscape
The market report analyses the leading companies in the industry including Al Islami Foods Company, Allanasons Private Limited, Arman Group, Banvit Bandırma Vitaminli Yem Sanayii A.Åž., BRF S.A., Cargill, Incorporated, Carrefour S.A., China Haoyue Group Co., Ltd., Groupe Casino, Halal-ash Company, Isla Delice, Midamar Corporation, Namet Gıda Sanayi ve Ticaret A.Åž., Nestlé S.A., Ramly Food Processing Sdn. Bhd., Smithfield Foods, Inc., Unilever PLC, and Others.
Halal Products Market Dynamics
Halal Products Market Trend: Increasing Demand for Halal-Certified Products
The most prominent trend in the Halal Products Market is the increasing demand for halal-certified products. As consumers seek products that comply with halal standards, there is a growing preference for a wide range of halal-certified food, personal care, and pharmaceutical products. This trend is driven by the expanding Muslim population and the desire for products that meet religious and ethical requirements.
Halal Products Market Driver: Growth in Muslim Population and Purchasing Power
The key driver of the Halal Products Market is the growth in the Muslim population and their increasing purchasing power. As the global Muslim population continues to rise, there is a higher demand for halal-certified products that cater to their dietary and lifestyle needs. This driver is supported by the trend towards ethical consumption and the increasing availability of halal products in mainstream markets, driving growth for the halal products market.
Halal Products Market Opportunity: Expansion into New Product Categories and Markets
A significant opportunity in the Halal Products Market lies in the expansion into new product categories and markets. By offering a diverse range of halal-certified products, such as cosmetics, pharmaceuticals, and processed foods, companies can attract a broader audience. Developing innovative products and marketing strategies that emphasize the quality and ethical standards of halal products can help expand market reach and drive growth in the halal sector.
Halal Products Market Share Analysis: Halal Meat Products segment generated the highest revenue share in the industry
Halal meat products are the largest segment in the Halal Products Market by product. The demand for halal meat products is driven by the growing Muslim population worldwide, which adheres to dietary laws that require meat to be prepared according to Islamic principles. Halal meat is not only consumed by Muslims but also by a growing number of non-Muslims who perceive it as being cleaner and healthier due to the stringent processing standards. The availability of halal meat products in various cuts and forms, including fresh, frozen, and processed meats, ensures that it caters to a wide range of consumer preferences and culinary applications. Additionally, the expansion of halal certification bodies and the increasing awareness of halal standards have bolstered consumer confidence, further driving the demand for halal meat products.
Halal Products Market Share Analysis: Cosmetics and Personal Care is the fastest growing segment over the forecast period to 2032
The cosmetics and personal care segment is the fastest-growing segment in the Halal Products Market by application, projected to see significant growth by 2032. This growth is fueled by the increasing consumer demand for products that align with their ethical and religious beliefs. Halal cosmetics and personal care products are free from ingredients derived from animals that are not slaughtered according to Islamic law, as well as alcohol, which makes them appealing to a broader audience beyond just Muslim consumers. The rising awareness of the benefits of using halal-certified products, which are often perceived as being more natural and safer, is driving their popularity. Furthermore, the expansion of the global beauty and personal care market, coupled with innovative product offerings such as halal-certified skincare, haircare, and makeup products, is propelling the rapid growth of this segment.
Halal Products Market Share Analysis: Supermarkets/Hypermarkets segment generated the highest revenue share in the industry
Supermarkets and hypermarkets are the largest segment in the Halal Products Market by distribution channel. These retail outlets dominate the market due to their extensive reach and the convenience they offer to consumers. Supermarkets and hypermarkets provide a wide range of halal products under one roof, including food, beverages, cosmetics, and personal care items, making it easy for consumers to find and purchase halal-certified products. The availability of halal sections or dedicated aisles in many supermarkets and hypermarkets has made it more accessible for consumers to adhere to their dietary and lifestyle preferences. Additionally, these retail outlets often run promotions and discounts on halal products, further attracting a large consumer base. The trust and reliability associated with established supermarket and hypermarket brands also play a crucial role in their dominance in the halal products market.
Halal Products Market Segmentation
By Product
Processed food and beverages.
Halal meat products
Halal convenience food
Halal dairy products
Halal sauces
seasoning and condiments
Others
By Application
Pharmaceuticals
Cosmetics and personal care
Skin Care Products
Color Cosmetics Products
Hair Care Products
Fragrances Products
Others
By Distribution Channel
Supermarkets/Hypermarkets
Convenience Store
Retail Store
Specialty Store
Online store
Others
Countries Analyzed
North America (US, Canada, Mexico)
Europe (Germany, UK, France, Spain, Italy, Russia, Rest of Europe)
Asia Pacific (China, India, Japan, South Korea, Australia, South East Asia, Rest of Asia)
South America (Brazil, Argentina, Rest of South America)
Middle East and Africa (Saudi Arabia, UAE, Rest of Middle East, South Africa, Egypt, Rest of Africa)
Halal Products Companies Profiled in the Study
Al Islami Foods Company
Allanasons Private Limited
Arman Group
Banvit Bandırma Vitaminli Yem Sanayii A.Ş.
BRF S.A.
Cargill, Incorporated
Carrefour S.A.
China Haoyue Group Co., Ltd.
Groupe Casino
Halal-ash Company
Isla Delice
Midamar Corporation
Namet Gıda Sanayi ve Ticaret A.Ş.
Nestlé S.A.
Ramly Food Processing Sdn. Bhd.
Smithfield Foods, Inc.
Unilever PLC
*- List Not Exhaustive
Chapter 1. TABLE OF CONTENTS
Chapter 2. Introduction to Halal Products Market
2.1. Market Overview
2.2. Key Statistics and Report Highlights
2.3. Scope of the Comprehensive Study
2.3.1. Market Definition
2.3.2 Countries and Regions Covered
2.3.3 Research Objective
2.3.4 Units, Currency, and Conversions
2.3.5 Industry Value Chain
2.4. Key Market Segments
2.5. Key Companies
2.6. Study Period
Chapter 3. Strategic Analysis Review
3.1. Halal Products Pricing Analysis and Forecast
3.2. Porter’s Five Forces
3.3. Market Ecosystem
3.4. SWOT Analysis
3.5. Regulatory Scenario
3.3. Effects of Inflation, Russia-Ukraine War, moderating economic growth, and other macroeconomic factors
Chapter 4. Competitive Landscape
4.1. Market Share Analysis
4.1.1. Global Halal Products Market Share by Company, 2023
4.1.2. Product Offerings of Leading Halal Products Companies
4.2. Market Entropy
4.2.1. New Product Launches in the Industry
4.2.2. Mergers, Acquisitions, Joint ventures, and Partnerships
4.3. Key Strategies and Best Practices
Chapter 5. Global Market Projections: Best, Reference, and Low Case Scenarios
5.1. Growth Analysis- Case Scenario Definitions
5.2. Low Growth Case Scenario Forecasts
5.3. Reference Growth Case Scenario Forecasts
5.4. High Growth Case Scenario Forecasts
Chapter 6. Market Dynamics
6.1. Halal Products Market Drivers
6.2. Halal Products Market Challenges
6.6. Halal Products Market Opportunities
6.4. Halal Products Market Trends
Chapter 7. Global Halal Products Market Outlook Trends
7.1. Global Halal Products Revenue (USD Million) and CAGR (%) by Type (2021-2032)
7.2. Global Halal Products Revenue (USD Million) and CAGR (%) by Application (2021-2032)
7.3. Global Halal Products Revenue (USD Million) and CAGR (%) by Product (2021-2032)
By Product
Processed food and beverages.
Halal meat products
Halal convenience food
Halal dairy products
Halal sauces
seasoning and condiments
Others
By Application
Pharmaceuticals
Cosmetics and personal care
Skin Care Products
Color Cosmetics Products
Hair Care Products
Fragrances Products
Others
By Distribution Channel
Supermarkets/Hypermarkets
Convenience Store
Retail Store
Specialty Store
Online store
Others
Chapter 8. Global Halal Products Regional Analysis and Outlook
8.1. Global Halal Products Revenue (USD Million) By Regions (2021- 2032)
8.2. North America Halal Products Revenue (USD Million) by Country (2021-2032)
8.2.1. United States Halal Products Regional Analysis and Outlook
8.2.2. Canada Halal Products Regional Analysis and Outlook
8.2.3. Mexico Halal Products Regional Analysis and Outlook
8.3. Europe Halal Products Revenue (USD Million), by Country (2021-2032)
8.3.1. Germany Halal Products Regional Analysis and Outlook
8.3.2. France Halal Products Regional Analysis and Outlook
8.3.3. United Kingdom Halal Products Regional Analysis and Outlook
8.3.4. Spain Halal Products Regional Analysis and Outlook
8.3.5. Italy Halal Products Regional Analysis and Outlook
8.3.6. Russia Halal Products Regional Analysis and Outlook
8.3.7. Rest of Europe Halal Products Regional Analysis and Outlook
8.4. Asia Pacific Halal Products Revenue (USD Million) by Country (2021-2032)
8.4.1. China Halal Products Regional Analysis and Outlook
8.4.2. Japan Halal Products Regional Analysis and Outlook
8.4.3. India Halal Products Regional Analysis and Outlook
8.4.4. South Korea Halal Products Regional Analysis and Outlook
8.4.5. Australia Halal Products Regional Analysis and Outlook
8.4.6. South East Asia Halal Products Regional Analysis and Outlook
8.4.7. Rest of Asia Pacific Halal Products Regional Analysis and Outlook
8.5. South America Halal Products Revenue (USD Million), by Country (2021-2032)
8.5.1. Brazil Halal Products Regional Analysis and Outlook
8.5.2. Argentina Halal Products Regional Analysis and Outlook
8.5.3. Rest of South America Halal Products Regional Analysis and Outlook
8.6. Middle East and Africa Halal Products Revenue (USD Million) by Country (2021-2032)
8.6.1. Middle East Halal Products Regional Analysis and Outlook
8.6.2. Africa Halal Products Regional Analysis and Outlook
Chapter 9. North America Halal Products Analysis and Outlook
9.1. North America Halal Products Revenue (USD Million) by Segments (2021-2032)
9.1.1. North America Halal Products Revenue (USD Million) by Type (2021-2032)
9.1.2. North America Halal Products Revenue (USD Million) by Application (2021-2032)
9.1.3. North America Halal Products Revenue (USD Million) by Product (2021-2032)
By Product
Processed food and beverages.
Halal meat products
Halal convenience food
Halal dairy products
Halal sauces
seasoning and condiments
Others
By Application
Pharmaceuticals
Cosmetics and personal care
Skin Care Products
Color Cosmetics Products
Hair Care Products
Fragrances Products
Others
By Distribution Channel
Supermarkets/Hypermarkets
Convenience Store
Retail Store
Specialty Store
Online store
Others
Chapter 10. Europe Halal Products Analysis and Outlook
10.1. Europe Halal Products Revenue (USD Million), by Segments (USD Million) (2021-2032)
10.1.1. Europe Halal Products Revenue (USD Million) by Type (2021-2032)
10.1.2. Europe Halal Products Revenue (USD Million) by Application (2021-2032)
10.1.3. Europe Halal Products Revenue (USD Million) by Product (2021-2032)
By Product
Processed food and beverages.
Halal meat products
Halal convenience food
Halal dairy products
Halal sauces
seasoning and condiments
Others
By Application
Pharmaceuticals
Cosmetics and personal care
Skin Care Products
Color Cosmetics Products
Hair Care Products
Fragrances Products
Others
By Distribution Channel
Supermarkets/Hypermarkets
Convenience Store
Retail Store
Specialty Store
Online store
Others
Chapter 11. Asia Pacific Halal Products Analysis and Outlook
11.1. Asia Pacific Halal Products Revenue (USD Million), and Revenue (USD Million) by Segments (2021-2032)
11.1.1. Asia Pacific Halal Products Revenue (USD Million) by Type (2021-2032)
11.1.2. Asia Pacific Halal Products Revenue (USD Million) by Application (2021-2032)
11.1.3. Asia Pacific Halal Products Revenue (USD Million) by Product (2021-2032)
By Product
Processed food and beverages.
Halal meat products
Halal convenience food
Halal dairy products
Halal sauces
seasoning and condiments
Others
By Application
Pharmaceuticals
Cosmetics and personal care
Skin Care Products
Color Cosmetics Products
Hair Care Products
Fragrances Products
Others
By Distribution Channel
Supermarkets/Hypermarkets
Convenience Store
Retail Store
Specialty Store
Online store
Others
Chapter 12. South America Halal Products Analysis and Outlook
12.1. South America Halal Products Revenue (USD Million), by Segments (2021-2032)
12.1.1. South America Halal Products Revenue (USD Million) by Type (2021-2032)
12.1.2. South America Halal Products Revenue (USD Million) by Application (2021-2032)
12.1.3. South America Halal Products Revenue (USD Million) by Product (2021-2032)
By Product
Processed food and beverages.
Halal meat products
Halal convenience food
Halal dairy products
Halal sauces
seasoning and condiments
Others
By Application
Pharmaceuticals
Cosmetics and personal care
Skin Care Products
Color Cosmetics Products
Hair Care Products
Fragrances Products
Others
By Distribution Channel
Supermarkets/Hypermarkets
Convenience Store
Retail Store
Specialty Store
Online store
Others
Chapter 13. Middle East and Africa Halal Products Analysis and Outlook
13.1. Middle East and Africa Halal Products Revenue (USD Million), by Segments (2021-2032)
13.1.1. Middle East and Africa Halal Products Revenue (USD Million) by Type (2021-2032)
13.1.2. Middle East and Africa Halal Products Revenue (USD Million) by Application (2021-2032)
13.1.3. Middle East and Africa Halal Products Revenue (USD Million) by Product (2021-2032)
By Product
Processed food and beverages.
Halal meat products
Halal convenience food
Halal dairy products
Halal sauces
seasoning and condiments
Others
By Application
Pharmaceuticals
Cosmetics and personal care
Skin Care Products
Color Cosmetics Products
Hair Care Products
Fragrances Products
Others
By Distribution Channel
Supermarkets/Hypermarkets
Convenience Store
Retail Store
Specialty Store
Online store
Others
Chapter 14. Halal Products Company Profiles
14.1 Business Overview
14.2 Product Profiles
14.3 SWOT Profiles
14.5 Recent Developments
14.6 Financial Profile
List of Companies
Al Islami Foods Company
Allanasons Private Limited
Arman Group
Banvit Bandırma Vitaminli Yem Sanayii A.Ş.
BRF S.A.
Cargill, Incorporated
Carrefour S.A.
China Haoyue Group Co., Ltd.
Groupe Casino
Halal-ash Company
Isla Delice
Midamar Corporation
Namet Gıda Sanayi ve Ticaret A.Ş.
Nestlé S.A.
Ramly Food Processing Sdn. Bhd.
Smithfield Foods, Inc.
Unilever PLC
15. Methodology and Data Sources
15.1 Customization Offerings
15.2 Subscription Services
15.3 Related Reports
15.4 Publisher Expertise
LIST OF TABLES
Table 1 Market Segmentation Analysis
Table 2 Global Halal Products Market Share of Leading Companies, 2023
Table 3 Product Offerings of Leading Companies
Table 4 Low Growth Scenario Forecasts
Table 5 Reference Case Growth Scenario
Table 6 High Growth Case Scenario
Table 7 Global Halal Products Revenue (USD Million) And CAGR (%) By Type (2021-2032)
Table 8 Global Halal Products Revenue (USD Million) And CAGR (%) By Application (2021-2032)
Table 9 Global Halal Products Revenue (USD Million) And CAGR (%) By Product (2021-2032)
Table 10 Global Halal Products Market Revenue (USD Million) By Regions (2021-2032)
Table 11 Global Halal Products Market Share (%) By Regions (2021-2032)
Table 12 North America Halal Products Revenue (USD Million) By Country (2021-2032)
Table 13 Europe Halal Products Revenue (USD Million) By Country (2021-2032)
Table 14 Asia Pacific Halal Products Revenue (USD Million) By Country (2021-2032)
Table 15 South America Halal Products Revenue (USD Million) By Country (2021-2032)
Table 16 Middle East and Africa Halal Products Revenue (USD Million) By Region (2021-2032)
Table 17 North America Halal Products Revenue (USD Million) By Type (2021-2032)
Table 18 North America Halal Products Revenue (USD Million) By Application (2021-2032)
Table 19 North America Halal Products Revenue (USD Million) By Product (2021-2032)
Table 20 Europe Halal Products Revenue (USD Million) By Type (2021-2032)
Table 21 Europe Halal Products Revenue (USD Million) By Application (2021-2032)
Table 22 Europe Halal Products Revenue (USD Million) By Product (2021-2032)
Table 23 Asia Pacific Halal Products Revenue (USD Million) By Type (2021-2032)
Table 24 Asia Pacific Halal Products Revenue (USD Million) By Application (2021-2032)
Table 25 Asia Pacific Halal Products Revenue (USD Million) By Product (2021-2032)
Table 26 South America Halal Products Revenue (USD Million) By Type (2021-2032)
Table 27 South America Halal Products Revenue (USD Million) By Application (2021-2032)
Table 28 South America Halal Products Revenue (USD Million) By Product (2021-2032)
Table 29 Middle East and Africa Halal Products Revenue (USD Million) By Type (2021-2032)
Table 30 Middle East and Africa Halal Products Revenue (USD Million) By Application (2021-2032)
Table 31 Middle East and Africa Halal Products Revenue (USD Million) By Product (2021-2032)
LIST OF FIGURES
Figure 1. Market Scope
Figure 2. Pricing Forecasts Per Unit, 2023- 2032
Figure 3. Porter’s Five Forces
Figure 4. Global Halal Products Market Revenue (USD Million) By Regions (2021-2032)
Figure 5. Global Halal Products Market Share (%) By Regions (2023)
Figure 6. North America Halal Products Revenue (USD Million) By Country (2021-2032)
Figure 7. United States Halal Products Revenue (USD Million) By Country (2021-2032)
Figure 8. Canada Halal Products Revenue (USD Million) By Country (2021-2032)
Figure 9. Mexico Halal Products Revenue (USD Million) By Country (2021-2032)
Figure 10. Europe Halal Products Revenue (USD Million) By Country (2021-2032)
Figure 11. Germany Halal Products Revenue (USD Million) By Country (2021-2032)
Figure 12. France Halal Products Revenue (USD Million) By Country (2021-2032)
Figure 13. United Kingdom Halal Products Revenue (USD Million) By Country (2021-2032)
Figure 14. Spain Halal Products Revenue (USD Million) By Country (2021-2032)
Figure 15. Italy Halal Products Revenue (USD Million) By Country (2021-2032)
Figure 16. Russia Halal Products Revenue (USD Million) By Country (2021-2032)
Figure 17. Rest of Europe Halal Products Revenue (USD Million) By Country (2021-2032)
Figure 11. Asia Pacific Halal Products Revenue (USD Million) By Country (2021-2032)
Figure 12. China Halal Products Revenue (USD Million) By Country (2021-2032)
Figure 13. Japan Halal Products Revenue (USD Million) By Country (2021-2032)
Figure 14. India Halal Products Revenue (USD Million) By Country (2021-2032)
Figure 15. South Korea Halal Products Revenue (USD Million) By Country (2021-2032)
Figure 16. Australia Halal Products Revenue (USD Million) By Country (2021-2032)
Figure 17. South East Asia Halal Products Revenue (USD Million) By Country (2021-2032)
Figure 18. South America Halal Products Revenue (USD Million) By Country (2021-2032)
Figure 19. Brazil Halal Products Revenue (USD Million) By Country (2021-2032)
Figure 20. Argentina Halal Products Revenue (USD Million) By Country (2021-2032)
Figure 21. Rest of Asia Pacific Halal Products Revenue (USD Million) By Country (2021-2032)
Figure 22. Middle East and Africa Halal Products Revenue (USD Million) By Region (2021-2032)
Figure 23. Saudi Arabia Halal Products Revenue (USD Million) By Region (2021-2032)
Figure 24. The UAE Halal Products Revenue (USD Million) By Region (2021-2032)
Figure 25. Rest of Middle East Halal Products Revenue (USD Million) By Region (2021-2032)
Figure 26. South Africa Halal Products Revenue (USD Million) By Region (2021-2032)
Figure 27. Africa Halal Products Revenue (USD Million) By Region (2021-2032)
Figure 28. North America Halal Products Revenue (USD Million) By Type (2021-2032)
Figure 29. North America Halal Products Revenue (USD Million) By Application (2021-2032)
Figure 30. North America Halal Products Revenue (USD Million) By Product (2021-2032)
Figure 31. Europe Halal Products Revenue (USD Million) By Type (2021-2032)
Figure 32. Europe Halal Products Revenue (USD Million) By Application (2021-2032)
Figure 33. Europe Halal Products Revenue (USD Million) By Product (2021-2032)
Figure 34. Asia Pacific Halal Products Revenue (USD Million) By Type (2021-2032)
Figure 35. Asia Pacific Halal Products Revenue (USD Million) By Application (2021-2032)
Figure 36. Asia Pacific Halal Products Revenue (USD Million) By Product (2021-2032)
Figure 37. South America Halal Products Revenue (USD Million) By Type (2021-2032)
Figure 38. South America Halal Products Revenue (USD Million) By Application (2021-2032)
Figure 39. South America Halal Products Revenue (USD Million) By Product (2021-2032)
Figure 40. Middle East and Africa Halal Products Revenue (USD Million) By Type (2021-2032)
Figure 41. Middle East and Africa Halal Products Revenue (USD Million) By Application (2021-2032)
Figure 42. Middle East and Africa Halal Products Revenue (USD Million) By Product (2021-2032)
By Product
Processed food and beverages.
Halal meat products
Halal convenience food
Halal dairy products
Halal sauces
seasoning and condiments
Others
By Application
Pharmaceuticals
Cosmetics and personal care
Skin Care Products
Color Cosmetics Products
Hair Care Products
Fragrances Products
Others
By Distribution Channel
Supermarkets/Hypermarkets
Convenience Store
Retail Store
Specialty Store
Online store
Others
Countries Analyzed
North America (US, Canada, Mexico)
Europe (Germany, UK, France, Spain, Italy, Russia, Rest of Europe)
Asia Pacific (China, India, Japan, South Korea, Australia, South East Asia, Rest of Asia)
South America (Brazil, Argentina, Rest of South America)
Middle East and Africa (Saudi Arabia, UAE, Rest of Middle East, South Africa, Egypt, Rest of Africa)
