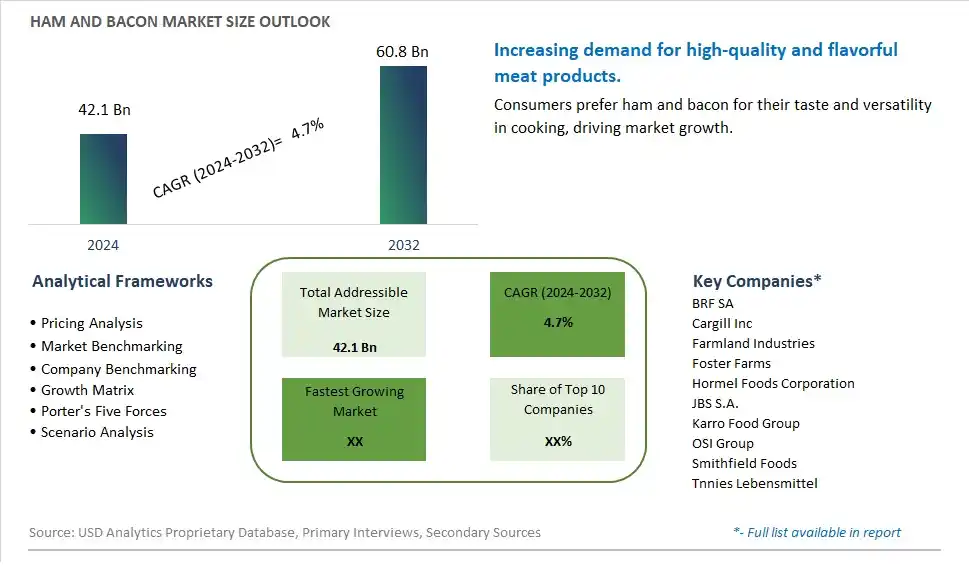
Global Ham and Bacon Market Size is valued at $42.1 Billion in 2024 and is forecast to register a growth rate (CAGR) of 4.7% to reach $60.8 Billion by 2032.
The global Ham and Bacon Market Comprehensive Study analyzes and forecasts the market size across 6 regions and 24 countries for diverse segments -By Type (Ham, Bacon), By Application (Supermarkets/Hypermarkets, Independent Retailers, Specialist Retailers, Others)
An Introduction to Ham and Bacon Market
The Ham and Bacon market in 2024 is experiencing significant growth, driven by the rising demand for high-quality and flavorful meat products. Ham and bacon, known for their rich taste and versatility in cooking, are staples in many cuisines. The market benefits from advancements in meat processing and preservation technologies, the growing trend of gourmet and convenience foods, and the expansion of the global meat sector. Additionally, the increasing focus on premium and naturally cured meat products is contributing to market growth.
Ham and Bacon Competitive Landscape
The market report analyses the leading companies in the industry including BRF SA, Cargill Inc, Farmland Industries, Foster Farms, Hormel Foods Corporation, JBS S.A., Karro Food Group, OSI Group, Smithfield Foods, Tnnies Lebensmittel, and Others.
Ham and Bacon Market Dynamics
Ham and Bacon Market Trend: Rising Demand for Premium and Artisanal Meat Products
The most prominent trend in the Ham and Bacon Market is the rising demand for premium and artisanal meat products. As consumers seek high-quality and unique meat experiences, ham and bacon are gaining popularity for their rich flavors and artisanal production methods. This trend is driven by the growing interest in gourmet food products and the desire for indulgent yet refined meat options.
Ham and Bacon Market Driver: Growth in Meat Consumption
The key driver of the Ham and Bacon Market is the growth in meat consumption. As more people enjoy meat as part of their diet, there is a higher demand for diverse and high-quality meat options, including ham and bacon. This driver is supported by the trend towards premiumization in the food industry and the increasing appreciation for artisanal and ethically sourced meat products, driving growth for ham and bacon.
Ham and Bacon Market Opportunity: Innovation in Meat Processing and Packaging
A significant opportunity in the Ham and Bacon Market lies in innovation in meat processing and packaging. By developing new and unique ham and bacon products that offer enhanced taste, texture, and nutritional benefits, companies can attract meat enthusiasts and connoisseurs. Offering innovative packaging solutions that enhance convenience and shelf life can help expand market reach and drive growth in the premium meat sector.
Ham and Bacon Market Share Analysis: Bacon segment generated the highest revenue share in the industry
Bacon is the largest segment in the Ham and Bacon Market by type. The popularity of bacon is driven by its versatile use in various culinary applications and its strong presence in traditional and contemporary diets. Bacon's distinct flavor, which is a combination of smoky, salty, and slightly sweet notes, makes it a favorite addition to breakfasts, sandwiches, salads, and even desserts. The global bacon craze, fueled by creative culinary trends and the rise of comfort food, has significantly boosted its consumption. Additionally, bacon's appeal crosses cultural boundaries, contributing to its widespread demand. The extensive marketing efforts and product innovations, such as pre-cooked bacon and flavored bacon varieties, have further cemented its leading position in the market.
Ham and Bacon Market Share Analysis: Supermarkets/Hypermarkets is the fastest growing segment over the forecast period to 2032
The supermarkets/hypermarkets segment is the fastest-growing segment in the Ham and Bacon Market by application, projected to see significant growth by 2032. This growth is driven by the convenience and extensive product variety these retail outlets offer. Supermarkets and hypermarkets provide a one-stop shopping experience where consumers can find a wide range of ham and bacon products, including various cuts, brands, and packaging sizes. These retail channels often have dedicated sections for deli meats and processed foods, making it easier for consumers to locate and purchase their preferred products. The trend of urbanization and the increasing number of supermarkets and hypermarkets in emerging economies are also contributing to the growth of this segment. Furthermore, the implementation of attractive promotions, discounts, and loyalty programs by these retailers encourages higher consumer spending on ham and bacon products. The trust and reliability associated with established supermarket and hypermarket brands also play a crucial role in attracting a large customer base.
Ham and Bacon Market Segmentation
By Type
Ham
Bacon
By Application
Supermarkets/Hypermarkets
Independent Retailers
Specialist Retailers
Others
Countries Analyzed
North America (US, Canada, Mexico)
Europe (Germany, UK, France, Spain, Italy, Russia, Rest of Europe)
Asia Pacific (China, India, Japan, South Korea, Australia, South East Asia, Rest of Asia)
South America (Brazil, Argentina, Rest of South America)
Middle East and Africa (Saudi Arabia, UAE, Rest of Middle East, South Africa, Egypt, Rest of Africa)
Ham and Bacon Companies Profiled in the Study
BRF SA
Cargill Inc
Farmland Industries
Foster Farms
Hormel Foods Corporation
JBS S.A.
Karro Food Group
OSI Group
Smithfield Foods
Tnnies Lebensmittel
*- List Not Exhaustive
Chapter 1. TABLE OF CONTENTS
Chapter 2. Introduction to Ham and Bacon Market
2.1. Market Overview
2.2. Key Statistics and Report Highlights
2.3. Scope of the Comprehensive Study
2.3.1. Market Definition
2.3.2 Countries and Regions Covered
2.3.3 Research Objective
2.3.4 Units, Currency, and Conversions
2.3.5 Industry Value Chain
2.4. Key Market Segments
2.5. Key Companies
2.6. Study Period
Chapter 3. Strategic Analysis Review
3.1. Ham and Bacon Pricing Analysis and Forecast
3.2. Porter’s Five Forces
3.3. Market Ecosystem
3.4. SWOT Analysis
3.5. Regulatory Scenario
3.3. Effects of Inflation, Russia-Ukraine War, moderating economic growth, and other macroeconomic factors
Chapter 4. Competitive Landscape
4.1. Market Share Analysis
4.1.1. Global Ham and Bacon Market Share by Company, 2023
4.1.2. Product Offerings of Leading Ham and Bacon Companies
4.2. Market Entropy
4.2.1. New Product Launches in the Industry
4.2.2. Mergers, Acquisitions, Joint ventures, and Partnerships
4.3. Key Strategies and Best Practices
Chapter 5. Global Market Projections: Best, Reference, and Low Case Scenarios
5.1. Growth Analysis- Case Scenario Definitions
5.2. Low Growth Case Scenario Forecasts
5.3. Reference Growth Case Scenario Forecasts
5.4. High Growth Case Scenario Forecasts
Chapter 6. Market Dynamics
6.1. Ham and Bacon Market Drivers
6.2. Ham and Bacon Market Challenges
6.6. Ham and Bacon Market Opportunities
6.4. Ham and Bacon Market Trends
Chapter 7. Global Ham and Bacon Market Outlook Trends
7.1. Global Ham and Bacon Revenue (USD Million) and CAGR (%) by Type (2021-2032)
7.2. Global Ham and Bacon Revenue (USD Million) and CAGR (%) by Application (2021-2032)
7.3. Global Ham and Bacon Revenue (USD Million) and CAGR (%) by Product (2021-2032)
By Type
Ham
Bacon
By Application
Supermarkets/Hypermarkets
Independent Retailers
Specialist Retailers
Others
Chapter 8. Global Ham and Bacon Regional Analysis and Outlook
8.1. Global Ham and Bacon Revenue (USD Million) By Regions (2021- 2032)
8.2. North America Ham and Bacon Revenue (USD Million) by Country (2021-2032)
8.2.1. United States Ham and Bacon Regional Analysis and Outlook
8.2.2. Canada Ham and Bacon Regional Analysis and Outlook
8.2.3. Mexico Ham and Bacon Regional Analysis and Outlook
8.3. Europe Ham and Bacon Revenue (USD Million), by Country (2021-2032)
8.3.1. Germany Ham and Bacon Regional Analysis and Outlook
8.3.2. France Ham and Bacon Regional Analysis and Outlook
8.3.3. United Kingdom Ham and Bacon Regional Analysis and Outlook
8.3.4. Spain Ham and Bacon Regional Analysis and Outlook
8.3.5. Italy Ham and Bacon Regional Analysis and Outlook
8.3.6. Russia Ham and Bacon Regional Analysis and Outlook
8.3.7. Rest of Europe Ham and Bacon Regional Analysis and Outlook
8.4. Asia Pacific Ham and Bacon Revenue (USD Million) by Country (2021-2032)
8.4.1. China Ham and Bacon Regional Analysis and Outlook
8.4.2. Japan Ham and Bacon Regional Analysis and Outlook
8.4.3. India Ham and Bacon Regional Analysis and Outlook
8.4.4. South Korea Ham and Bacon Regional Analysis and Outlook
8.4.5. Australia Ham and Bacon Regional Analysis and Outlook
8.4.6. South East Asia Ham and Bacon Regional Analysis and Outlook
8.4.7. Rest of Asia Pacific Ham and Bacon Regional Analysis and Outlook
8.5. South America Ham and Bacon Revenue (USD Million), by Country (2021-2032)
8.5.1. Brazil Ham and Bacon Regional Analysis and Outlook
8.5.2. Argentina Ham and Bacon Regional Analysis and Outlook
8.5.3. Rest of South America Ham and Bacon Regional Analysis and Outlook
8.6. Middle East and Africa Ham and Bacon Revenue (USD Million) by Country (2021-2032)
8.6.1. Middle East Ham and Bacon Regional Analysis and Outlook
8.6.2. Africa Ham and Bacon Regional Analysis and Outlook
Chapter 9. North America Ham and Bacon Analysis and Outlook
9.1. North America Ham and Bacon Revenue (USD Million) by Segments (2021-2032)
9.1.1. North America Ham and Bacon Revenue (USD Million) by Type (2021-2032)
9.1.2. North America Ham and Bacon Revenue (USD Million) by Application (2021-2032)
9.1.3. North America Ham and Bacon Revenue (USD Million) by Product (2021-2032)
By Type
Ham
Bacon
By Application
Supermarkets/Hypermarkets
Independent Retailers
Specialist Retailers
Others
Chapter 10. Europe Ham and Bacon Analysis and Outlook
10.1. Europe Ham and Bacon Revenue (USD Million), by Segments (USD Million) (2021-2032)
10.1.1. Europe Ham and Bacon Revenue (USD Million) by Type (2021-2032)
10.1.2. Europe Ham and Bacon Revenue (USD Million) by Application (2021-2032)
10.1.3. Europe Ham and Bacon Revenue (USD Million) by Product (2021-2032)
By Type
Ham
Bacon
By Application
Supermarkets/Hypermarkets
Independent Retailers
Specialist Retailers
Others
Chapter 11. Asia Pacific Ham and Bacon Analysis and Outlook
11.1. Asia Pacific Ham and Bacon Revenue (USD Million), and Revenue (USD Million) by Segments (2021-2032)
11.1.1. Asia Pacific Ham and Bacon Revenue (USD Million) by Type (2021-2032)
11.1.2. Asia Pacific Ham and Bacon Revenue (USD Million) by Application (2021-2032)
11.1.3. Asia Pacific Ham and Bacon Revenue (USD Million) by Product (2021-2032)
By Type
Ham
Bacon
By Application
Supermarkets/Hypermarkets
Independent Retailers
Specialist Retailers
Others
Chapter 12. South America Ham and Bacon Analysis and Outlook
12.1. South America Ham and Bacon Revenue (USD Million), by Segments (2021-2032)
12.1.1. South America Ham and Bacon Revenue (USD Million) by Type (2021-2032)
12.1.2. South America Ham and Bacon Revenue (USD Million) by Application (2021-2032)
12.1.3. South America Ham and Bacon Revenue (USD Million) by Product (2021-2032)
By Type
Ham
Bacon
By Application
Supermarkets/Hypermarkets
Independent Retailers
Specialist Retailers
Others
Chapter 13. Middle East and Africa Ham and Bacon Analysis and Outlook
13.1. Middle East and Africa Ham and Bacon Revenue (USD Million), by Segments (2021-2032)
13.1.1. Middle East and Africa Ham and Bacon Revenue (USD Million) by Type (2021-2032)
13.1.2. Middle East and Africa Ham and Bacon Revenue (USD Million) by Application (2021-2032)
13.1.3. Middle East and Africa Ham and Bacon Revenue (USD Million) by Product (2021-2032)
By Type
Ham
Bacon
By Application
Supermarkets/Hypermarkets
Independent Retailers
Specialist Retailers
Others
Chapter 14. Ham and Bacon Company Profiles
14.1 Business Overview
14.2 Product Profiles
14.3 SWOT Profiles
14.5 Recent Developments
14.6 Financial Profile
List of Companies
BRF SA
Cargill Inc
Farmland Industries
Foster Farms
Hormel Foods Corporation
JBS S.A.
Karro Food Group
OSI Group
Smithfield Foods
Tnnies Lebensmittel
15. Methodology and Data Sources
15.1 Customization Offerings
15.2 Subscription Services
15.3 Related Reports
15.4 Publisher Expertise
LIST OF TABLES
Table 1 Market Segmentation Analysis
Table 2 Global Ham and Bacon Market Share of Leading Companies, 2023
Table 3 Product Offerings of Leading Companies
Table 4 Low Growth Scenario Forecasts
Table 5 Reference Case Growth Scenario
Table 6 High Growth Case Scenario
Table 7 Global Ham and Bacon Revenue (USD Million) And CAGR (%) By Type (2021-2032)
Table 8 Global Ham and Bacon Revenue (USD Million) And CAGR (%) By Application (2021-2032)
Table 9 Global Ham and Bacon Revenue (USD Million) And CAGR (%) By Product (2021-2032)
Table 10 Global Ham and Bacon Market Revenue (USD Million) By Regions (2021-2032)
Table 11 Global Ham and Bacon Market Share (%) By Regions (2021-2032)
Table 12 North America Ham and Bacon Revenue (USD Million) By Country (2021-2032)
Table 13 Europe Ham and Bacon Revenue (USD Million) By Country (2021-2032)
Table 14 Asia Pacific Ham and Bacon Revenue (USD Million) By Country (2021-2032)
Table 15 South America Ham and Bacon Revenue (USD Million) By Country (2021-2032)
Table 16 Middle East and Africa Ham and Bacon Revenue (USD Million) By Region (2021-2032)
Table 17 North America Ham and Bacon Revenue (USD Million) By Type (2021-2032)
Table 18 North America Ham and Bacon Revenue (USD Million) By Application (2021-2032)
Table 19 North America Ham and Bacon Revenue (USD Million) By Product (2021-2032)
Table 20 Europe Ham and Bacon Revenue (USD Million) By Type (2021-2032)
Table 21 Europe Ham and Bacon Revenue (USD Million) By Application (2021-2032)
Table 22 Europe Ham and Bacon Revenue (USD Million) By Product (2021-2032)
Table 23 Asia Pacific Ham and Bacon Revenue (USD Million) By Type (2021-2032)
Table 24 Asia Pacific Ham and Bacon Revenue (USD Million) By Application (2021-2032)
Table 25 Asia Pacific Ham and Bacon Revenue (USD Million) By Product (2021-2032)
Table 26 South America Ham and Bacon Revenue (USD Million) By Type (2021-2032)
Table 27 South America Ham and Bacon Revenue (USD Million) By Application (2021-2032)
Table 28 South America Ham and Bacon Revenue (USD Million) By Product (2021-2032)
Table 29 Middle East and Africa Ham and Bacon Revenue (USD Million) By Type (2021-2032)
Table 30 Middle East and Africa Ham and Bacon Revenue (USD Million) By Application (2021-2032)
Table 31 Middle East and Africa Ham and Bacon Revenue (USD Million) By Product (2021-2032)
LIST OF FIGURES
Figure 1. Market Scope
Figure 2. Pricing Forecasts Per Unit, 2023- 2032
Figure 3. Porter’s Five Forces
Figure 4. Global Ham and Bacon Market Revenue (USD Million) By Regions (2021-2032)
Figure 5. Global Ham and Bacon Market Share (%) By Regions (2023)
Figure 6. North America Ham and Bacon Revenue (USD Million) By Country (2021-2032)
Figure 7. United States Ham and Bacon Revenue (USD Million) By Country (2021-2032)
Figure 8. Canada Ham and Bacon Revenue (USD Million) By Country (2021-2032)
Figure 9. Mexico Ham and Bacon Revenue (USD Million) By Country (2021-2032)
Figure 10. Europe Ham and Bacon Revenue (USD Million) By Country (2021-2032)
Figure 11. Germany Ham and Bacon Revenue (USD Million) By Country (2021-2032)
Figure 12. France Ham and Bacon Revenue (USD Million) By Country (2021-2032)
Figure 13. United Kingdom Ham and Bacon Revenue (USD Million) By Country (2021-2032)
Figure 14. Spain Ham and Bacon Revenue (USD Million) By Country (2021-2032)
Figure 15. Italy Ham and Bacon Revenue (USD Million) By Country (2021-2032)
Figure 16. Russia Ham and Bacon Revenue (USD Million) By Country (2021-2032)
Figure 17. Rest of Europe Ham and Bacon Revenue (USD Million) By Country (2021-2032)
Figure 11. Asia Pacific Ham and Bacon Revenue (USD Million) By Country (2021-2032)
Figure 12. China Ham and Bacon Revenue (USD Million) By Country (2021-2032)
Figure 13. Japan Ham and Bacon Revenue (USD Million) By Country (2021-2032)
Figure 14. India Ham and Bacon Revenue (USD Million) By Country (2021-2032)
Figure 15. South Korea Ham and Bacon Revenue (USD Million) By Country (2021-2032)
Figure 16. Australia Ham and Bacon Revenue (USD Million) By Country (2021-2032)
Figure 17. South East Asia Ham and Bacon Revenue (USD Million) By Country (2021-2032)
Figure 18. South America Ham and Bacon Revenue (USD Million) By Country (2021-2032)
Figure 19. Brazil Ham and Bacon Revenue (USD Million) By Country (2021-2032)
Figure 20. Argentina Ham and Bacon Revenue (USD Million) By Country (2021-2032)
Figure 21. Rest of Asia Pacific Ham and Bacon Revenue (USD Million) By Country (2021-2032)
Figure 22. Middle East and Africa Ham and Bacon Revenue (USD Million) By Region (2021-2032)
Figure 23. Saudi Arabia Ham and Bacon Revenue (USD Million) By Region (2021-2032)
Figure 24. The UAE Ham and Bacon Revenue (USD Million) By Region (2021-2032)
Figure 25. Rest of Middle East Ham and Bacon Revenue (USD Million) By Region (2021-2032)
Figure 26. South Africa Ham and Bacon Revenue (USD Million) By Region (2021-2032)
Figure 27. Africa Ham and Bacon Revenue (USD Million) By Region (2021-2032)
Figure 28. North America Ham and Bacon Revenue (USD Million) By Type (2021-2032)
Figure 29. North America Ham and Bacon Revenue (USD Million) By Application (2021-2032)
Figure 30. North America Ham and Bacon Revenue (USD Million) By Product (2021-2032)
Figure 31. Europe Ham and Bacon Revenue (USD Million) By Type (2021-2032)
Figure 32. Europe Ham and Bacon Revenue (USD Million) By Application (2021-2032)
Figure 33. Europe Ham and Bacon Revenue (USD Million) By Product (2021-2032)
Figure 34. Asia Pacific Ham and Bacon Revenue (USD Million) By Type (2021-2032)
Figure 35. Asia Pacific Ham and Bacon Revenue (USD Million) By Application (2021-2032)
Figure 36. Asia Pacific Ham and Bacon Revenue (USD Million) By Product (2021-2032)
Figure 37. South America Ham and Bacon Revenue (USD Million) By Type (2021-2032)
Figure 38. South America Ham and Bacon Revenue (USD Million) By Application (2021-2032)
Figure 39. South America Ham and Bacon Revenue (USD Million) By Product (2021-2032)
Figure 40. Middle East and Africa Ham and Bacon Revenue (USD Million) By Type (2021-2032)
Figure 41. Middle East and Africa Ham and Bacon Revenue (USD Million) By Application (2021-2032)
Figure 42. Middle East and Africa Ham and Bacon Revenue (USD Million) By Product (2021-2032)
By Type
Ham
Bacon
By Application
Supermarkets/Hypermarkets
Independent Retailers
Specialist Retailers
Others
Countries Analyzed
North America (US, Canada, Mexico)
Europe (Germany, UK, France, Spain, Italy, Russia, Rest of Europe)
Asia Pacific (China, India, Japan, South Korea, Australia, South East Asia, Rest of Asia)
South America (Brazil, Argentina, Rest of South America)
Middle East and Africa (Saudi Arabia, UAE, Rest of Middle East, South Africa, Egypt, Rest of Africa)
