
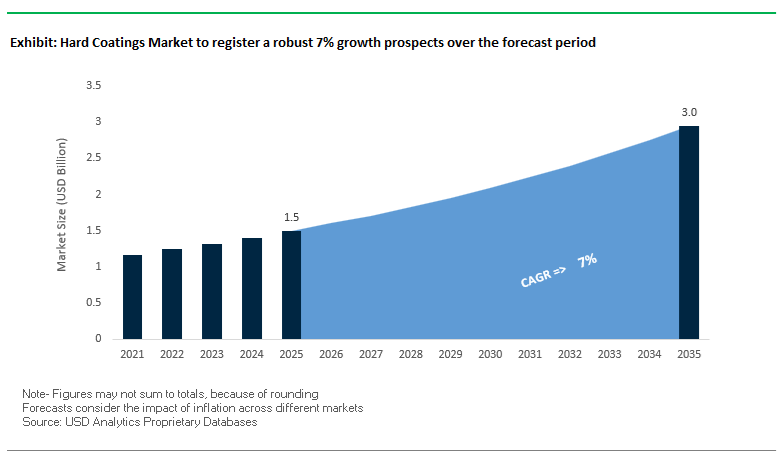
The Hard Coatings Market, valued at USD 1.5 billion in 2025, is projected to reach USD 3 billion by 2035, expanding at a consistent CAGR of 7% (2025–2035). Market growth is fueled by accelerated adoption of PVD coatings, CVD coatings, DLC coatings, HiPIMS coatings, and advanced nanocomposite coatings across aerospace, automotive, tooling, and precision engineering industries. For manufacturers and vendors, product differentiation now revolves around the ability to engineer high-hardness, thermally stable, environmentally compliant, and friction-reducing coatings that enhance tool life, reduce energy consumption, and meet the machining demands of modern lightweight materials.
Hard coating suppliers are increasingly focusing on high-temperature AlTiN nanocomposites, ultra-low friction DLC films, thicker HiPIMS-based wear-resistant layers, and corrosion-resistant alternatives to hard chrome. These advancements are reshaping competitive priorities in machining, EV powertrain engineering, aerospace component manufacturing, and high-precision industrial equipment.
The global hard coatings industry is undergoing rapid transformation driven by advances in surface engineering platforms, thermal spray automation, DLC capacity expansion, and high-performance machining requirements. A major milestone occurred in November 2025, when Oerlikon Balzers launched its INSPIRA carbon platform, integrating advanced S3p technology to enhance productivity and uniformity for next-generation carbon coatings. This move strengthens Oerlikon’s leadership in high-performance DLC coatings used in precision automotive and industrial components. Earlier, in July 2025, Oerlikon Metco unveiled Surface Two™, an IIoT-enabled thermal spray platform that boosts automation and scalability—ideal for aerospace and heavy industrial customers transitioning toward digitally optimized coating processes.
Capacity expansion remains a critical theme. IHI Ionbond announced in H2 2024 that its Grisolles facility in France will install a new HC1200 DLC coating system, significantly expanding European coating service capacity for automotive and aerospace OEMs. This comes as demand for low-friction, wear-resistant coatings intensifies with stricter emissions regulations and lightweight material machining. In September 2025, Oerlikon Balzers launched BALINIT OPTURA, a drilling-optimized PVD solution engineered to extend tool service life in steel and cast-iron machining—reflecting the strong link between hard coating innovation and high-speed precision manufacturing.
Meanwhile, thick high-performance coatings are gaining prominence. In March 2025, CemeCon announced the ability to achieve up to 12 µm thickness using HiPIMS on its FerroCon®Quadro coatings, making it one of the thickest and most durable PVD coating solutions available for heavy-duty cutting inserts. Oerlikon further advanced machining capabilities with BALDIA VARIA, launched in June 2025, offering diamond coatings tailored for machining CFRP and composite materials used widely in aerospace and EV manufacturing. Infrastructure expansion also accelerated in emerging markets, highlighted by Oerlikon’s February 2025 launch of its Smart Integrated Surface Solutions Centre in India, strengthening its service footprint across Asia’s fast-growing industrial corridor.
Other industry milestones include Ionbond’s 2024 launch of CVD 29 Ultra, strengthening its presence in continuous/interrupted cutting applications, and Oerlikon Balzers’ July 2024 introduction of BALORA™ TECH PRO, an environmental barrier coating engineered for aerospace and power-generation components exposed to extreme thermal and abrasive environments. Collectively, these developments signal a market moving toward smarter, thicker, more durable, and environmentally compliant hard coating technologies, optimized for the evolving needs of global manufacturing.
A major technological trend in the Hard Coatings Market is the widespread commercialization of super-hard multilayer and nanocomposite coatings—specifically architectures such as AlCrSiN and AlTiSiN—designed to withstand extreme heat and load conditions encountered in dry machining. These coatings deliver Vickers microhardness values exceeding 40 GPa (≈4,000 HV), making them ~1.5× harder than conventional TiAlN. This leap in hardness directly supports higher cutting speeds, reduced tool wear, and enhanced machining stability for hardened steels and alloys.
Thermal resilience is another defining advantage. Advanced AlCrSiN systems delay catastrophic oxidation until 1,100–1,260°C, compared to ≈800°C for TiAlN, allowing tools to operate reliably under high-speed, lubrication-free machining regimes. During cutting, these nanocomposite coatings form in situ tribo-layers (Al-rich or Si-rich oxides) that function as solid lubricants, maintaining low friction coefficients around ≈0.35, even at elevated temperatures.
Operational data shows significant productivity improvements. In hardened steels like SKD11, multilayer AlCrN/AlTiSiN coatings extend tool life—measured by total cutting distance—by up to 800 meters relative to single-layer systems. These performance attributes make nanocomposite coatings indispensable for maximizing tool utilization, reducing coolant consumption, and supporting sustainable high-speed machining.
Another major trend reshaping the Hard Coatings Market is the qualification of Environmental Barrier Coatings (EBCs) engineered for SiC/SiC Ceramic Matrix Composites (CMCs) in next-generation jet engines. Rare-earth silicate EBC structures, such as Si/Yb₂Si₂O₇, reduce steam volatilization-driven recession rates by a factor of ≥10, protecting CMC components operating above 1,300°C.
Thermal cycling is a key validation requirement, and qualified EBCs must survive >500 cycles at 1,300°C in ~90% steam without spallation or delamination. Chemical modifications—such as adding Al₂O₃ into the Yb₂Si₂O₇ top layer—further suppress SiO₂-based Thermally Grown Oxide (TGO) formation, reducing its thickness by ≈80–87% after 1,000 hours. This minimizes mechanical stresses and prevents premature coating failure.
Importantly, EBC performance depends on thermal expansion compatibility. The Yb₂Si₂O₇ material exhibits a CTE of ≈4.8×10⁻⁶/K, closely matching the ≈4.0×10⁻⁶/K CTE of SiC/SiC substrates, ensuring dimensional stability under severe thermal gradients. These technological advancements directly support higher turbine inlet temperatures, improved thermal efficiency, and reduced weight in next-generation aerospace propulsion systems.
The global move toward hydrogen-based combustion is creating a critical need for hydrogen-compatible, low-friction surface coatings. Hydrogen environments introduce unique wear modes and significantly increase the risk of hydrogen embrittlement, necessitating coatings that can function as effective diffusion barriers. Specialized ceramic or metallic interlayers can reduce hydrogen permeation by up to 75%, protecting steel pistons, liners, valves, and turbocharger components.
Traditional hydrogenated DLC (a-C:H) coatings—which achieve superlubricity (COF <0.01) in inert conditions—lose performance when trace water or oxygen is present in H₂ combustion. To overcome this, next-generation alternatives such as hydrogen-free DLC (ta-C) and composite systems are being engineered to sustain COF levels of ≈0.05–0.1 in hydrogen-rich environments—critical for optimizing boundary lubrication and minimizing wear.
High-temperature and hydrogen-driven wear stability is equally vital. Advanced coatings must maintain <10% variation in wear rate even when tribo-films shift away from hydrocarbon-based lubrication. As OEMs progress toward commercial H₂-ICE architectures, the demand for hydrogen-ready tribological coatings will accelerate sharply across powertrain, injector, and turbocharging subsystems.
A parallel opportunity is emerging from the growing need for antiviral and antimicrobial PVD coatings on high-touch surfaces in hospitals, transportation hubs, and public infrastructure. Ag–Cu nanolayer coatings have demonstrated 100% viral inactivation within 2–4 hours, making them highly relevant for environments where rapid mitigation of viral load is necessary.
These coatings exhibit strong antibacterial performance, achieving >4-log (~99.99%) reductions in pathogens such as E. coli and S. aureus within 24 hours, meeting ISO 22196 standards. To ensure extended functionality, specialized silver multilayers (~90 nm) are engineered for controlled, non-toxic ion release, maintaining antimicrobial efficacy even after repeated surface cleaning cycles.
Broad-spectrum effectiveness is another requirement: PVD coatings must achieve >90% inhibition zones for both Gram-positive and Gram-negative bacteria, enabling standardized use across medical devices, door hardware, kiosks, transit systems, and public-facing equipment. This positions antimicrobial hard coatings as a foundational material class for future public health resilience and infection-control infrastructure.
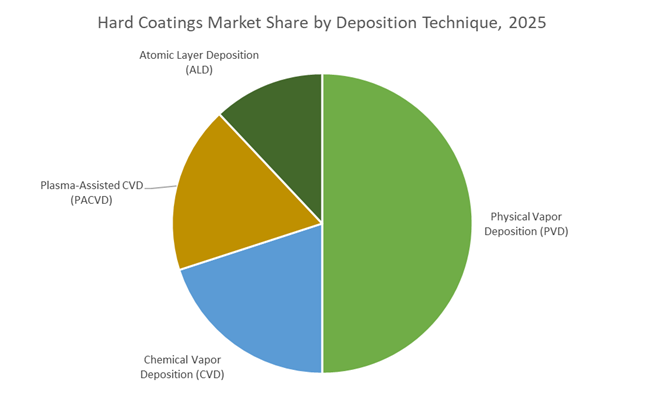
Physical Vapor Deposition (PVD) accounts for the largest share of the hard coatings market—approximately 50% in 2025—driven by its unmatched versatility, superior coating purity, and compatibility with the high-performance requirements of modern manufacturing. PVD processes such as sputtering, cathodic arc deposition, and evaporation enable atomically precise coating deposition in a controlled vacuum environment, producing dense, adherent films that significantly enhance wear resistance, oxidation resistance, and cutting-edge stability across a wide array of tools and components. Its lower process temperature—typically below 500°C—allows heat-sensitive substrates like hardened steels, carbide tools, and precision components to be coated without altering their dimensional or mechanical integrity, a key advantage over CVD-based technologies. The ability to deposit a wide spectrum of advanced materials—including TiN, TiCN, CrN, AlTiN, and nanocomposite coatings—further strengthens PVD’s position as the preferred solution for manufacturers seeking high hardness, superior tribological performance, and longer tool life. As industries accelerate adoption of high-speed machining, dry machining, and micro-fabrication, the demand for PVD coatings continues to expand, reinforcing the technique’s leadership across aerospace, automotive, semiconductor, and tooling applications.
The Tooling & Manufacturing sector accounts for roughly 30% of the global hard coatings market, underscoring its central role as the largest volume consumer due to its heavy reliance on coated cutting, forming, and machining tools. Hard coatings are critical for extending tool lifespan, increasing production throughput, and reducing operational costs in high-precision, high-demand manufacturing environments. Coatings such as TiN, AlTiN, and CrN deliver hardness levels exceeding 2,500 HV, enabling cutting tools to withstand extreme frictional heat, abrasive wear, and chemical degradation encountered during high-speed operations. The substantial increase in tool durability—often 3× to 10× longer than uncoated tools—directly improves machine uptime and reduces the frequency of tool changes, making these coatings indispensable for metalworking, automotive machining, injection molding, die casting, and general fabrication industries. The sector’s dominance is further reinforced by rapid industrialization in Asia-Pacific, the rise of automated machining centers, and the widespread shift toward dry machining practices that rely heavily on advanced hard coatings for thermal stability. As global manufacturers push for higher productivity, lower maintenance costs, and improved sustainability metrics, the tooling and manufacturing segment continues to anchor the majority of hard coating demand.
Switzerland and Germany remain the global stronghold for high-precision Physical Vapor Deposition (PVD), Chemical Vapor Deposition (CVD), and Diamond-Like Carbon (DLC) coating technologies, supported by decades of leadership in engineering, machine tooling, and industrial automation. Oerlikon Balzers, headquartered across Switzerland and Liechtenstein, has been a central driver of next-generation coating systems. Its INVENTA PVD system, launched in September 2024, incorporates Advanced Arc Technology (AAT) that boosts coating efficiency by up to 50% and improves target utilization by up to 60%, significantly reducing the Total Cost of Ownership (TCO) for global hard-coating job shops. This innovation is especially critical as tooling firms seek higher productivity to machine composites, hardened steels, and aerospace alloys. German job coaters and equipment manufacturers further extend this innovation by specializing in nanocomposite PVD/CVD coatings, with CemeCon AG advancing solutions for complex cutting tool geometries, molded dies, and high-wear machining operations.
The region is also a global leader in DLC coatings for automotive systems, including high-friction, high-temperature components such as valvetrain systems and fuel injection units. Products like Oerlikon Balzers’ BALIFOR T ta-C support e-mobility systems and high-efficiency combustion platforms by reducing friction losses and enhancing long-term reliability. Switzerland and Germany also dominate hard coatings for the medical device industry: Oerlikon’s BALIMED TICANA coating extends instrument lifespan, improves biocompatibility, and withstands repeated sterilization cycles. Collectively, the region’s technological maturity, vertically integrated coating ecosystem, and continuous equipment innovation reinforce Switzerland and Germany as global leaders in advanced hard coatings manufacturing and application engineering.
The United States represents one of the most advanced markets for high-performance hard coatings, driven by stringent aerospace requirements, defense material innovation, and a world-leading semiconductor manufacturing ecosystem. In late 2024, Oerlikon Balzers secured Airbus approval to apply REACH-compliant PVD coatings such as BALINIT C to aerospace components, affirming the U.S. as a central hub for aviation-grade surface engineering. U.S. defense initiatives are simultaneously advancing next-generation ceramic hard coatings—specifically boron carbide and titanium nitride—for ballistic protection, armor plating, aircraft skins, and erosion-resistant structures, reinforcing national security priorities.
The semiconductor sector remains the most technologically demanding consumer of hard coatings within the U.S. Chip-manufacturing OEMs such as Lam Research and Applied Materials rely on ALD and CVD coatings to protect critical chamber components, wafer chucks, pedestals, and etching assemblies from plasma erosion and particle contamination. These coatings enable advanced-node chip production by reducing downtime, extending tool life, and improving wafer yield. With semiconductor fabs operating under extreme chemical and thermal stresses, the U.S. continues to lead in functional hard coatings designed for thin-film uniformity, ultra-high adhesion, low outgassing, and corrosion resistance.
China’s rapidly scaling industrial base makes it one of the world’s largest consumers and increasingly a producer of hard coatings, with surging demand from automotive manufacturing, electronics, construction, and heavy machinery. The country’s need for PVD- and CVD-coated tools is growing exponentially due to expansion in machining, stamping, die-casting, and forming operations. This is enabling the rise of domestic job-coating centers equipped with modern PVD cathodic arc systems and CVD furnaces tailored to high-volume industrial tooling requirements.
China’s push for semiconductor self-reliance is another major catalyst. Government-funded initiatives require localized coating of etch chambers, PECVD/CVD components, and wafer-handling tools to protect them from corrosive chemistries and extend lifecycle reliability. Simultaneously, renewable energy and infrastructure megaprojects—such as wind turbines and high-capacity power systems—are driving interest in wear-resistant turbine coatings, including regional adoption of designs similar to BALINIT TURBINE PRO. As China strengthens its semiconductor value chain and accelerates heavy manufacturing upgrades, domestic PVD/CVD capacity is expected to expand sharply across the next decade.
South Korea’s leadership in consumer electronics, OLED displays, and semiconductor manufacturing makes it a strategic hub for advanced transparent hard coatings and scratch-resistant film technologies. Display manufacturers are developing 9H scratch-resistant hard coating films with optical transmission rates above 92%, engineered for premium smartphones, vehicle infotainment systems, and industrial touchscreens. These coatings ensure durability while preserving visual clarity, mechanical flexibility, and fingerprint resistance—requirements essential for foldable and next-generation display architectures.
In parallel, South Korea’s semiconductor giants—Samsung and SK Hynix—are intensifying R&D investments in advanced PVD, ALD, and multi-layer thin-film coatings to protect wafer-fabrication components from plasma, abrasion, and corrosive precursors. These hard coatings are essential to maintaining uptime and yield in advanced DRAM, NAND, and logic semiconductor production. Additionally, Korea’s booming EV sector is adopting hard coatings for electric motor components, inverters, and power electronics, where high-speed rotation, elevated temperatures, and electrical stress demand superior wear protection and thermal stability. The convergence of display, semiconductor, and EV technologies positions South Korea as a leading innovation hub for functional hard coatings tailored to next-generation electronics and mobility.
The competitive environment of the Hard Coatings Market is shaped by global surface engineering specialists with expertise in PVD, CVD, PACVD, HiPIMS, DLC, and thermal spray technologies. Companies such as Oerlikon, IHI Ionbond, CemeCon, Sulzer Metco, and Platit are investing in digitalized coating centers, energy-efficient coating chemistries, optimized tool coatings, and integrated equipment-service ecosystems. Their strategies combine technology leadership, geographic expansion, and application-driven innovation, reinforcing their influence across aerospace, automotive, EV, cutting tool, and high-precision industrial sectors.
Oerlikon Group, through Oerlikon Balzers and Oerlikon Metco, dominates the premium segment of the global surface engineering industry. Its BALINIT and BALORA series provide high-performance PVD/CVD coatings for precision tools and industrial components, while Metco supplies advanced thermal spray systems used in aerospace, energy, and heavy machinery. Recent innovations include the INSPIRA carbon platform (Nov 2025) integrating S3p technology and BALINIT OPTURA (Sept 2025) for drilling optimization. The group also expanded its regional presence with the launch of the Smart Integrated Surface Solutions Centre in Tumakuru, India (Feb 2025). Oerlikon continues to emphasize sustainable alternatives to hard chrome plating and high-efficiency coatings that reduce wear and energy consumption.
IHI Corporation, through Ionbond and Hauzer/Bernex, offers a full suite of PVD, PACVD, and CVD coating solutions across global service centers. Ionbond's product portfolio spans cutting tools, molds, automotive parts, and high-stress industrial components. The company expanded capacity in France (H2 2024) with a new HC1200 DLC system, supporting rising demand for low-friction coatings. Its CVD 29 Ultra (2024) coating delivers superior performance in continuous and interrupted machining, strengthening its competitive edge. With strong vertical integration—combining coating services, PVD/PACVD equipment (Hauzer), and CVD equipment (Bernex)—IHI maintains tight control over technology development and customization for fuel cell components, radar sensors, and high-performance cutting tools.
CemeCon AG is a global pioneer in HiPIMS technology, providing advanced PVD coating equipment (e.g., CC800® HiPIMS) and premium coating materials including FerroCon®, InoxaCon®, and AluCon®. Its HiPIMS platforms deliver exceptionally dense, smooth, and adhesive coatings with superior compressive stress. In March 2025, CemeCon achieved up to 12 µm coating thickness on FerroCon®Quadro, addressing demand for thicker, more durable coatings on cutting inserts used in heavy-duty machining. CemeCon also supports manufacturers seeking in-house coating systems, enabling flexible production control and specialized coatings for machining new materials used in EV and aerospace applications.
Sulzer's Metco division is a major supplier of thermal spray equipment, consumables, and thin-film hard coatings. Its portfolio includes HVOF, APS, LPPS-TF, and plasma-based processes suited for gas turbines, aircraft engines, and oil & gas applications. Metco’s long-standing experience in high-energy surface modification has resulted in advanced microalloyed coating systems that outperform traditional hard coatings at high cutting speeds. The division also develops specialized thermal barrier coatings (TBCs) and abrasion-resistant coatings, emphasizing reliability and performance in mission-critical environments.
Platit AG is a global provider of PVD and PACVD coating equipment, supplying flexible, user-friendly systems designed for small, mid-size, and full-scale coating centers. Its advanced arc technologies ensure uniform coating distribution on complex tool geometries, improving overall performance, adhesion, and wear resistance. Platit focuses on enabling manufacturers to deploy high-performance TiN, TiAlN, AlTiN, and DLC coatings across cutting tools, inserts, and precision-engineered components. The company’s emphasis on scalability and process optimization makes it a preferred partner for tool manufacturers seeking cost-effective, high-quality in-house coating capabilities.
|
Parameter |
Details |
|
Market Size (2025) |
$1.5 Billion |
|
Market Size (2035) |
$3 Billion |
|
Market Growth Rate |
7% |
|
Segments |
By Deposition Technique (Physical Vapor Deposition, Chemical Vapor Deposition, Plasma-Assisted CVD, Atomic Layer Deposition), By Material (Nitrides, Carbon-Based Coatings, Carbides, Oxides, Borides), By Application (Cutting Tools, Forming Tools, Precision Components, Optical & Decorative Coatings, Power Generation Components, Semiconductor Chamber Components), By End-User Industry (Automotive & Transportation, Aerospace & Defense, Tooling & Manufacturing, Medical, Electronics & Semiconductor, Energy & Power Generation) |
|
Study Period |
2019- 2024 and 2025-2034 |
|
Units |
Revenue (USD) |
|
Qualitative Analysis |
Porter’s Five Forces, SWOT Profile, Market Share, Scenario Forecasts, Market Ecosystem, Company Ranking, Market Dynamics, Industry Benchmarking |
|
Companies |
Oerlikon Balzers, CemeCon, IHI Ionbond, Hauzer Techno Coating, Sulzer Metco, Kobe Steel, AkzoNobel, PPG Industries, Advanced Coating Inc., Duralar Technologies, Carl Zeiss Meditec, Mevac GmbH, Platit AG, ASB Industries, H.C. Starck |
|
Countries |
US, Canada, Mexico, Germany, France, Spain, Italy, UK, Russia, China, India, Japan, South Korea, Australia, South East Asia, Brazil, Argentina, Middle East, Africa |
*- List not Exhaustive
The USDAnalytics Hard Coatings Market report investigates how PVD, CVD, PACVD, ALD and advanced nanocomposite systems are reshaping surface engineering across tooling, automotive, aerospace, semiconductor, and energy applications. This study reviews recent breakthroughs in AlTiN and AlCrSiN nanocomposite architectures, ultra-low-friction DLC, HiPIMS-thick films, diamond coatings for composites, and environmental barrier coatings (EBCs) for turbine hot-section parts. The analysis reviews capital investments, platform launches, regional coating-centre expansion, and shifts toward REACH-compliant, hard-chrome alternatives, while highlighting the performance gains in tool life, high-speed dry machining, hydrogen engine components, and antimicrobial public-contact surfaces. With in-depth qualitative assessments, quantitative market sizing, technology benchmarking, and competitive profiling of leading job coaters and equipment OEMs, this report highlights the key growth drivers, pricing dynamics, and application roadmaps that will shape demand to 2034. For strategy teams, product managers, procurement leaders, and R&D organisations, this report is an essential resource for understanding where value is migrating in the global Hard Coatings Market and how to align coating portfolios with next-generation industrial performance requirements.
Table of Contents: Hard Coatings Market
1. Executive Summary
1.1. Market Highlights
1.2. Key Findings
1.3. Global Market Snapshot
2. Hard Coatings Market Landscape & Outlook (2025–2035)
2.1. Introduction to Hard Coatings Market
2.2. Market Valuation and Growth Projections (2025–2035)
2.3. Role of Hard Coatings in High-Temperature and High-Wear Industrial Applications
2.4. Environmental Regulations, REACH Compliance, and Chrome Replacement Trends
2.5. Value Chain Structure, Equipment Platforms, and Job-Coating Ecosystem
3. Innovations Reshaping the Hard Coatings Market
3.1. Trend: Super-Hard Nanocomposite and Multilayer Coatings for Dry and High-Speed Machining
3.2. Trend: Environmental Barrier Coatings for Ceramic Matrix Composites in Aerospace Engines
3.3. Opportunity: Hydrogen-Compatible Low-Friction Coatings for H₂ Combustion Engines
3.4. Opportunity: Antiviral and Antimicrobial PVD Coatings for Public and Medical Infrastructure
4. Competitive Landscape and Strategic Initiatives
4.1. New Coating Platforms, Product Launches, and Technology Upgrades
4.2. Capacity Expansion in DLC, HiPIMS, and Advanced PVD/CVD Coatings
4.3. Digitalization, IIoT Integration, and Automated Surface Engineering
4.4. Strategic Partnerships, Regional Expansion, and Sustainability Initiatives
5. Market Share and Segmentation Insights: Hard Coatings Market
5.1. By Deposition Technique
5.1.1. Physical Vapor Deposition (PVD)
5.1.2. Chemical Vapor Deposition (CVD)
5.1.3. Plasma-Assisted CVD (PACVD)
5.1.4. Atomic Layer Deposition (ALD)
5.2. By Material
5.2.1. Nitrides (TiN, TiAlN, AlCrN, CrN)
5.2.2. Carbon-Based Coatings (DLC, ta-C)
5.2.3. Carbides (TiC, WC/C)
5.2.4. Oxides (Al₂O₃, ZrO₂)
5.2.5. Borides (TiB₂)
5.3. By Application
5.3.1. Cutting Tools
5.3.2. Forming Tools
5.3.3. Precision Components
5.3.4. Optical and Decorative Coatings
5.3.5. Power Generation Components
5.3.6. Semiconductor Chamber Components
5.4. By End-User Industry
5.4.1. Automotive and Transportation
5.4.2. Aerospace and Defense
5.4.3. Tooling and Manufacturing
5.4.4. Medical (Implants and Instruments)
5.4.5. Electronics and Semiconductor
5.4.6. Energy and Power Generation
6. Country Analysis and Outlook of Hard Coatings Market
6.1. United States
6.2. Canada
6.3. Mexico
6.4. Germany
6.5. France
6.6. Spain
6.7. Italy
6.8. United Kingdom
6.9. Russia
6.10. China
6.11. India
6.12. Japan
6.13. South Korea
6.14. Australia
6.15. South East Asia
6.16. Brazil
6.17. Argentina
6.18. Middle East
6.19. Africa
7. Hard Coatings Market Size Outlook by Region (2025–2035)
7.1. North America Hard Coatings Market Size Outlook to 2035
7.1.1. By Deposition Technique
7.1.2. By Material
7.1.3. By Application
7.1.4. By End-User Industry
7.2. Europe Hard Coatings Market Size Outlook to 2035
7.2.1. By Deposition Technique
7.2.2. By Material
7.2.3. By Application
7.2.4. By End-User Industry
7.3. Asia Pacific Hard Coatings Market Size Outlook to 2035
7.3.1. By Deposition Technique
7.3.2. By Material
7.3.3. By Application
7.3.4. By End-User Industry
7.4. South and Central America Hard Coatings Market Size Outlook to 2035
7.4.1. By Deposition Technique
7.4.2. By Material
7.4.3. By Application
7.4.4. By End-User Industry
7.5. Middle East and Africa Hard Coatings Market Size Outlook to 2035
7.5.1. By Deposition Technique
7.5.2. By Material
7.5.3. By Application
7.5.4. By End-User Industry
8. Company Profiles: Leading Players in the Hard Coatings Market
8.1. Oerlikon Balzers
8.2. CemeCon
8.3. IHI Ionbond
8.4. IHI Hauzer Techno Coating
8.5. Sulzer Metco
8.6. Kobe Steel
8.7. AkzoNobel
8.8. PPG Industries
8.9. Advanced Coating Inc.
8.10. Duralar Technologies
8.11. Carl Zeiss Meditec
8.12. Mevac GmbH
8.13. Platit AG
8.14. ASB Industries
8.15. H.C. Starck
9. Methodology
9.1. Research Scope
9.2. Market Research Approach
9.3. Market Sizing and Forecasting Model
9.4. Research Coverage
9.5. Data Horizon
9.6. Deliverables
10. Appendix
10.1. Acronyms and Abbreviations
10.2. List of Tables
10.3. List of Figures
The global Hard Coatings Market was valued at USD 1.5 billion in 2025 and is projected to reach approximately USD 3 billion by 2035. The market is expected to grow at a CAGR of 7% during 2025–2035. Growth is supported by rising demand from aerospace, automotive, tooling, and semiconductor industries. Adoption of advanced PVD, DLC, and HiPIMS coatings is a key driver.
PVD coatings dominate due to their high hardness, excellent adhesion, and low processing temperatures below 500°C. They are ideal for precision tools, automotive components, and aerospace parts. DLC coatings offer ultra-low friction, with coefficients as low as 0.05, reducing wear and energy losses. Together, these technologies deliver superior performance and environmental compliance.
HiPIMS coatings produce dense, smooth, and highly adhesive films with controlled stress profiles. Multilayer and nanocomposite structures such as AlTiSiN and AlCrSiN achieve hardness above 40 GPa and thermal stability beyond 1,100°C. These coatings can extend tool life by up to 300% and enable high-speed, dry machining. This significantly lowers tooling costs and downtime.
In aerospace, hard coatings provide oxidation resistance, thermal stability, and wear protection at temperatures exceeding 1,000°C. Environmental Barrier Coatings enable ceramic matrix composites to operate above 1,300°C in jet engines. In EVs, low-friction DLC and wear-resistant PVD coatings reduce losses in powertrain components. These coatings directly support efficiency, durability, and lightweight design goals.
Key players include Oerlikon Balzers, CemeCon, IHI Ionbond, Sulzer Metco, and Platit AG. Other notable participants are Kobe Steel, AkzoNobel, PPG Industries, H.C. Starck, and Advanced Coating Inc. Competitive differentiation is driven by coating thickness capability, thermal stability, digitalized coating platforms, and environmentally compliant alternatives to hard chrome.