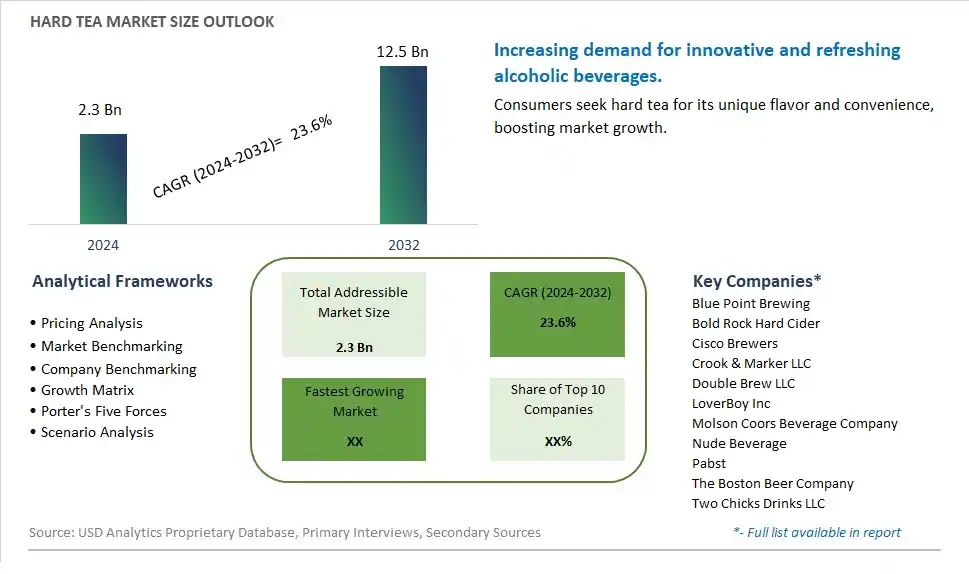
Global Hard Tea Market Size is valued at $2.3 Billion in 2024 and is forecast to register a growth rate (CAGR) of 23.6% to reach $12.5 Billion by 2032.
The global Hard Tea Market Comprehensive Study analyzes and forecasts the market size across 6 regions and 24 countries for diverse segments -By ABV (2 to 5%, Above 5%), By Flavor (Lemon, Raspberry, Peach, Orange, Others), By Distribution Channel (Supermarkets/ Hypermarkets, Convenience Stores, Specialty Stores, Online Retail, Others)
An Introduction to Hard Tea Market
In 2024, the Hard Tea market is witnessing robust growth, driven by the rising demand for innovative and refreshing alcoholic beverages. Hard tea, a blend of tea and alcohol, is popular for its unique flavor profile and lower alcohol content. The market benefits from advancements in beverage formulation and packaging technologies, the growing trend of craft and specialty drinks, and the expansion of the global alcoholic beverage sector. Additionally, the increasing focus on health-conscious and lower-calorie alcoholic options is contributing to market growth.
Hard Tea Competitive Landscape
The market report analyses the leading companies in the industry including Blue Point Brewing, Bold Rock Hard Cider, Cisco Brewers, Crook & Marker LLC, Double Brew LLC, LoverBoy Inc, Molson Coors Beverage Company, Nude Beverage, Pabst, The Boston Beer Company, Two Chicks Drinks LLC, and Others.
Hard Tea Market Dynamics
Hard Tea Market Trend: Rising Popularity of Alcoholic Beverages with Natural Ingredients
The most prominent trend in the Hard Tea Market is the rising popularity of alcoholic beverages with natural ingredients. As consumers seek healthier and more natural alcoholic options, hard tea, which combines the benefits of tea with the appeal of alcohol, is gaining traction. This trend is driven by the increasing demand for beverages that offer a balance between indulgence and wellness.
Hard Tea Market Driver: Growth in the Ready-to-Drink (RTD) Alcoholic Beverage Segment
The key driver of the Hard Tea Market is the growth in the ready-to-drink (RTD) alcoholic beverage segment. As more consumers seek convenient and portable alcoholic options, there is a higher demand for RTD beverages like hard tea that provide a refreshing and flavorful experience. This driver is supported by the trend towards premiumization and the increasing availability of hard tea products in various flavors and packaging formats.
Hard Tea Market Opportunity: Expansion into New Markets and Demographics
A significant opportunity in the Hard Tea Market lies in expansion into new markets and demographics. By targeting younger consumers and exploring international markets, companies can broaden their customer base and drive growth. Developing innovative marketing strategies that highlight the unique qualities of hard tea, such as its natural ingredients and diverse flavor profiles, can help attract new consumers and expand market reach.
Hard Tea Market Share Analysis: 2 to 5% ABV segment generated the highest revenue share in the industry
The largest segment in the Hard Tea Market by ABV (Alcohol by Volume) is the 2 to 5% category. This segment dominates the market because it offers a moderate alcohol content that appeals to a wide range of consumers looking for a refreshing beverage with a mild buzz. The 2 to 5% ABV hard teas are popular among those who enjoy social drinking and want a lighter alternative to traditional alcoholic beverages like beer or cocktails. This ABV range allows for easy consumption without the high intoxication risk, making it suitable for various occasions such as picnics, parties, and casual gatherings. The appeal of this segment is further enhanced by its compatibility with diverse flavor profiles, making it a versatile choice for consumers.
Hard Tea Market Share Analysis: Peach Flavor is the fastest growing segment over the forecast period to 2032
The fastest-growing segment in the Hard Tea Market by flavor is the peach flavor, projected to see significant growth by 2032. The popularity of peach-flavored hard tea is driven by its sweet, refreshing, and aromatic taste, which resonates well with consumers seeking a flavorful and enjoyable drinking experience. Peach flavor stands out for its ability to balance the bitterness of tea with its natural sweetness, making it a preferred choice among both young and adult drinkers. The growing trend of fruit-infused alcoholic beverages and the increasing consumer preference for innovative and exotic flavors contribute to the rapid growth of this segment. Additionally, the marketing efforts and product launches by major brands highlighting peach-flavored hard tea are expected to drive its demand further.
Hard Tea Market Share Analysis: Supermarkets/Hypermarkets segment generated the highest revenue share in the industry
Supermarkets and hypermarkets are the largest segment in the Hard Tea Market by distribution channel. These retail outlets dominate the market due to their extensive reach and the convenience they offer to consumers. Supermarkets and hypermarkets provide a wide variety of hard tea products, ensuring that customers have ample choices in terms of flavors, brands, and packaging sizes. The ability to physically browse and compare products, coupled with attractive promotions and discounts, makes these stores a preferred shopping destination for hard tea enthusiasts. Additionally, the strategic placement of hard tea products in prominent sections of the store increases visibility and encourages impulse purchases. The trust and reliability associated with established supermarket and hypermarket chains also play a crucial role in their dominance in the market, making it easier for consumers to access their favorite hard tea products.
Hard Tea Market Segmentation
By ABV
2 to 5%
Above 5%
By Flavor
Lemon
Raspberry
Peach
Orange
Others
By Distribution Channel
Supermarkets/ Hypermarkets
Convenience Stores
Specialty Stores
Online Retail
Others
Countries Analyzed
North America (US, Canada, Mexico)
Europe (Germany, UK, France, Spain, Italy, Russia, Rest of Europe)
Asia Pacific (China, India, Japan, South Korea, Australia, South East Asia, Rest of Asia)
South America (Brazil, Argentina, Rest of South America)
Middle East and Africa (Saudi Arabia, UAE, Rest of Middle East, South Africa, Egypt, Rest of Africa)
Hard Tea Companies Profiled in the Study
Blue Point Brewing
Bold Rock Hard Cider
Cisco Brewers
Crook & Marker LLC
Double Brew LLC
LoverBoy Inc
Molson Coors Beverage Company
Nude Beverage
Pabst
The Boston Beer Company
Two Chicks Drinks LLC
*- List Not Exhaustive
Chapter 1. TABLE OF CONTENTS
Chapter 2. Introduction to Hard Tea Market
2.1. Market Overview
2.2. Key Statistics and Report Highlights
2.3. Scope of the Comprehensive Study
2.3.1. Market Definition
2.3.2 Countries and Regions Covered
2.3.3 Research Objective
2.3.4 Units, Currency, and Conversions
2.3.5 Industry Value Chain
2.4. Key Market Segments
2.5. Key Companies
2.6. Study Period
Chapter 3. Strategic Analysis Review
3.1. Hard Tea Pricing Analysis and Forecast
3.2. Porter’s Five Forces
3.3. Market Ecosystem
3.4. SWOT Analysis
3.5. Regulatory Scenario
3.3. Effects of Inflation, Russia-Ukraine War, moderating economic growth, and other macroeconomic factors
Chapter 4. Competitive Landscape
4.1. Market Share Analysis
4.1.1. Global Hard Tea Market Share by Company, 2023
4.1.2. Product Offerings of Leading Hard Tea Companies
4.2. Market Entropy
4.2.1. New Product Launches in the Industry
4.2.2. Mergers, Acquisitions, Joint ventures, and Partnerships
4.3. Key Strategies and Best Practices
Chapter 5. Global Market Projections: Best, Reference, and Low Case Scenarios
5.1. Growth Analysis- Case Scenario Definitions
5.2. Low Growth Case Scenario Forecasts
5.3. Reference Growth Case Scenario Forecasts
5.4. High Growth Case Scenario Forecasts
Chapter 6. Market Dynamics
6.1. Hard Tea Market Drivers
6.2. Hard Tea Market Challenges
6.6. Hard Tea Market Opportunities
6.4. Hard Tea Market Trends
Chapter 7. Global Hard Tea Market Outlook Trends
7.1. Global Hard Tea Revenue (USD Million) and CAGR (%) by Type (2021-2032)
7.2. Global Hard Tea Revenue (USD Million) and CAGR (%) by Application (2021-2032)
7.3. Global Hard Tea Revenue (USD Million) and CAGR (%) by Product (2021-2032)
By ABV
2 to 5%
Above 5%
By Flavor
Lemon
Raspberry
Peach
Orange
Others
By Distribution Channel
Supermarkets/ Hypermarkets
Convenience Stores
Specialty Stores
Online Retail
Others
Chapter 8. Global Hard Tea Regional Analysis and Outlook
8.1. Global Hard Tea Revenue (USD Million) By Regions (2021- 2032)
8.2. North America Hard Tea Revenue (USD Million) by Country (2021-2032)
8.2.1. United States Hard Tea Regional Analysis and Outlook
8.2.2. Canada Hard Tea Regional Analysis and Outlook
8.2.3. Mexico Hard Tea Regional Analysis and Outlook
8.3. Europe Hard Tea Revenue (USD Million), by Country (2021-2032)
8.3.1. Germany Hard Tea Regional Analysis and Outlook
8.3.2. France Hard Tea Regional Analysis and Outlook
8.3.3. United Kingdom Hard Tea Regional Analysis and Outlook
8.3.4. Spain Hard Tea Regional Analysis and Outlook
8.3.5. Italy Hard Tea Regional Analysis and Outlook
8.3.6. Russia Hard Tea Regional Analysis and Outlook
8.3.7. Rest of Europe Hard Tea Regional Analysis and Outlook
8.4. Asia Pacific Hard Tea Revenue (USD Million) by Country (2021-2032)
8.4.1. China Hard Tea Regional Analysis and Outlook
8.4.2. Japan Hard Tea Regional Analysis and Outlook
8.4.3. India Hard Tea Regional Analysis and Outlook
8.4.4. South Korea Hard Tea Regional Analysis and Outlook
8.4.5. Australia Hard Tea Regional Analysis and Outlook
8.4.6. South East Asia Hard Tea Regional Analysis and Outlook
8.4.7. Rest of Asia Pacific Hard Tea Regional Analysis and Outlook
8.5. South America Hard Tea Revenue (USD Million), by Country (2021-2032)
8.5.1. Brazil Hard Tea Regional Analysis and Outlook
8.5.2. Argentina Hard Tea Regional Analysis and Outlook
8.5.3. Rest of South America Hard Tea Regional Analysis and Outlook
8.6. Middle East and Africa Hard Tea Revenue (USD Million) by Country (2021-2032)
8.6.1. Middle East Hard Tea Regional Analysis and Outlook
8.6.2. Africa Hard Tea Regional Analysis and Outlook
Chapter 9. North America Hard Tea Analysis and Outlook
9.1. North America Hard Tea Revenue (USD Million) by Segments (2021-2032)
9.1.1. North America Hard Tea Revenue (USD Million) by Type (2021-2032)
9.1.2. North America Hard Tea Revenue (USD Million) by Application (2021-2032)
9.1.3. North America Hard Tea Revenue (USD Million) by Product (2021-2032)
By ABV
2 to 5%
Above 5%
By Flavor
Lemon
Raspberry
Peach
Orange
Others
By Distribution Channel
Supermarkets/ Hypermarkets
Convenience Stores
Specialty Stores
Online Retail
Others
Chapter 10. Europe Hard Tea Analysis and Outlook
10.1. Europe Hard Tea Revenue (USD Million), by Segments (USD Million) (2021-2032)
10.1.1. Europe Hard Tea Revenue (USD Million) by Type (2021-2032)
10.1.2. Europe Hard Tea Revenue (USD Million) by Application (2021-2032)
10.1.3. Europe Hard Tea Revenue (USD Million) by Product (2021-2032)
By ABV
2 to 5%
Above 5%
By Flavor
Lemon
Raspberry
Peach
Orange
Others
By Distribution Channel
Supermarkets/ Hypermarkets
Convenience Stores
Specialty Stores
Online Retail
Others
Chapter 11. Asia Pacific Hard Tea Analysis and Outlook
11.1. Asia Pacific Hard Tea Revenue (USD Million), and Revenue (USD Million) by Segments (2021-2032)
11.1.1. Asia Pacific Hard Tea Revenue (USD Million) by Type (2021-2032)
11.1.2. Asia Pacific Hard Tea Revenue (USD Million) by Application (2021-2032)
11.1.3. Asia Pacific Hard Tea Revenue (USD Million) by Product (2021-2032)
By ABV
2 to 5%
Above 5%
By Flavor
Lemon
Raspberry
Peach
Orange
Others
By Distribution Channel
Supermarkets/ Hypermarkets
Convenience Stores
Specialty Stores
Online Retail
Others
Chapter 12. South America Hard Tea Analysis and Outlook
12.1. South America Hard Tea Revenue (USD Million), by Segments (2021-2032)
12.1.1. South America Hard Tea Revenue (USD Million) by Type (2021-2032)
12.1.2. South America Hard Tea Revenue (USD Million) by Application (2021-2032)
12.1.3. South America Hard Tea Revenue (USD Million) by Product (2021-2032)
By ABV
2 to 5%
Above 5%
By Flavor
Lemon
Raspberry
Peach
Orange
Others
By Distribution Channel
Supermarkets/ Hypermarkets
Convenience Stores
Specialty Stores
Online Retail
Others
Chapter 13. Middle East and Africa Hard Tea Analysis and Outlook
13.1. Middle East and Africa Hard Tea Revenue (USD Million), by Segments (2021-2032)
13.1.1. Middle East and Africa Hard Tea Revenue (USD Million) by Type (2021-2032)
13.1.2. Middle East and Africa Hard Tea Revenue (USD Million) by Application (2021-2032)
13.1.3. Middle East and Africa Hard Tea Revenue (USD Million) by Product (2021-2032)
By ABV
2 to 5%
Above 5%
By Flavor
Lemon
Raspberry
Peach
Orange
Others
By Distribution Channel
Supermarkets/ Hypermarkets
Convenience Stores
Specialty Stores
Online Retail
Others
Chapter 14. Hard Tea Company Profiles
14.1 Business Overview
14.2 Product Profiles
14.3 SWOT Profiles
14.5 Recent Developments
14.6 Financial Profile
List of Companies
Blue Point Brewing
Bold Rock Hard Cider
Cisco Brewers
Crook & Marker LLC
Double Brew LLC
LoverBoy Inc
Molson Coors Beverage Company
Nude Beverage
Pabst
The Boston Beer Company
Two Chicks Drinks LLC
15. Methodology and Data Sources
15.1 Customization Offerings
15.2 Subscription Services
15.3 Related Reports
15.4 Publisher Expertise
LIST OF TABLES
Table 1 Market Segmentation Analysis
Table 2 Global Hard Tea Market Share of Leading Companies, 2023
Table 3 Product Offerings of Leading Companies
Table 4 Low Growth Scenario Forecasts
Table 5 Reference Case Growth Scenario
Table 6 High Growth Case Scenario
Table 7 Global Hard Tea Revenue (USD Million) And CAGR (%) By Type (2021-2032)
Table 8 Global Hard Tea Revenue (USD Million) And CAGR (%) By Application (2021-2032)
Table 9 Global Hard Tea Revenue (USD Million) And CAGR (%) By Product (2021-2032)
Table 10 Global Hard Tea Market Revenue (USD Million) By Regions (2021-2032)
Table 11 Global Hard Tea Market Share (%) By Regions (2021-2032)
Table 12 North America Hard Tea Revenue (USD Million) By Country (2021-2032)
Table 13 Europe Hard Tea Revenue (USD Million) By Country (2021-2032)
Table 14 Asia Pacific Hard Tea Revenue (USD Million) By Country (2021-2032)
Table 15 South America Hard Tea Revenue (USD Million) By Country (2021-2032)
Table 16 Middle East and Africa Hard Tea Revenue (USD Million) By Region (2021-2032)
Table 17 North America Hard Tea Revenue (USD Million) By Type (2021-2032)
Table 18 North America Hard Tea Revenue (USD Million) By Application (2021-2032)
Table 19 North America Hard Tea Revenue (USD Million) By Product (2021-2032)
Table 20 Europe Hard Tea Revenue (USD Million) By Type (2021-2032)
Table 21 Europe Hard Tea Revenue (USD Million) By Application (2021-2032)
Table 22 Europe Hard Tea Revenue (USD Million) By Product (2021-2032)
Table 23 Asia Pacific Hard Tea Revenue (USD Million) By Type (2021-2032)
Table 24 Asia Pacific Hard Tea Revenue (USD Million) By Application (2021-2032)
Table 25 Asia Pacific Hard Tea Revenue (USD Million) By Product (2021-2032)
Table 26 South America Hard Tea Revenue (USD Million) By Type (2021-2032)
Table 27 South America Hard Tea Revenue (USD Million) By Application (2021-2032)
Table 28 South America Hard Tea Revenue (USD Million) By Product (2021-2032)
Table 29 Middle East and Africa Hard Tea Revenue (USD Million) By Type (2021-2032)
Table 30 Middle East and Africa Hard Tea Revenue (USD Million) By Application (2021-2032)
Table 31 Middle East and Africa Hard Tea Revenue (USD Million) By Product (2021-2032)
LIST OF FIGURES
Figure 1. Market Scope
Figure 2. Pricing Forecasts Per Unit, 2023- 2032
Figure 3. Porter’s Five Forces
Figure 4. Global Hard Tea Market Revenue (USD Million) By Regions (2021-2032)
Figure 5. Global Hard Tea Market Share (%) By Regions (2023)
Figure 6. North America Hard Tea Revenue (USD Million) By Country (2021-2032)
Figure 7. United States Hard Tea Revenue (USD Million) By Country (2021-2032)
Figure 8. Canada Hard Tea Revenue (USD Million) By Country (2021-2032)
Figure 9. Mexico Hard Tea Revenue (USD Million) By Country (2021-2032)
Figure 10. Europe Hard Tea Revenue (USD Million) By Country (2021-2032)
Figure 11. Germany Hard Tea Revenue (USD Million) By Country (2021-2032)
Figure 12. France Hard Tea Revenue (USD Million) By Country (2021-2032)
Figure 13. United Kingdom Hard Tea Revenue (USD Million) By Country (2021-2032)
Figure 14. Spain Hard Tea Revenue (USD Million) By Country (2021-2032)
Figure 15. Italy Hard Tea Revenue (USD Million) By Country (2021-2032)
Figure 16. Russia Hard Tea Revenue (USD Million) By Country (2021-2032)
Figure 17. Rest of Europe Hard Tea Revenue (USD Million) By Country (2021-2032)
Figure 11. Asia Pacific Hard Tea Revenue (USD Million) By Country (2021-2032)
Figure 12. China Hard Tea Revenue (USD Million) By Country (2021-2032)
Figure 13. Japan Hard Tea Revenue (USD Million) By Country (2021-2032)
Figure 14. India Hard Tea Revenue (USD Million) By Country (2021-2032)
Figure 15. South Korea Hard Tea Revenue (USD Million) By Country (2021-2032)
Figure 16. Australia Hard Tea Revenue (USD Million) By Country (2021-2032)
Figure 17. South East Asia Hard Tea Revenue (USD Million) By Country (2021-2032)
Figure 18. South America Hard Tea Revenue (USD Million) By Country (2021-2032)
Figure 19. Brazil Hard Tea Revenue (USD Million) By Country (2021-2032)
Figure 20. Argentina Hard Tea Revenue (USD Million) By Country (2021-2032)
Figure 21. Rest of Asia Pacific Hard Tea Revenue (USD Million) By Country (2021-2032)
Figure 22. Middle East and Africa Hard Tea Revenue (USD Million) By Region (2021-2032)
Figure 23. Saudi Arabia Hard Tea Revenue (USD Million) By Region (2021-2032)
Figure 24. The UAE Hard Tea Revenue (USD Million) By Region (2021-2032)
Figure 25. Rest of Middle East Hard Tea Revenue (USD Million) By Region (2021-2032)
Figure 26. South Africa Hard Tea Revenue (USD Million) By Region (2021-2032)
Figure 27. Africa Hard Tea Revenue (USD Million) By Region (2021-2032)
Figure 28. North America Hard Tea Revenue (USD Million) By Type (2021-2032)
Figure 29. North America Hard Tea Revenue (USD Million) By Application (2021-2032)
Figure 30. North America Hard Tea Revenue (USD Million) By Product (2021-2032)
Figure 31. Europe Hard Tea Revenue (USD Million) By Type (2021-2032)
Figure 32. Europe Hard Tea Revenue (USD Million) By Application (2021-2032)
Figure 33. Europe Hard Tea Revenue (USD Million) By Product (2021-2032)
Figure 34. Asia Pacific Hard Tea Revenue (USD Million) By Type (2021-2032)
Figure 35. Asia Pacific Hard Tea Revenue (USD Million) By Application (2021-2032)
Figure 36. Asia Pacific Hard Tea Revenue (USD Million) By Product (2021-2032)
Figure 37. South America Hard Tea Revenue (USD Million) By Type (2021-2032)
Figure 38. South America Hard Tea Revenue (USD Million) By Application (2021-2032)
Figure 39. South America Hard Tea Revenue (USD Million) By Product (2021-2032)
Figure 40. Middle East and Africa Hard Tea Revenue (USD Million) By Type (2021-2032)
Figure 41. Middle East and Africa Hard Tea Revenue (USD Million) By Application (2021-2032)
Figure 42. Middle East and Africa Hard Tea Revenue (USD Million) By Product (2021-2032)
By ABV
2 to 5%
Above 5%
By Flavor
Lemon
Raspberry
Peach
Orange
Others
By Distribution Channel
Supermarkets/ Hypermarkets
Convenience Stores
Specialty Stores
Online Retail
Others
Countries Analyzed
North America (US, Canada, Mexico)
Europe (Germany, UK, France, Spain, Italy, Russia, Rest of Europe)
Asia Pacific (China, India, Japan, South Korea, Australia, South East Asia, Rest of Asia)
South America (Brazil, Argentina, Rest of South America)
Middle East and Africa (Saudi Arabia, UAE, Rest of Middle East, South Africa, Egypt, Rest of Africa)
