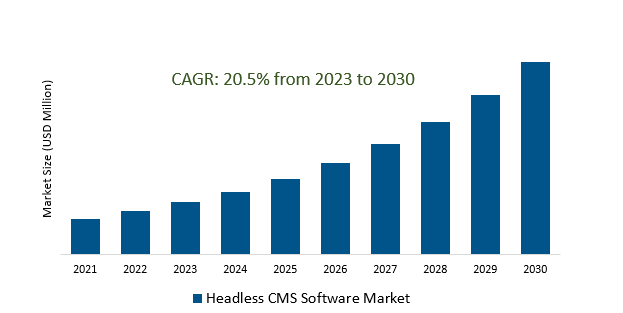
The Headless CMS Software Market Size is estimated to register 20.5% growth over the forecast period from 2023 to 2030.
Headless CMS Software Market Overview
Businesses aim to provide seamless and consistent content experiences across websites, mobile apps, IoT devices, and other touchpoints are propelling the demand. The decoupled nature of headless CMS allows developers greater flexibility to create custom experiences by leveraging APIs and integrations with other tools and systems. Prioritizing developer-friendly features, enhancing developer experience (DX) by offering modern development frameworks, intuitive interfaces, and robust APIs are fueling the demand. Businesses are aiming to leverage AI-driven insights to personalize content based on user behavior and preferences, improving customer engagement and satisfaction. Cloud-based offerings offer benefits like easier updates, reduced maintenance, and better accessibility from anywhere, driving their adoption.
Headless CMS Software Market Dynamics
Market Trends- Content as a Service (CaaS) revolutionizing Headless CMS Software Market.
Allowing businesses to store, manage, and distribute content through APIs, enabling seamless content delivery across multiple channels and platforms are the key factors.
Organizations are seeking to create content that can be repurposed and adapted for various applications, devices, and channels, driving the need for a structured and easily accessible content repository.
Further, the integration of CaaS functionalities into headless CMS solutions is gaining momentum, empowering businesses to adopt a more flexible and adaptable approach to content management.
Market Driver- Growing adoption of API-first Approach and Microservices drives the Headless CMS Software Market.
Growing agile development processes, enabling teams to work on specific content components independently and enabling faster innovation in content delivery strategies are fueling the market growth.
Organizations are seeking headless CMS solutions that offer interoperability and can easily integrate with third-party tools, e-commerce platforms, analytics systems, and marketing automation tools, driving the market growth.
Further, the adoption of microservices architecture is being propelled by the need for modular and scalable content management solutions.
Market Opportunity- Introduction of Security and Scalability in the Headless CMS Software Market.
With data breaches becoming more prevalent, businesses are prioritizing robust security features, including encryption, access controls, and compliance adherence, to safeguard sensitive content and uphold data privacy regulations such as GDPR and CCPA.
Additionally, the demand for scalable solutions is driven by the need to manage vast and diverse content efficiently. Businesses are seeking platforms capable of handling the growing content volume without compromising performance.
Further, emphasizing the necessity for platforms that offer robust security frameworks and efficient scalability to manage content effectively in the dynamic digital sphere are fueling the demand.
Market Share Analysis- cloud-based will register the fastest growth.
The Headless CMS Software Market is analyzed across Cloud & On Premise. cloud-based is poised to register the fastest growth. Cloud-based headless CMS platforms provide scalability, allowing businesses to manage content efficiently while adapting to varying demands. This scalability factor is crucial, especially as companies experience growth or fluctuations in content volume, enabling them to scale resources up or down as needed without the constraints of physical infrastructure. These platforms facilitate easy access to content management tools and resources from anywhere with an internet connection, promoting collaboration among teams spread across different locations and enabling remote work scenarios. Moreover, cloud-based headless CMS offerings often operate on a subscription-based model, allowing businesses to avoid significant upfront infrastructure costs.
Market Share Analysis- E-Commerce held a significant market share in 2023.
The Headless CMS Software Market is analyzed across various applications including Hospitality, Retail pharmacy, E-Commerce, Supermarkets and General stores & Others. Of these, E-Commerce held a significant market share in 2023. Headless CMS platforms cater specifically to the multifaceted requirements of E-commerce businesses by offering a versatile and modular approach to content management. These solutions empower E-commerce companies to efficiently manage product catalogs, create engaging content, and deliver seamless user experiences across various digital touchpoints such as websites, mobile apps, and social media channels. The decoupled architecture allows content creators and developers to work independently, enabling faster content updates, personalized product presentations, and swift adaptation to changing market trends. This flexibility ensures that E-commerce platforms can rapidly respond to consumer demands and industry shifts without being hindered by backend constraints.
Headless CMS Software Market Segmentation
By Type
By Application
- Hospitality
- Retail pharmacy
- E-Commerce
- Supermarkets and General stores
- Others
By Enterprise size
By Region
- North America (United States, Canada, Mexico)
- Europe (Germany, France, United Kingdom, Spain, Italy, Others)
- Asia Pacific (China, India, Japan, South Korea, Australia, Others)
- Latin America (Brazil, Argentina, Others)
- Middle East and Africa (Saudi Arabia, UAE, Kuwait, Other Middle East, South Africa, Nigeria, Other Africa)
Headless CMS Software Market Companies
- Storyblok (Europe)
- Sanity (United States)
- Contentful (United States)
- Strapi (France)
- Hygraph (Germany)
- Butter CMS (United States)
- Umbraco (Denmark)
- CloudCannon (New Zealand)
- Contentstack (United States)
- Agility CMS (Canada)
*List not exhaustive
Headless CMS Software Market Outlook 2023
1 Market Overview
1.1 Introduction to the Headless CMS Software Market
1.2 Scope of the Study
1.3 Research Objective
1.3.1 Key Market Scope and Segments
1.3.2 Players Covered
1.3.3 Years Considered
2 Executive Summary
2.1 2023 Headless CMS Software Industry- Market Statistics
3 Market Dynamics
3.1 Market Drivers
3.2 Market Challenges
3.3 Market Opportunities
3.4 Market Trends
4 Market Factor Analysis
4.1 Porter’s Five Forces
4.2 Market Entropy
4.2.1 Global Headless CMS Software Market Companies with Area Served
4.2.2 Products Offerings Global Headless CMS Software Market
5 COVID-19 Impact Analysis and Outlook Scenarios
5.1.1 Covid-19 Impact Analysis
5.1.2 post-COVID-19 Scenario- Low Growth Case
5.1.3 post-COVID-19 Scenario- Reference Growth Case
5.1.4 post-COVID-19 Scenario- Low Growth Case
6 Global Headless CMS Software Market Trends
6.1 Global Headless CMS Software Revenue (USD Million) and CAGR (%) by Type (2018-2030)
6.2 Global Headless CMS Software Revenue (USD Million) and CAGR (%) by Applications (2018-2030)
6.3 Global Headless CMS Software Revenue (USD Million) and CAGR (%) by regions (2018-2030)
7 Global Headless CMS Software Market Revenue (USD Million) by Type, and Applications (2018-2022)
7.1 Global Headless CMS Software Revenue (USD Million) by Type (2018-2022)
7.1.1 Global Headless CMS Software Revenue (USD Million), Market Share (%) by Type (2018-2022)
7.2 Global Headless CMS Software Revenue (USD Million) by Applications (2018-2022)
7.2.1 Global Headless CMS Software Revenue (USD Million), Market Share (%) by Applications (2018-2022)
8 Global Headless CMS Software Development Regional Status and Outlook
8.1 Global Headless CMS Software Revenue (USD Million) By Regions (2018-2022)
8.2 North America Headless CMS Software Revenue (USD Million) by Type, and Application (2018-2022)
8.2.1 North America Headless CMS Software Revenue (USD Million) by Country (2018-2022)
8.2.2 North America Headless CMS Software Revenue (USD Million) by Type (2018-2022)
8.2.3 North America Headless CMS Software Revenue (USD Million) by Applications (2018-2022)
8.3 Europe Headless CMS Software Revenue (USD Million), by Type, and Applications (USD Million) (2018-2022)
8.3.1 Europe Headless CMS Software Revenue (USD Million), by Country (2018-2022)
8.3.2 Europe Headless CMS Software Revenue (USD Million) by Type (2018-2022)
8.3.3 Europe Headless CMS Software Revenue (USD Million) by Applications (2018-2022)
8.4 Asia Pacific Headless CMS Software Revenue (USD Million), and Revenue (USD Million) by Type, and Applications (2018-2022)
8.4.1 Asia Pacific Headless CMS Software Revenue (USD Million) by Country (2018-2022)
8.4.2 Asia Pacific Headless CMS Software Revenue (USD Million) by Type (2018-2022)
8.4.3 Asia Pacific Headless CMS Software Revenue (USD Million) by Applications (2018-2022)
8.5 South America Headless CMS Software Revenue (USD Million), by Type, and Applications (2018-2022)
8.5.1 South America Headless CMS Software Revenue (USD Million), by Country (2018-2022)
8.5.2 South America Headless CMS Software Revenue (USD Million) by Type (2018-2022)
8.5.3 South America Headless CMS Software Revenue (USD Million) by Applications (2018-2022)
8.6 Middle East and Africa Headless CMS Software Revenue (USD Million), by Type, Technology, Application, Thickness (2018-2022)
8.6.1 Middle East and Africa Headless CMS Software Revenue (USD Million) by Country (2018-2022)
8.6.2 Middle East and Africa Headless CMS Software Revenue (USD Million) by Type (2018-2022)
8.6.3 Middle East and Africa Headless CMS Software Revenue (USD Million) by Applications (2018-2022)
9 Company Profiles
10 Global Headless CMS Software Market Revenue (USD Million), by Type, and Applications (2023-2030)
10.1 Global Headless CMS Software Revenue (USD Million) and Market Share (%) by Type (2023-2030)
10.1.1 Global Headless CMS Software Revenue (USD Million), and Market Share (%) by Type (2023-2030)
10.2 Global Headless CMS Software Revenue (USD Million) and Market Share (%) by Applications (2023-2030)
10.2.1 Global Headless CMS Software Revenue (USD Million), and Market Share (%) by Applications (2023-2030)
11 Global Headless CMS Software Development Regional Status and Outlook Forecast
11.1 Global Headless CMS Software Revenue (USD Million) By Regions (2023-2030)
11.2 North America Headless CMS Software Revenue (USD Million) by Type, and Applications (2023-2030)
11.2.1 North America Headless CMS Software Revenue (USD) Million by Country (2023-2030)
11.2.2 North America Headless CMS Software Revenue (USD Million), by Type (2023-2030)
11.2.3 North America Headless CMS Software Revenue (USD Million), Market Share (%) by Applications (2023-2030)
11.3 Europe Headless CMS Software Revenue (USD Million), by Type, and Applications (2023-2030)
11.3.1 Europe Headless CMS Software Revenue (USD Million), by Country (2023-2030)
11.3.2 Europe Headless CMS Software Revenue (USD Million), by Type (2023-2030)
11.3.3 Europe Headless CMS Software Revenue (USD Million), by Applications (2023-2030)
11.4 Asia Pacific Headless CMS Software Revenue (USD Million) by Type, and Applications (2023-2030)
11.4.1 Asia Pacific Headless CMS Software Revenue (USD Million), by Country (2023-2030)
11.4.2 Asia Pacific Headless CMS Software Revenue (USD Million), by Type (2023-2030)
11.4.3 Asia Pacific Headless CMS Software Revenue (USD Million), by Applications (2023-2030)
11.5 South America Headless CMS Software Revenue (USD Million), by Type, and Applications (2023-2030)
11.5.1 South America Headless CMS Software Revenue (USD Million), by Country (2023-2030)
11.5.2 South America Headless CMS Software Revenue (USD Million), by Type (2023-2030)
11.5.3 South America Headless CMS Software Revenue (USD Million), by Applications (2023-2030)
11.6 Middle East and Africa Headless CMS Software Revenue (USD Million), by Type, and Applications (2023-2030)
11.6.1 Middle East and Africa Headless CMS Software Revenue (USD Million), by region (2023-2030)
11.6.2 Middle East and Africa Headless CMS Software Revenue (USD Million), by Type (2023-2030)
11.6.3 Middle East and Africa Headless CMS Software Revenue (USD Million), by Applications (2023-2030)
12 Methodology and Data Sources
12.1 Methodology/Research Approach
12.1.1 Research Programs/Design
12.1.2 Market Size Estimation
12.1.3 Market Breakdown and Data Triangulation
12.2 Data Sources
12.2.1 Secondary Sources
12.2.2 Primary Sources
12.3 Disclaimer
List of Tables
Table 1 Market Segmentation Analysis
Table 2 Global Headless CMS Software Market Companies with Areas Served
Table 3 Products Offerings Global Headless CMS Software Market
Table 4 Low Growth Scenario Forecasts
Table 5 Reference Case Growth Scenario
Table 6 High Growth Case Scenario
Table 7 Global Headless CMS Software Revenue (USD Million) And CAGR (%) By Type (2018-2030)
Table 8 Global Headless CMS Software Revenue (USD Million) And CAGR (%) By Applications (2018-2030)
Table 9 Global Headless CMS Software Revenue (USD Million) And CAGR (%) By Regions (2018-2030)
Table 10 Global Headless CMS Software Revenue (USD Million) By Type (2018-2022)
Table 11 Global Headless CMS Software Revenue Market Share (%) By Type (2018-2022)
Table 12 Global Headless CMS Software Revenue (USD Million) By Applications (2018-2022)
Table 13 Global Headless CMS Software Revenue Market Share (%) By Applications (2018-2022)
Table 14 Global Headless CMS Software Market Revenue (USD Million) By Regions (2018-2022)
Table 15 Global Headless CMS Software Market Share (%) By Regions (2018-2022)
Table 16 North America Headless CMS Software Revenue (USD Million) By Country (2018-2022)
Table 17 North America Headless CMS Software Revenue (USD Million) By Type (2018-2022)
Table 18 North America Headless CMS Software Revenue (USD Million) By Applications (2018-2022)
Table 19 Europe Headless CMS Software Revenue (USD Million) By Country (2018-2022)
Table 20 Europe Headless CMS Software Revenue (USD Million) By Type (2018-2022)
Table 21 Europe Headless CMS Software Revenue (USD Million) By Applications (2018-2022)
Table 22 Asia Pacific Headless CMS Software Revenue (USD Million) By Country (2018-2022)
Table 23 Asia Pacific Headless CMS Software Revenue (USD Million) By Type (2018-2022)
Table 24 Asia Pacific Headless CMS Software Revenue (USD Million) By Applications (2018-2022)
Table 25 South America Headless CMS Software Revenue (USD Million) By Country (2018-2022)
Table 26 South America Headless CMS Software Revenue (USD Million) By Type (2018-2022)
Table 27 South America Headless CMS Software Revenue (USD Million) By Applications (2018-2022)
Table 28 Middle East and Africa Headless CMS Software Revenue (USD Million) By Region (2018-2022)
Table 29 Middle East and Africa Headless CMS Software Revenue (USD Million) By Type (2018-2022)
Table 30 Middle East and Africa Headless CMS Software Revenue (USD Million) By Applications (2018-2022)
Table 31 Financial Analysis
Table 32 Global Headless CMS Software Revenue (USD Million) By Type (2023-2030)
Table 33 Global Headless CMS Software Revenue Market Share (%) By Type (2023-2030)
Table 34 Global Headless CMS Software Revenue (USD Million) By Applications (2023-2030)
Table 35 Global Headless CMS Software Revenue Market Share (%) By Applications (2023-2030)
Table 36 Global Headless CMS Software Market Revenue (USD Million), And Revenue (USD Million) By Regions (2023-2030)
Table 37 North America Headless CMS Software Revenue (USD)By Country (2023-2030)
Table 38 North America Headless CMS Software Revenue (USD Million) By Type (2023-2030)
Table 39 North America Headless CMS Software Revenue (USD Million) By Applications (2023-2030)
Table 40 Europe Headless CMS Software Revenue (USD Million) By Country (2023-2030)
Table 41 Europe Headless CMS Software Revenue (USD Million) By Type (2023-2030)
Table 42 Europe Headless CMS Software Revenue (USD Million) By Applications (2023-2030)
Table 43 Asia Pacific Headless CMS Software Revenue (USD Million) By Country (2023-2030)
Table 44 Asia Pacific Headless CMS Software Revenue (USD Million) By Type (2023-2030)
Table 45 Asia Pacific Headless CMS Software Revenue (USD Million) By Applications (2023-2030)
Table 46 South America Headless CMS Software Revenue (USD Million) By Country (2023-2030)
Table 47 South America Headless CMS Software Revenue (USD Million) By Type (2023-2030)
Table 48 South America Headless CMS Software Revenue (USD Million) By Applications (2023-2030)
Table 49 Middle East and Africa Headless CMS Software Revenue (USD Million) By Region (2023-2030)
Table 50 Middle East and Africa Headless CMS Software Revenue (USD Million) By Region (2023-2030)
Table 51 Middle East and Africa Headless CMS Software Revenue (USD Million) By Type (2023-2030)
Table 52 Middle East and Africa Headless CMS Software Revenue (USD Million) By Applications (2023-2030)
Table 53 Research Programs/Design for This Report
Table 54 Key Data Information from Secondary Sources
Table 55 Key Data Information from Primary Sources
List of Figures
Figure 1 Market Scope
Figure 2 Porter’s Five Forces
Figure 3 Global Headless CMS Software Revenue (USD Million) By Type (2018-2022)
Figure 4 Global Headless CMS Software Revenue Market Share (%) By Type (2022)
Figure 5 Global Headless CMS Software Revenue (USD Million) By Applications (2018-2022)
Figure 6 Global Headless CMS Software Revenue Market Share (%) By Applications (2022)
Figure 7 Global Headless CMS Software Market Revenue (USD Million) By Regions (2018-2022)
Figure 8 Global Headless CMS Software Market Share (%) By Regions (2022)
Figure 9 North America Headless CMS Software Revenue (USD Million) By Country (2018-2022)
Figure 10 North America Headless CMS Software Revenue (USD Million) By Type (2018-2022)
Figure 11 North America Headless CMS Software Revenue (USD Million) By Applications (2018-2022)
Figure 12 Europe Headless CMS Software Revenue (USD Million) By Country (2018-2022)
Figure 13 Europe Headless CMS Software Revenue (USD Million) By Type (2018-2022)
Figure 14 Europe Headless CMS Software Revenue (USD Million) By Applications (2018-2022)
Figure 15 Asia Pacific Headless CMS Software Revenue (USD Million) By Country (2018-2022)
Figure 16 Asia Pacific Headless CMS Software Revenue (USD Million) By Type (2018-2022)
Figure 17 Asia Pacific Headless CMS Software Revenue (USD Million) By Applications (2018-2022)
Figure 18 South America Headless CMS Software Revenue (USD Million) By Country (2018-2022)
Figure 19 South America Headless CMS Software Revenue (USD Million) By Type (2018-2022)
Figure 20 South America Headless CMS Software Revenue (USD Million) By Applications (2018-2022)
Figure 21 Middle East and Africa Headless CMS Software Revenue (USD Million) By Region (2018-2022)
Figure 22 Middle East and Africa Headless CMS Software Revenue (USD Million) By Type (2018-2022)
Figure 23 Middle East and Africa Headless CMS Software Revenue (USD Million) By Applications (2018-2022)
Figure 24 Global Headless CMS Software Revenue (USD Million) By Type (2023-2030)
Figure 25 Global Headless CMS Software Revenue Market Share (%) By Type (2030)
Figure 26 Global Headless CMS Software Revenue (USD Million) By Applications (2023-2030)
Figure 27 Global Headless CMS Software Revenue Market Share (%) By Applications (2030)
Figure 28 Global Headless CMS Software Market Revenue (USD Million) By Regions (2023-2030)
Figure 29 North America Headless CMS Software Revenue (USD Million) By Country (2023-2030)
Figure 30 North America Headless CMS Software Revenue (USD Million) By Type (2023-2030)
Figure 31 North America Headless CMS Software Revenue (USD Million) By Applications (2023-2030)
Figure 32 Europe Headless CMS Software Revenue (USD Million) By Country (2023-2030)
Figure 33 Europe Headless CMS Software Revenue (USD Million) By Type (2023-2030)
Figure 34 Europe Headless CMS Software Revenue (USD Million) By Applications (2023-2030)
Figure 35 Asia Pacific Headless CMS Software Revenue (USD Million) By Country (2023-2030)
Figure 36 Asia Pacific Headless CMS Software Revenue (USD Million) By Type (2023-2030)
Figure 37 Asia Pacific Headless CMS Software Revenue (USD Million) By Applications (2023-2030)
Figure 38 South America Headless CMS Software Revenue (USD Million) By Country (2023-2030)
Figure 39 South America Headless CMS Software Revenue (USD Million) By Type (2023-2030)
Figure 40 South America Headless CMS Software Revenue (USD Million) By Applications (2023-2030)
Figure 41 Middle East and Africa Headless CMS Software Revenue (USD Million) By Region (2023-2030)
Figure 42 Middle East and Africa Headless CMS Software Revenue (USD Million) By Region (2023-2030)
Figure 43 Middle East and Africa Headless CMS Software Revenue (USD Million) By Type (2023-2030)
Figure 44 Middle East and Africa Headless CMS Software Revenue (USD Million) By Applications (2023-2030)
Figure 45 Bottom-Up and Top-Down Approaches for This Report
Figure 46 Data Triangulation
