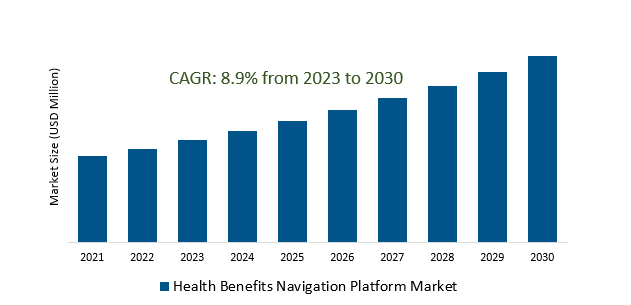
The Global Health Benefits Navigation Platform Market Size is estimated to register 8.9% growth over the forecast period from 2023 to 2030.
The market growth is driven by increasing Evolving data protection regulations and increased awareness of privacy concerns. Platforms are adapting to ensure compliance with healthcare regulations (such as HIPAA) and implementing advanced cybersecurity measures to safeguard sensitive health information, building trust among users. Leading Companies focusing on Global Expansion and Market Penetration, Blockchain Technology for Enhanced Security, Evolving Role in Chronic Disease Management, and others to boost market shares in the industry.
Market Overview
The Health Benefits Navigation Platform market is characterized by digital tools aiding individuals in understanding, managing, and optimizing health benefits. Key features include personalized guidance, decision-support tools, educational resources, and integrated telehealth services. Market drivers include the rise in healthcare costs, increased focus on employee well-being, and the broader digital transformation in healthcare. Trends involve AI-driven personalization, mental health integration, and emphasis on data security and compliance. The future scope includes global expansion, blockchain technology for enhanced security, and a focus on chronic disease management. Major players include technology firms and healthcare providers. Challenges include regulatory complexity and ensuring sustained user engagement. Overall, these platforms are pivotal in empowering individuals to make informed health decisions amid evolving healthcare landscapes.
Market Dynamics
Market Trends- Health benefits navigation platforms empower employees to make informed healthcare choices, effectively curbing rising healthcare costs.
Health benefits navigation platforms empower employees to make informed healthcare choices, effectively curbing rising healthcare costs. These platforms provide personalized guidance and decision-support tools, leveraging artificial intelligence for tailored recommendations. By facilitating better utilization of healthcare benefits and promoting preventive care, they contribute to improved overall employee well-being. As organizations seek cost-effective solutions amid escalating healthcare expenses, health benefits navigation platforms emerge as strategic tools for fostering informed and efficient approaches to employee healthcare.
Market Driver- The digital transformation of healthcare is fueling the demand for health benefits navigation platforms, as organizations seek to streamline benefit management and empower employees to make informed healthcare decisions.
The surge in healthcare's digital transformation is driving the demand for health benefits navigation platforms. Organizations are adopting these platforms to streamline benefit management and empower employees to make informed healthcare decisions. These solutions leverage digital technologies to simplify healthcare plans, aligning with the broader trend of technology's pivotal role in reshaping and optimizing the healthcare industry. The integration of health benefits navigation platforms reflects a strategic move towards greater efficiency, cost-effectiveness, and improvement in the overall employee experience within organizations.
Market Opportunity- Prioritizing employee experience and engagement is driving the development of innovative health benefits navigation platforms.
The drive to enhance employee experience and engagement is fueling the development of innovative health benefits navigation platforms. Organizations are prioritizing user-friendly interfaces and personalized guidance to actively involve employees in their healthcare decisions. These platforms aim to make navigating health benefits intuitive and beneficial, fostering a proactive approach to health management. As organizations seek to create employee-centric workplaces for satisfaction and retention, the evolution of health benefits navigation platforms reflects a strategic response to the growing importance of such solutions in the competitive labor market.
Market Share Analysis- Consulting the Health Benefits Navigation Platform Market will register the fastest growth
The Global Health Benefits Navigation Platform Market is analyzed across Consulting, Integration and Deployment, Support and Maintenance, and others. Consulting is poised to register the fastest growth. Navigating the Health Benefits Navigation Platform Market involves analyzing trends like AI integration and mental health support, understanding key drivers such as rising healthcare costs, assessing the competitive landscape, ensuring regulatory compliance, evaluating user experience, exploring technological integration, anticipating future market developments, gathering client feedback, implementing risk mitigation strategies, and conducting a cost-benefit analysis. The focus is on staying informed, adapting to emerging technologies, and addressing user needs to optimize the efficiency and effectiveness of these platforms in the dynamic healthcare landscape.
Market Share Analysis- Large Enterprises held a significant market share in 2023
The Global Health Benefits Navigation Platform Market is analyzed across various Organizations including SMEs, Large Enterprises, and others. Of these, Large Enterprises held a significant market share in 2023. The Health Benefits Navigation Platform Market is instrumental in optimizing employee benefits and navigating healthcare complexities. These platforms, equipped with advanced features like AI-driven personalization, streamline benefit management and promote informed decision-making. Catering to the diverse needs of a large workforce, they provide user-friendly interfaces, educational resources, and decision-support tools, empowering employees to make optimal use of health benefits. The primary goal is to enhance the overall employee experience, contributing to improved well-being and organizational effectiveness.
Health Benefits Navigation Platform Market Segmentation
By Type
- For Employers
- For Employees
By Organization Size
By Services
- Consulting
- Integration and Deployment
- Support and Maintenance
By Region
- North America (United States, Canada, Mexico)
- Europe (Germany, France, United Kingdom, Spain, Italy, Others)
- Asia Pacific (China, India, Japan, South Korea, Australia, Others)
- Latin America (Brazil, Argentina, Others)
- Middle East and Africa (Saudi Arabia, UAE, Kuwait, Other Middle East, South Africa, Nigeria, Other Africa)
Health Benefits Navigation Platform Market Companies
- Signify Health Inc (United Kingdom)
- Zava (Germany)
- Min Doktor (Sweden)
- Doctolib (France)
- KRY International AB (Sweden)
- Babylon Health (United Kingdom)
- mySugr (Austria)
- Grand Rounds Inc (United States)
- Samsung SDS Co Ltd (South Korea)
- Practo Technologies Pvt Ltd (India)
- JD Health International Inc (China)
- Accolade Inc (United States)
- Infermedica (Poland)
*List not exhaustive
Health Benefits Navigation Platform Market Outlook 2023
1 Market Overview
1.1 Introduction to the Health Benefits Navigation Platform Market
1.2 Scope of the Study
1.3 Research Objective
1.3.1 Key Market Scope and Segments
1.3.2 Players Covered
1.3.3 Years Considered
2 Executive Summary
2.1 2023 Health Benefits Navigation Platform Industry- Market Statistics
3 Market Dynamics
3.1 Market Drivers
3.2 Market Challenges
3.3 Market Opportunities
3.4 Market Trends
4 Market Factor Analysis
4.1 Porter’s Five Forces
4.2 Market Entropy
4.2.1 Global Health Benefits Navigation Platform Market Companies with Area Served
4.2.2 Products Offerings Global Health Benefits Navigation Platform Market
5 COVID-19 Impact Analysis and Outlook Scenarios
5.1.1 Covid-19 Impact Analysis
5.1.2 post-COVID-19 Scenario- Low Growth Case
5.1.3 post-COVID-19 Scenario- Reference Growth Case
5.1.4 post-COVID-19 Scenario- Low Growth Case
6 Global Health Benefits Navigation Platform Market Trends
6.1 Global Health Benefits Navigation Platform Revenue (USD Million) and CAGR (%) by Type (2018-2030)
6.2 Global Health Benefits Navigation Platform Revenue (USD Million) and CAGR (%) by Applications (2018-2030)
6.3 Global Health Benefits Navigation Platform Revenue (USD Million) and CAGR (%) by regions (2018-2030)
7 Global Health Benefits Navigation Platform Market Revenue (USD Million) by Type, and Applications (2018-2022)
7.1 Global Health Benefits Navigation Platform Revenue (USD Million) by Type (2018-2022)
7.1.1 Global Health Benefits Navigation Platform Revenue (USD Million), Market Share (%) by Type (2018-2022)
7.2 Global Health Benefits Navigation Platform Revenue (USD Million) by Applications (2018-2022)
7.2.1 Global Health Benefits Navigation Platform Revenue (USD Million), Market Share (%) by Applications (2018-2022)
8 Global Health Benefits Navigation Platform Development Regional Status and Outlook
8.1 Global Health Benefits Navigation Platform Revenue (USD Million) By Regions (2018-2022)
8.2 North America Health Benefits Navigation Platform Revenue (USD Million) by Type, and Application (2018-2022)
8.2.1 North America Health Benefits Navigation Platform Revenue (USD Million) by Country (2018-2022)
8.2.2 North America Health Benefits Navigation Platform Revenue (USD Million) by Type (2018-2022)
8.2.3 North America Health Benefits Navigation Platform Revenue (USD Million) by Applications (2018-2022)
8.3 Europe Health Benefits Navigation Platform Revenue (USD Million), by Type, and Applications (USD Million) (2018-2022)
8.3.1 Europe Health Benefits Navigation Platform Revenue (USD Million), by Country (2018-2022)
8.3.2 Europe Health Benefits Navigation Platform Revenue (USD Million) by Type (2018-2022)
8.3.3 Europe Health Benefits Navigation Platform Revenue (USD Million) by Applications (2018-2022)
8.4 Asia Pacific Health Benefits Navigation Platform Revenue (USD Million), and Revenue (USD Million) by Type, and Applications (2018-2022)
8.4.1 Asia Pacific Health Benefits Navigation Platform Revenue (USD Million) by Country (2018-2022)
8.4.2 Asia Pacific Health Benefits Navigation Platform Revenue (USD Million) by Type (2018-2022)
8.4.3 Asia Pacific Health Benefits Navigation Platform Revenue (USD Million) by Applications (2018-2022)
8.5 South America Health Benefits Navigation Platform Revenue (USD Million), by Type, and Applications (2018-2022)
8.5.1 South America Health Benefits Navigation Platform Revenue (USD Million), by Country (2018-2022)
8.5.2 South America Health Benefits Navigation Platform Revenue (USD Million) by Type (2018-2022)
8.5.3 South America Health Benefits Navigation Platform Revenue (USD Million) by Applications (2018-2022)
8.6 Middle East and Africa Health Benefits Navigation Platform Revenue (USD Million), by Type, Technology, Application, Thickness (2018-2022)
8.6.1 Middle East and Africa Health Benefits Navigation Platform Revenue (USD Million) by Country (2018-2022)
8.6.2 Middle East and Africa Health Benefits Navigation Platform Revenue (USD Million) by Type (2018-2022)
8.6.3 Middle East and Africa Health Benefits Navigation Platform Revenue (USD Million) by Applications (2018-2022)
9 Company Profiles
10 Global Health Benefits Navigation Platform Market Revenue (USD Million), by Type, and Applications (2023-2030)
10.1 Global Health Benefits Navigation Platform Revenue (USD Million) and Market Share (%) by Type (2023-2030)
10.1.1 Global Health Benefits Navigation Platform Revenue (USD Million), and Market Share (%) by Type (2023-2030)
10.2 Global Health Benefits Navigation Platform Revenue (USD Million) and Market Share (%) by Applications (2023-2030)
10.2.1 Global Health Benefits Navigation Platform Revenue (USD Million), and Market Share (%) by Applications (2023-2030)
11 Global Health Benefits Navigation Platform Development Regional Status and Outlook Forecast
11.1 Global Health Benefits Navigation Platform Revenue (USD Million) By Regions (2023-2030)
11.2 North America Health Benefits Navigation Platform Revenue (USD Million) by Type, and Applications (2023-2030)
11.2.1 North America Health Benefits Navigation Platform Revenue (USD) Million by Country (2023-2030)
11.2.2 North America Health Benefits Navigation Platform Revenue (USD Million), by Type (2023-2030)
11.2.3 North America Health Benefits Navigation Platform Revenue (USD Million), Market Share (%) by Applications (2023-2030)
11.3 Europe Health Benefits Navigation Platform Revenue (USD Million), by Type, and Applications (2023-2030)
11.3.1 Europe Health Benefits Navigation Platform Revenue (USD Million), by Country (2023-2030)
11.3.2 Europe Health Benefits Navigation Platform Revenue (USD Million), by Type (2023-2030)
11.3.3 Europe Health Benefits Navigation Platform Revenue (USD Million), by Applications (2023-2030)
11.4 Asia Pacific Health Benefits Navigation Platform Revenue (USD Million) by Type, and Applications (2023-2030)
11.4.1 Asia Pacific Health Benefits Navigation Platform Revenue (USD Million), by Country (2023-2030)
11.4.2 Asia Pacific Health Benefits Navigation Platform Revenue (USD Million), by Type (2023-2030)
11.4.3 Asia Pacific Health Benefits Navigation Platform Revenue (USD Million), by Applications (2023-2030)
11.5 South America Health Benefits Navigation Platform Revenue (USD Million), by Type, and Applications (2023-2030)
11.5.1 South America Health Benefits Navigation Platform Revenue (USD Million), by Country (2023-2030)
11.5.2 South America Health Benefits Navigation Platform Revenue (USD Million), by Type (2023-2030)
11.5.3 South America Health Benefits Navigation Platform Revenue (USD Million), by Applications (2023-2030)
11.6 Middle East and Africa Health Benefits Navigation Platform Revenue (USD Million), by Type, and Applications (2023-2030)
11.6.1 Middle East and Africa Health Benefits Navigation Platform Revenue (USD Million), by region (2023-2030)
11.6.2 Middle East and Africa Health Benefits Navigation Platform Revenue (USD Million), by Type (2023-2030)
11.6.3 Middle East and Africa Health Benefits Navigation Platform Revenue (USD Million), by Applications (2023-2030)
12 Methodology and Data Sources
12.1 Methodology/Research Approach
12.1.1 Research Programs/Design
12.1.2 Market Size Estimation
12.1.3 Market Breakdown and Data Triangulation
12.2 Data Sources
12.2.1 Secondary Sources
12.2.2 Primary Sources
12.3 Disclaimer
List of Tables
Table 1 Market Segmentation Analysis
Table 2 Global Health Benefits Navigation Platform Market Companies with Areas Served
Table 3 Products Offerings Global Health Benefits Navigation Platform Market
Table 4 Low Growth Scenario Forecasts
Table 5 Reference Case Growth Scenario
Table 6 High Growth Case Scenario
Table 7 Global Health Benefits Navigation Platform Revenue (USD Million) And CAGR (%) By Type (2018-2030)
Table 8 Global Health Benefits Navigation Platform Revenue (USD Million) And CAGR (%) By Applications (2018-2030)
Table 9 Global Health Benefits Navigation Platform Revenue (USD Million) And CAGR (%) By Regions (2018-2030)
Table 10 Global Health Benefits Navigation Platform Revenue (USD Million) By Type (2018-2022)
Table 11 Global Health Benefits Navigation Platform Revenue Market Share (%) By Type (2018-2022)
Table 12 Global Health Benefits Navigation Platform Revenue (USD Million) By Applications (2018-2022)
Table 13 Global Health Benefits Navigation Platform Revenue Market Share (%) By Applications (2018-2022)
Table 14 Global Health Benefits Navigation Platform Market Revenue (USD Million) By Regions (2018-2022)
Table 15 Global Health Benefits Navigation Platform Market Share (%) By Regions (2018-2022)
Table 16 North America Health Benefits Navigation Platform Revenue (USD Million) By Country (2018-2022)
Table 17 North America Health Benefits Navigation Platform Revenue (USD Million) By Type (2018-2022)
Table 18 North America Health Benefits Navigation Platform Revenue (USD Million) By Applications (2018-2022)
Table 19 Europe Health Benefits Navigation Platform Revenue (USD Million) By Country (2018-2022)
Table 20 Europe Health Benefits Navigation Platform Revenue (USD Million) By Type (2018-2022)
Table 21 Europe Health Benefits Navigation Platform Revenue (USD Million) By Applications (2018-2022)
Table 22 Asia Pacific Health Benefits Navigation Platform Revenue (USD Million) By Country (2018-2022)
Table 23 Asia Pacific Health Benefits Navigation Platform Revenue (USD Million) By Type (2018-2022)
Table 24 Asia Pacific Health Benefits Navigation Platform Revenue (USD Million) By Applications (2018-2022)
Table 25 South America Health Benefits Navigation Platform Revenue (USD Million) By Country (2018-2022)
Table 26 South America Health Benefits Navigation Platform Revenue (USD Million) By Type (2018-2022)
Table 27 South America Health Benefits Navigation Platform Revenue (USD Million) By Applications (2018-2022)
Table 28 Middle East and Africa Health Benefits Navigation Platform Revenue (USD Million) By Region (2018-2022)
Table 29 Middle East and Africa Health Benefits Navigation Platform Revenue (USD Million) By Type (2018-2022)
Table 30 Middle East and Africa Health Benefits Navigation Platform Revenue (USD Million) By Applications (2018-2022)
Table 31 Financial Analysis
Table 32 Global Health Benefits Navigation Platform Revenue (USD Million) By Type (2023-2030)
Table 33 Global Health Benefits Navigation Platform Revenue Market Share (%) By Type (2023-2030)
Table 34 Global Health Benefits Navigation Platform Revenue (USD Million) By Applications (2023-2030)
Table 35 Global Health Benefits Navigation Platform Revenue Market Share (%) By Applications (2023-2030)
Table 36 Global Health Benefits Navigation Platform Market Revenue (USD Million), And Revenue (USD Million) By Regions (2023-2030)
Table 37 North America Health Benefits Navigation Platform Revenue (USD)By Country (2023-2030)
Table 38 North America Health Benefits Navigation Platform Revenue (USD Million) By Type (2023-2030)
Table 39 North America Health Benefits Navigation Platform Revenue (USD Million) By Applications (2023-2030)
Table 40 Europe Health Benefits Navigation Platform Revenue (USD Million) By Country (2023-2030)
Table 41 Europe Health Benefits Navigation Platform Revenue (USD Million) By Type (2023-2030)
Table 42 Europe Health Benefits Navigation Platform Revenue (USD Million) By Applications (2023-2030)
Table 43 Asia Pacific Health Benefits Navigation Platform Revenue (USD Million) By Country (2023-2030)
Table 44 Asia Pacific Health Benefits Navigation Platform Revenue (USD Million) By Type (2023-2030)
Table 45 Asia Pacific Health Benefits Navigation Platform Revenue (USD Million) By Applications (2023-2030)
Table 46 South America Health Benefits Navigation Platform Revenue (USD Million) By Country (2023-2030)
Table 47 South America Health Benefits Navigation Platform Revenue (USD Million) By Type (2023-2030)
Table 48 South America Health Benefits Navigation Platform Revenue (USD Million) By Applications (2023-2030)
Table 49 Middle East and Africa Health Benefits Navigation Platform Revenue (USD Million) By Region (2023-2030)
Table 50 Middle East and Africa Health Benefits Navigation Platform Revenue (USD Million) By Region (2023-2030)
Table 51 Middle East and Africa Health Benefits Navigation Platform Revenue (USD Million) By Type (2023-2030)
Table 52 Middle East and Africa Health Benefits Navigation Platform Revenue (USD Million) By Applications (2023-2030)
Table 53 Research Programs/Design for This Report
Table 54 Key Data Information from Secondary Sources
Table 55 Key Data Information from Primary Sources
List of Figures
Figure 1 Market Scope
Figure 2 Porter’s Five Forces
Figure 3 Global Health Benefits Navigation Platform Revenue (USD Million) By Type (2018-2022)
Figure 4 Global Health Benefits Navigation Platform Revenue Market Share (%) By Type (2022)
Figure 5 Global Health Benefits Navigation Platform Revenue (USD Million) By Applications (2018-2022)
Figure 6 Global Health Benefits Navigation Platform Revenue Market Share (%) By Applications (2022)
Figure 7 Global Health Benefits Navigation Platform Market Revenue (USD Million) By Regions (2018-2022)
Figure 8 Global Health Benefits Navigation Platform Market Share (%) By Regions (2022)
Figure 9 North America Health Benefits Navigation Platform Revenue (USD Million) By Country (2018-2022)
Figure 10 North America Health Benefits Navigation Platform Revenue (USD Million) By Type (2018-2022)
Figure 11 North America Health Benefits Navigation Platform Revenue (USD Million) By Applications (2018-2022)
Figure 12 Europe Health Benefits Navigation Platform Revenue (USD Million) By Country (2018-2022)
Figure 13 Europe Health Benefits Navigation Platform Revenue (USD Million) By Type (2018-2022)
Figure 14 Europe Health Benefits Navigation Platform Revenue (USD Million) By Applications (2018-2022)
Figure 15 Asia Pacific Health Benefits Navigation Platform Revenue (USD Million) By Country (2018-2022)
Figure 16 Asia Pacific Health Benefits Navigation Platform Revenue (USD Million) By Type (2018-2022)
Figure 17 Asia Pacific Health Benefits Navigation Platform Revenue (USD Million) By Applications (2018-2022)
Figure 18 South America Health Benefits Navigation Platform Revenue (USD Million) By Country (2018-2022)
Figure 19 South America Health Benefits Navigation Platform Revenue (USD Million) By Type (2018-2022)
Figure 20 South America Health Benefits Navigation Platform Revenue (USD Million) By Applications (2018-2022)
Figure 21 Middle East and Africa Health Benefits Navigation Platform Revenue (USD Million) By Region (2018-2022)
Figure 22 Middle East and Africa Health Benefits Navigation Platform Revenue (USD Million) By Type (2018-2022)
Figure 23 Middle East and Africa Health Benefits Navigation Platform Revenue (USD Million) By Applications (2018-2022)
Figure 24 Global Health Benefits Navigation Platform Revenue (USD Million) By Type (2023-2030)
Figure 25 Global Health Benefits Navigation Platform Revenue Market Share (%) By Type (2030)
Figure 26 Global Health Benefits Navigation Platform Revenue (USD Million) By Applications (2023-2030)
Figure 27 Global Health Benefits Navigation Platform Revenue Market Share (%) By Applications (2030)
Figure 28 Global Health Benefits Navigation Platform Market Revenue (USD Million) By Regions (2023-2030)
Figure 29 North America Health Benefits Navigation Platform Revenue (USD Million) By Country (2023-2030)
Figure 30 North America Health Benefits Navigation Platform Revenue (USD Million) By Type (2023-2030)
Figure 31 North America Health Benefits Navigation Platform Revenue (USD Million) By Applications (2023-2030)
Figure 32 Europe Health Benefits Navigation Platform Revenue (USD Million) By Country (2023-2030)
Figure 33 Europe Health Benefits Navigation Platform Revenue (USD Million) By Type (2023-2030)
Figure 34 Europe Health Benefits Navigation Platform Revenue (USD Million) By Applications (2023-2030)
Figure 35 Asia Pacific Health Benefits Navigation Platform Revenue (USD Million) By Country (2023-2030)
Figure 36 Asia Pacific Health Benefits Navigation Platform Revenue (USD Million) By Type (2023-2030)
Figure 37 Asia Pacific Health Benefits Navigation Platform Revenue (USD Million) By Applications (2023-2030)
Figure 38 South America Health Benefits Navigation Platform Revenue (USD Million) By Country (2023-2030)
Figure 39 South America Health Benefits Navigation Platform Revenue (USD Million) By Type (2023-2030)
Figure 40 South America Health Benefits Navigation Platform Revenue (USD Million) By Applications (2023-2030)
Figure 41 Middle East and Africa Health Benefits Navigation Platform Revenue (USD Million) By Region (2023-2030)
Figure 42 Middle East and Africa Health Benefits Navigation Platform Revenue (USD Million) By Region (2023-2030)
Figure 43 Middle East and Africa Health Benefits Navigation Platform Revenue (USD Million) By Type (2023-2030)
Figure 44 Middle East and Africa Health Benefits Navigation Platform Revenue (USD Million) By Applications (2023-2030)
Figure 45 Bottom-Up and Top-Down Approaches for This Report
Figure 46 Data Triangulation
