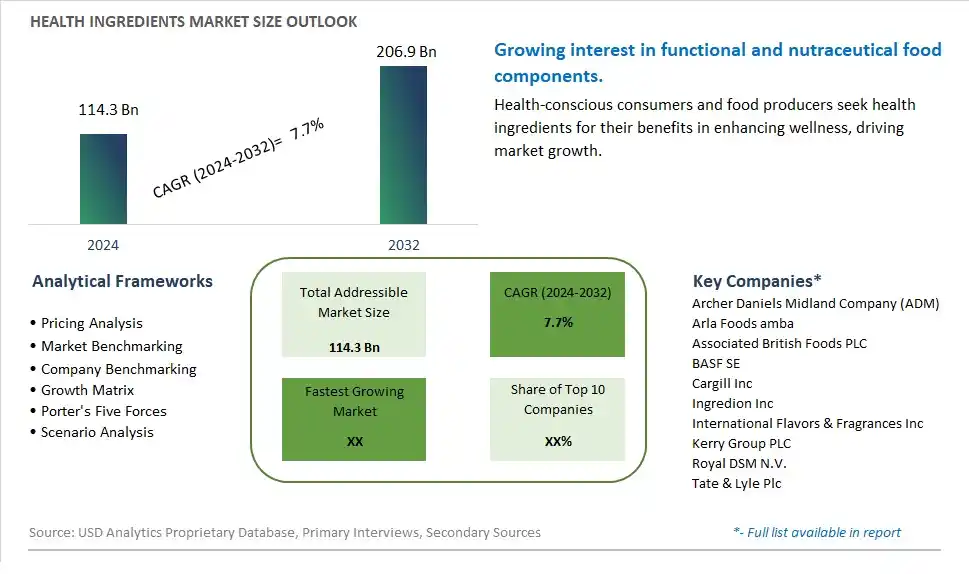
Global Health Ingredients Market Size is valued at $114.3 Billion in 2024 and is forecast to register a growth rate (CAGR) of 7.7% to reach $206.9 Billion by 2032.
The global Health Ingredients Market Comprehensive Study analyzes and forecasts the market size across 6 regions and 24 countries for diverse segments -By Type (Vitamins, Minerals, Probiotic starter cultures, Prebiotics, Plant & fruit extracts, Enzymes, Nutritional lipids, Functional carbohydrates, Proteins), By Application (Food, Beverages, Pharmaceuticals, Feed, Personal Care), By Source (Plant-based, Animal-based, Microbial-based., Others), By Function (Weight management, Immunity enhancement, Gut health management, Joint health management, Heart/Cardiovascular health management, Eye health management, Brain health management)
An Introduction to Health Ingredients Market
The health ingredients market in 2024 is experiencing robust growth, driven by increasing consumer demand for functional and fortified foods, rising awareness of preventive healthcare, and advancements in nutritional science. Health ingredients encompass a diverse range of bioactive compounds, vitamins, minerals, antioxidants, and botanical extracts that offer various health benefits, including immune support, cognitive enhancement, and metabolic health. With consumers prioritizing wellness and disease prevention, manufacturers are incorporating health ingredients into a wide array of food and beverage products, including supplements, functional beverages, snacks, and dairy alternatives. Moreover, strategic partnerships between health ingredient suppliers, food manufacturers, and healthcare professionals are fostering product innovation, market expansion, and consumer education initiatives. Additionally, advancements in ingredient sourcing, extraction techniques, and formulation technologies are enhancing the bioavailability and efficacy of health ingredients while ensuring product safety and quality. Furthermore, regulatory approvals and scientific endorsements substantiating the health claims of ingredients are reinforcing consumer trust and market credibility. Overall, the health ingredients market is poised for sustained growth as consumers increasingly seek foods and beverages that promote overall health and well-being.
Health Ingredients Competitive Landscape
The market report analyses the leading companies in the industry including Archer Daniels Midland Company (ADM), Arla Foods amba, Associated British Foods PLC, BASF SE, Cargill Inc, Ingredion Inc, International Flavors & Fragrances Inc, Kerry Group PLC, Royal DSM N.V., Tate & Lyle Plc, and Others.
Health Ingredients Market Dynamics
Health Ingredients Market Trend: Surge in Demand for Functional and Nutraceutical Products
One prominent trend in the health ingredients market is the surge in demand for functional and nutraceutical products. Consumers are increasingly seeking foods, beverages, and supplements that offer not just basic nutrition but also specific health benefits. This trend is driven by growing health consciousness, aging populations, and a desire for preventive healthcare solutions. As a result, there's a rising demand for health ingredients such as vitamins, minerals, antioxidants, and botanical extracts, which are incorporated into a wide range of products targeting various health concerns.
Market Driver: Shift Towards Personalized Nutrition and Wellness
A key driver in the health ingredients market is the shift towards personalized nutrition and wellness. With advancements in technology and understanding of genetics, consumers are embracing personalized approaches to diet and health. This trend is fueled by the rise of wearable devices, genetic testing kits, and health apps that provide insights into individual nutritional needs and health risks. As consumers seek tailored solutions to their unique health goals and concerns, there's a growing demand for customized formulations and ingredients that address specific nutritional deficiencies, lifestyle factors, and health conditions.
Market Opportunity: Innovation in Plant-Based and Sustainable Ingredients
An emerging opportunity in the health ingredients market lies in innovation in plant-based and sustainable ingredients. As environmental concerns and ethical considerations gain prominence, there's a growing preference for plant-based diets and sustainable sourcing practices. This presents an opportunity for manufacturers to develop health ingredients derived from plant sources such as fruits, vegetables, grains, and legumes. Additionally, there's increasing interest in sustainable production methods, such as regenerative agriculture and upcycling of food waste, to minimize environmental impact. By offering plant-based and sustainably sourced ingredients with proven health benefits, companies can cater to the growing demand for ethical and environmentally friendly products in the health and wellness sector.
Health Ingredients Market Share Analysis: Vitamins held the dominant market share in 2024
In the Health Ingredients Market, the Vitamins segment is the largest due to the essential role vitamins play in supporting overall health and well-being. Vitamins are micronutrients vital for various physiological functions, including metabolism, immune function, and cell growth. Their widespread popularity stems from consumer awareness of the importance of maintaining optimal vitamin levels to prevent deficiencies and promote vitality. Further, the convenience and versatility of vitamin supplements in various forms, including capsules, tablets, and fortified foods, contribute to their dominance in the market. Additionally, the growing trend of preventive healthcare and the desire for natural and clean label products drive the demand for vitamins derived from natural sources, further bolstering their market share. Furthermore, advancements in formulation technologies and the introduction of innovative delivery systems enhance the bioavailability and efficacy of vitamin supplements, consolidating their position as the largest segment in the Health Ingredients Market.
Health Ingredients Market Share Analysis: Personal Care market is poised to register the fastest growth rae over the forecast period to 2032
In the Health Ingredients Market, the Personal Care segment is the fastest-growing due to the increasing consumer demand for natural and functional ingredients in skincare, haircare, and personal hygiene products. Health ingredients such as botanical extracts, vitamins, minerals, and antioxidants offer numerous benefits for skin and hair health, including hydration, anti-aging, and protection against environmental stressors. The growing consumer awareness of the importance of self-care and wellness drives the demand for personal care products formulated with health-enhancing ingredients. Additionally, the rise of clean beauty and natural skincare trends further accelerates the adoption of health ingredients in personal care formulations. Further, advancements in formulation technologies and the development of innovative delivery systems enhance the efficacy and sensory experience of personal care products, attracting consumers seeking effective and indulgent skincare solutions. Furthermore, the expansion of distribution channels and marketing efforts promoting the benefits of health ingredients in personal care products contribute to their rapid growth in the market. Overall, the Personal Care segment's alignment with consumer preferences for natural, effective, and indulgent skincare products positions it as the fastest-growing segment in the Health Ingredients Market.
Health Ingredients Market Share Analysis: Plant-based held the dominant market share in 2024
In the Health Ingredients Market, the Plant-based segment is the largest due to the growing consumer preference for natural, sustainable, and plant-derived ingredients in food, beverages, supplements, and personal care products. Plant-based health ingredients, derived from sources such as fruits, vegetables, grains, and herbs, are rich in essential nutrients, phytochemicals, and antioxidants that support overall health and well-being. The increasing adoption of plant-based diets, driven by concerns for animal welfare, environmental sustainability, and personal health, fuels the demand for plant-based health ingredients across various industries. Additionally, the versatility of plant-based ingredients allows for their incorporation into a wide range of products, catering to diverse dietary preferences and lifestyle choices. Further, the perception of plant-based ingredients as clean label, non-allergenic, and environmentally friendly further contributes to their dominance in the market. Furthermore, technological advancements in ingredient extraction, processing, and formulation enhance the functionality, bioavailability, and sensory attributes of plant-based health ingredients, solidifying their position as the largest segment in the Health Ingredients Market.
Health Ingredients Market Segmentation
By Type
Vitamins
Minerals
Probiotic starter cultures
Prebiotics
Plant & fruit extracts
Enzymes
Nutritional lipids
Functional carbohydrates
Proteins
By Application
Food
Beverages
Pharmaceuticals
Feed
Personal Care
By Source
Plant-based
Animal-based
Microbial-based.
Others
By Function
Weight management
Immunity enhancement
Gut health management
Joint health management
Heart/Cardiovascular health management
Eye health management
Brain health management
Countries Analyzed
North America (US, Canada, Mexico)
Europe (Germany, UK, France, Spain, Italy, Russia, Rest of Europe)
Asia Pacific (China, India, Japan, South Korea, Australia, South East Asia, Rest of Asia)
South America (Brazil, Argentina, Rest of South America)
Middle East and Africa (Saudi Arabia, UAE, Rest of Middle East, South Africa, Egypt, Rest of Africa)
Health Ingredients Companies Profiled in the Study
Archer Daniels Midland Company (ADM)
Arla Foods amba
Associated British Foods PLC
BASF SE
Cargill Inc
Ingredion Inc
International Flavors & Fragrances Inc
Kerry Group PLC
Royal DSM N.V.
Tate & Lyle Plc
*- List Not Exhaustive
Chapter 1. TABLE OF CONTENTS
Chapter 2. Introduction to Health Ingredients Market
2.1. Market Overview
2.2. Key Statistics and Report Highlights
2.3. Scope of the Comprehensive Study
2.3.1. Market Definition
2.3.2 Countries and Regions Covered
2.3.3 Research Objective
2.3.4 Units, Currency, and Conversions
2.3.5 Industry Value Chain
2.4. Key Market Segments
2.5. Key Companies
2.6. Study Period
Chapter 3. Strategic Analysis Review
3.1. Health Ingredients Pricing Analysis and Forecast
3.2. Porter’s Five Forces
3.3. Market Ecosystem
3.4. SWOT Analysis
3.5. Regulatory Scenario
3.3. Effects of Inflation, Russia-Ukraine War, moderating economic growth, and other macroeconomic factors
Chapter 4. Competitive Landscape
4.1. Market Share Analysis
4.1.1. Global Health Ingredients Market Share by Company, 2023
4.1.2. Product Offerings of Leading Health Ingredients Companies
4.2. Market Entropy
4.2.1. New Product Launches in the Industry
4.2.2. Mergers, Acquisitions, Joint ventures, and Partnerships
4.3. Key Strategies and Best Practices
Chapter 5. Global Market Projections: Best, Reference, and Low Case Scenarios
5.1. Growth Analysis- Case Scenario Definitions
5.2. Low Growth Case Scenario Forecasts
5.3. Reference Growth Case Scenario Forecasts
5.4. High Growth Case Scenario Forecasts
Chapter 6. Market Dynamics
6.1. Health Ingredients Market Drivers
6.2. Health Ingredients Market Challenges
6.6. Health Ingredients Market Opportunities
6.4. Health Ingredients Market Trends
Chapter 7. Global Health Ingredients Market Outlook Trends
7.1. Global Health Ingredients Revenue (USD Million) and CAGR (%) by Type (2021-2032)
7.2. Global Health Ingredients Revenue (USD Million) and CAGR (%) by Application (2021-2032)
7.3. Global Health Ingredients Revenue (USD Million) and CAGR (%) by Product (2021-2032)
By Type
Vitamins
Minerals
Probiotic starter cultures
Prebiotics
Plant & fruit extracts
Enzymes
Nutritional lipids
Functional carbohydrates
Proteins
By Application
Food
Beverages
Pharmaceuticals
Feed
Personal Care
By Source
Plant-based
Animal-based
Microbial-based.
Others
By Function
Weight management
Immunity enhancement
Gut health management
Joint health management
Heart/Cardiovascular health management
Eye health management
Brain health management
Chapter 8. Global Health Ingredients Regional Analysis and Outlook
8.1. Global Health Ingredients Revenue (USD Million) By Regions (2021- 2032)
8.2. North America Health Ingredients Revenue (USD Million) by Country (2021-2032)
8.2.1. United States Health Ingredients Regional Analysis and Outlook
8.2.2. Canada Health Ingredients Regional Analysis and Outlook
8.2.3. Mexico Health Ingredients Regional Analysis and Outlook
8.3. Europe Health Ingredients Revenue (USD Million), by Country (2021-2032)
8.3.1. Germany Health Ingredients Regional Analysis and Outlook
8.3.2. France Health Ingredients Regional Analysis and Outlook
8.3.3. United Kingdom Health Ingredients Regional Analysis and Outlook
8.3.4. Spain Health Ingredients Regional Analysis and Outlook
8.3.5. Italy Health Ingredients Regional Analysis and Outlook
8.3.6. Russia Health Ingredients Regional Analysis and Outlook
8.3.7. Rest of Europe Health Ingredients Regional Analysis and Outlook
8.4. Asia Pacific Health Ingredients Revenue (USD Million) by Country (2021-2032)
8.4.1. China Health Ingredients Regional Analysis and Outlook
8.4.2. Japan Health Ingredients Regional Analysis and Outlook
8.4.3. India Health Ingredients Regional Analysis and Outlook
8.4.4. South Korea Health Ingredients Regional Analysis and Outlook
8.4.5. Australia Health Ingredients Regional Analysis and Outlook
8.4.6. South East Asia Health Ingredients Regional Analysis and Outlook
8.4.7. Rest of Asia Pacific Health Ingredients Regional Analysis and Outlook
8.5. South America Health Ingredients Revenue (USD Million), by Country (2021-2032)
8.5.1. Brazil Health Ingredients Regional Analysis and Outlook
8.5.2. Argentina Health Ingredients Regional Analysis and Outlook
8.5.3. Rest of South America Health Ingredients Regional Analysis and Outlook
8.6. Middle East and Africa Health Ingredients Revenue (USD Million) by Country (2021-2032)
8.6.1. Middle East Health Ingredients Regional Analysis and Outlook
8.6.2. Africa Health Ingredients Regional Analysis and Outlook
Chapter 9. North America Health Ingredients Analysis and Outlook
9.1. North America Health Ingredients Revenue (USD Million) by Segments (2021-2032)
9.1.1. North America Health Ingredients Revenue (USD Million) by Type (2021-2032)
9.1.2. North America Health Ingredients Revenue (USD Million) by Application (2021-2032)
9.1.3. North America Health Ingredients Revenue (USD Million) by Product (2021-2032)
By Type
Vitamins
Minerals
Probiotic starter cultures
Prebiotics
Plant & fruit extracts
Enzymes
Nutritional lipids
Functional carbohydrates
Proteins
By Application
Food
Beverages
Pharmaceuticals
Feed
Personal Care
By Source
Plant-based
Animal-based
Microbial-based.
Others
By Function
Weight management
Immunity enhancement
Gut health management
Joint health management
Heart/Cardiovascular health management
Eye health management
Brain health management
Chapter 10. Europe Health Ingredients Analysis and Outlook
10.1. Europe Health Ingredients Revenue (USD Million), by Segments (USD Million) (2021-2032)
10.1.1. Europe Health Ingredients Revenue (USD Million) by Type (2021-2032)
10.1.2. Europe Health Ingredients Revenue (USD Million) by Application (2021-2032)
10.1.3. Europe Health Ingredients Revenue (USD Million) by Product (2021-2032)
By Type
Vitamins
Minerals
Probiotic starter cultures
Prebiotics
Plant & fruit extracts
Enzymes
Nutritional lipids
Functional carbohydrates
Proteins
By Application
Food
Beverages
Pharmaceuticals
Feed
Personal Care
By Source
Plant-based
Animal-based
Microbial-based.
Others
By Function
Weight management
Immunity enhancement
Gut health management
Joint health management
Heart/Cardiovascular health management
Eye health management
Brain health management
Chapter 11. Asia Pacific Health Ingredients Analysis and Outlook
11.1. Asia Pacific Health Ingredients Revenue (USD Million), and Revenue (USD Million) by Segments (2021-2032)
11.1.1. Asia Pacific Health Ingredients Revenue (USD Million) by Type (2021-2032)
11.1.2. Asia Pacific Health Ingredients Revenue (USD Million) by Application (2021-2032)
11.1.3. Asia Pacific Health Ingredients Revenue (USD Million) by Product (2021-2032)
By Type
Vitamins
Minerals
Probiotic starter cultures
Prebiotics
Plant & fruit extracts
Enzymes
Nutritional lipids
Functional carbohydrates
Proteins
By Application
Food
Beverages
Pharmaceuticals
Feed
Personal Care
By Source
Plant-based
Animal-based
Microbial-based.
Others
By Function
Weight management
Immunity enhancement
Gut health management
Joint health management
Heart/Cardiovascular health management
Eye health management
Brain health management
Chapter 12. South America Health Ingredients Analysis and Outlook
12.1. South America Health Ingredients Revenue (USD Million), by Segments (2021-2032)
12.1.1. South America Health Ingredients Revenue (USD Million) by Type (2021-2032)
12.1.2. South America Health Ingredients Revenue (USD Million) by Application (2021-2032)
12.1.3. South America Health Ingredients Revenue (USD Million) by Product (2021-2032)
By Type
Vitamins
Minerals
Probiotic starter cultures
Prebiotics
Plant & fruit extracts
Enzymes
Nutritional lipids
Functional carbohydrates
Proteins
By Application
Food
Beverages
Pharmaceuticals
Feed
Personal Care
By Source
Plant-based
Animal-based
Microbial-based.
Others
By Function
Weight management
Immunity enhancement
Gut health management
Joint health management
Heart/Cardiovascular health management
Eye health management
Brain health management
Chapter 13. Middle East and Africa Health Ingredients Analysis and Outlook
13.1. Middle East and Africa Health Ingredients Revenue (USD Million), by Segments (2021-2032)
13.1.1. Middle East and Africa Health Ingredients Revenue (USD Million) by Type (2021-2032)
13.1.2. Middle East and Africa Health Ingredients Revenue (USD Million) by Application (2021-2032)
13.1.3. Middle East and Africa Health Ingredients Revenue (USD Million) by Product (2021-2032)
By Type
Vitamins
Minerals
Probiotic starter cultures
Prebiotics
Plant & fruit extracts
Enzymes
Nutritional lipids
Functional carbohydrates
Proteins
By Application
Food
Beverages
Pharmaceuticals
Feed
Personal Care
By Source
Plant-based
Animal-based
Microbial-based.
Others
By Function
Weight management
Immunity enhancement
Gut health management
Joint health management
Heart/Cardiovascular health management
Eye health management
Brain health management
Chapter 14. Health Ingredients Company Profiles
14.1 Business Overview
14.2 Product Profiles
14.3 SWOT Profiles
14.5 Recent Developments
14.6 Financial Profile
List of Companies
Archer Daniels Midland Company (ADM)
Arla Foods amba
Associated British Foods PLC
BASF SE
Cargill Inc
Ingredion Inc
International Flavors & Fragrances Inc
Kerry Group PLC
Royal DSM N.V.
Tate & Lyle Plc
15. Methodology and Data Sources
15.1 Customization Offerings
15.2 Subscription Services
15.3 Related Reports
15.4 Publisher Expertise
LIST OF TABLES
Table 1 Market Segmentation Analysis
Table 2 Global Health Ingredients Market Share of Leading Companies, 2023
Table 3 Product Offerings of Leading Companies
Table 4 Low Growth Scenario Forecasts
Table 5 Reference Case Growth Scenario
Table 6 High Growth Case Scenario
Table 7 Global Health Ingredients Revenue (USD Million) And CAGR (%) By Type (2021-2032)
Table 8 Global Health Ingredients Revenue (USD Million) And CAGR (%) By Application (2021-2032)
Table 9 Global Health Ingredients Revenue (USD Million) And CAGR (%) By Product (2021-2032)
Table 10 Global Health Ingredients Market Revenue (USD Million) By Regions (2021-2032)
Table 11 Global Health Ingredients Market Share (%) By Regions (2021-2032)
Table 12 North America Health Ingredients Revenue (USD Million) By Country (2021-2032)
Table 13 Europe Health Ingredients Revenue (USD Million) By Country (2021-2032)
Table 14 Asia Pacific Health Ingredients Revenue (USD Million) By Country (2021-2032)
Table 15 South America Health Ingredients Revenue (USD Million) By Country (2021-2032)
Table 16 Middle East and Africa Health Ingredients Revenue (USD Million) By Region (2021-2032)
Table 17 North America Health Ingredients Revenue (USD Million) By Type (2021-2032)
Table 18 North America Health Ingredients Revenue (USD Million) By Application (2021-2032)
Table 19 North America Health Ingredients Revenue (USD Million) By Product (2021-2032)
Table 20 Europe Health Ingredients Revenue (USD Million) By Type (2021-2032)
Table 21 Europe Health Ingredients Revenue (USD Million) By Application (2021-2032)
Table 22 Europe Health Ingredients Revenue (USD Million) By Product (2021-2032)
Table 23 Asia Pacific Health Ingredients Revenue (USD Million) By Type (2021-2032)
Table 24 Asia Pacific Health Ingredients Revenue (USD Million) By Application (2021-2032)
Table 25 Asia Pacific Health Ingredients Revenue (USD Million) By Product (2021-2032)
Table 26 South America Health Ingredients Revenue (USD Million) By Type (2021-2032)
Table 27 South America Health Ingredients Revenue (USD Million) By Application (2021-2032)
Table 28 South America Health Ingredients Revenue (USD Million) By Product (2021-2032)
Table 29 Middle East and Africa Health Ingredients Revenue (USD Million) By Type (2021-2032)
Table 30 Middle East and Africa Health Ingredients Revenue (USD Million) By Application (2021-2032)
Table 31 Middle East and Africa Health Ingredients Revenue (USD Million) By Product (2021-2032)
LIST OF FIGURES
Figure 1. Market Scope
Figure 2. Pricing Forecasts Per Unit, 2023- 2032
Figure 3. Porter’s Five Forces
Figure 4. Global Health Ingredients Market Revenue (USD Million) By Regions (2021-2032)
Figure 5. Global Health Ingredients Market Share (%) By Regions (2023)
Figure 6. North America Health Ingredients Revenue (USD Million) By Country (2021-2032)
Figure 7. United States Health Ingredients Revenue (USD Million) By Country (2021-2032)
Figure 8. Canada Health Ingredients Revenue (USD Million) By Country (2021-2032)
Figure 9. Mexico Health Ingredients Revenue (USD Million) By Country (2021-2032)
Figure 10. Europe Health Ingredients Revenue (USD Million) By Country (2021-2032)
Figure 11. Germany Health Ingredients Revenue (USD Million) By Country (2021-2032)
Figure 12. France Health Ingredients Revenue (USD Million) By Country (2021-2032)
Figure 13. United Kingdom Health Ingredients Revenue (USD Million) By Country (2021-2032)
Figure 14. Spain Health Ingredients Revenue (USD Million) By Country (2021-2032)
Figure 15. Italy Health Ingredients Revenue (USD Million) By Country (2021-2032)
Figure 16. Russia Health Ingredients Revenue (USD Million) By Country (2021-2032)
Figure 17. Rest of Europe Health Ingredients Revenue (USD Million) By Country (2021-2032)
Figure 11. Asia Pacific Health Ingredients Revenue (USD Million) By Country (2021-2032)
Figure 12. China Health Ingredients Revenue (USD Million) By Country (2021-2032)
Figure 13. Japan Health Ingredients Revenue (USD Million) By Country (2021-2032)
Figure 14. India Health Ingredients Revenue (USD Million) By Country (2021-2032)
Figure 15. South Korea Health Ingredients Revenue (USD Million) By Country (2021-2032)
Figure 16. Australia Health Ingredients Revenue (USD Million) By Country (2021-2032)
Figure 17. South East Asia Health Ingredients Revenue (USD Million) By Country (2021-2032)
Figure 18. South America Health Ingredients Revenue (USD Million) By Country (2021-2032)
Figure 19. Brazil Health Ingredients Revenue (USD Million) By Country (2021-2032)
Figure 20. Argentina Health Ingredients Revenue (USD Million) By Country (2021-2032)
Figure 21. Rest of Asia Pacific Health Ingredients Revenue (USD Million) By Country (2021-2032)
Figure 22. Middle East and Africa Health Ingredients Revenue (USD Million) By Region (2021-2032)
Figure 23. Saudi Arabia Health Ingredients Revenue (USD Million) By Region (2021-2032)
Figure 24. The UAE Health Ingredients Revenue (USD Million) By Region (2021-2032)
Figure 25. Rest of Middle East Health Ingredients Revenue (USD Million) By Region (2021-2032)
Figure 26. South Africa Health Ingredients Revenue (USD Million) By Region (2021-2032)
Figure 27. Africa Health Ingredients Revenue (USD Million) By Region (2021-2032)
Figure 28. North America Health Ingredients Revenue (USD Million) By Type (2021-2032)
Figure 29. North America Health Ingredients Revenue (USD Million) By Application (2021-2032)
Figure 30. North America Health Ingredients Revenue (USD Million) By Product (2021-2032)
Figure 31. Europe Health Ingredients Revenue (USD Million) By Type (2021-2032)
Figure 32. Europe Health Ingredients Revenue (USD Million) By Application (2021-2032)
Figure 33. Europe Health Ingredients Revenue (USD Million) By Product (2021-2032)
Figure 34. Asia Pacific Health Ingredients Revenue (USD Million) By Type (2021-2032)
Figure 35. Asia Pacific Health Ingredients Revenue (USD Million) By Application (2021-2032)
Figure 36. Asia Pacific Health Ingredients Revenue (USD Million) By Product (2021-2032)
Figure 37. South America Health Ingredients Revenue (USD Million) By Type (2021-2032)
Figure 38. South America Health Ingredients Revenue (USD Million) By Application (2021-2032)
Figure 39. South America Health Ingredients Revenue (USD Million) By Product (2021-2032)
Figure 40. Middle East and Africa Health Ingredients Revenue (USD Million) By Type (2021-2032)
Figure 41. Middle East and Africa Health Ingredients Revenue (USD Million) By Application (2021-2032)
Figure 42. Middle East and Africa Health Ingredients Revenue (USD Million) By Product (2021-2032)
By Type
Vitamins
Minerals
Probiotic starter cultures
Prebiotics
Plant & fruit extracts
Enzymes
Nutritional lipids
Functional carbohydrates
Proteins
By Application
Food
Beverages
Pharmaceuticals
Feed
Personal Care
By Source
Plant-based
Animal-based
Microbial-based.
Others
By Function
Weight management
Immunity enhancement
Gut health management
Joint health management
Heart/Cardiovascular health management
Eye health management
Brain health management
Countries Analyzed
North America (US, Canada, Mexico)
Europe (Germany, UK, France, Spain, Italy, Russia, Rest of Europe)
Asia Pacific (China, India, Japan, South Korea, Australia, South East Asia, Rest of Asia)
South America (Brazil, Argentina, Rest of South America)
Middle East and Africa (Saudi Arabia, UAE, Rest of Middle East, South Africa, Egypt, Rest of Africa)
