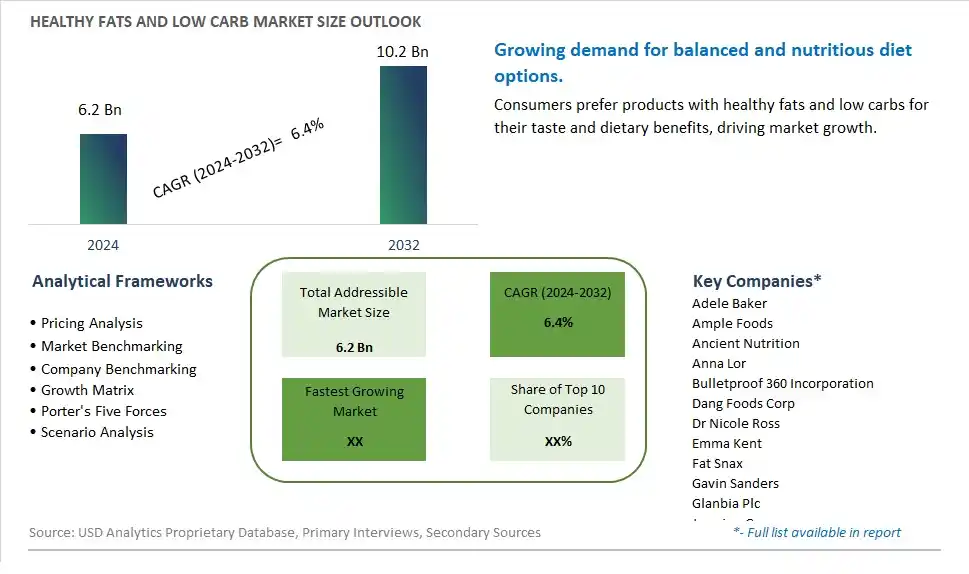
Global Healthy Fats and Low Carb Market Size is valued at $6.2 Billion in 2024 and is forecast to register a growth rate (CAGR) of 6.4% to reach $10.2 Billion by 2032.
The global Healthy Fats and Low Carb Market Comprehensive Study analyzes and forecasts the market size across 6 regions and 24 countries for diverse segments -By Source (Vegetables, Grains, Nuts, Fruits, Others), By Product (Soups, Snacks, Beverages, Frozen Foods, Others), By Distribution Channel (Supermarket/Hypermarket, Convenience stores, Specialty Stores, Online Stores, Others)
An Introduction to Healthy Fats and Low Carb Market
The Healthy Fats and Low Carb market in 2024 is thriving, fueled by the rising demand for diets that support weight management and metabolic health. Products rich in healthy fats, such as avocados and nuts, combined with low-carb formulations, cater to consumers following ketogenic and low-carb diets. The market benefits from advancements in food formulation and packaging technologies, the growing trend of health-conscious and functional foods, and the expansion of the global health food sector. Additionally, the increasing awareness of the benefits of healthy fats and low-carb diets for overall health and well-being is contributing to market growth.
Healthy Fats and Low Carb Competitive Landscape
The market report analyses the leading companies in the industry including Adele Baker, Ample Foods, Ancient Nutrition, Anna Lor, Bulletproof 360 Incorporation, Dang Foods Corp, Dr Nicole Ross, Emma Kent, Fat Snax, Gavin Sanders, Glanbia Plc, Jasmine Green, Kay's Natural, Nestlé SA, Pruvit Ventures Incorporation, Serena Green, The Good Fat Corp, and Others.
Healthy Fats and Low Carb Market Dynamics
Healthy Fats and Low Carb Market Trend: Increasing Popularity of Keto and Low-Carb Diets
The most prominent trend in the Healthy Fats and Low Carb Market is the increasing popularity of keto and low-carb diets. As consumers seek effective ways to manage their weight and improve their metabolic health, healthy fats and low-carb products are gaining traction for their ability to support these dietary preferences. This trend is driven by the growing interest in weight management and the desire for foods that align with specific dietary goals.
Healthy Fats and Low Carb Market Driver: Growth in Health and Wellness Consciousness
The key driver of the Healthy Fats and Low Carb Market is the growth in health and wellness consciousness. As more people focus on maintaining a balanced diet and improving their overall health, there is a higher demand for products that offer healthy fats and low carbohydrate content. This driver is supported by the trend towards clean-label products and the increasing availability of keto and low-carb options in the market, driving growth for this sector.
Healthy Fats and Low Carb Market Opportunity: Expansion into New Product Categories
A significant opportunity in the Healthy Fats and Low Carb Market lies in the expansion into new product categories. By developing innovative products that incorporate healthy fats and low-carb ingredients, such as snacks, beverages, and meal replacements, companies can attract health-conscious consumers. Offering high-quality products that provide multiple health benefits and cater to diverse dietary preferences can help expand market reach and drive growth in the functional food sector.
Healthy Fats and Low Carb Market Share Analysis: Nuts segment generated the highest revenue share in the industry
Nuts are the largest segment in the Healthy Fats and Low Carb Market by source. Nuts are rich in healthy fats, protein, and fiber, making them a popular choice for health-conscious consumers seeking nutritious snacks and ingredients for their diets. Almonds, walnuts, cashews, and other nuts are widely recognized for their benefits in supporting heart health, weight management, and overall wellness. The versatility of nuts allows them to be used in a variety of products, including snack bars, spreads, and dairy alternatives, further driving their demand. Additionally, the rise of plant-based and ketogenic diets has boosted the consumption of nuts as they are a natural source of healthy fats and low in carbohydrates. The availability of a wide range of nut-based products in supermarkets, specialty stores, and online platforms ensures their dominance in the market.
Healthy Fats and Low Carb Market Share Analysis: Snacks is the fastest growing segment over the forecast period to 2032
Snacks are the fastest-growing segment in the Healthy Fats and Low Carb Market by product, projected to see significant growth by 2032. The increasing demand for convenient and healthy snacking options is driving the growth of this segment. Consumers are looking for snacks that not only satisfy their cravings but also align with their health goals. Low carb and healthy fat snacks, such as nut-based bars, seeds, cheese crisps, and vegetable chips, are gaining popularity due to their nutritional benefits and ability to provide sustained energy. The rise of on-the-go lifestyles and the need for quick, nutritious options have further fueled the demand for healthy snacks. Innovations in product formulations and packaging are also contributing to the growth of this segment, offering consumers a wide variety of tasty and convenient snack choices that fit into their dietary preferences.
Healthy Fats and Low Carb Market Share Analysis: Supermarkets/Hypermarkets segment generated the highest revenue share in the industry
Supermarkets and hypermarkets are the largest segment in the Healthy Fats and Low Carb Market by distribution channel. These retail outlets dominate the market due to their extensive reach, convenience, and the wide variety of products they offer. Supermarkets and hypermarkets provide consumers with easy access to a broad range of healthy fat and low carb products, including nuts, snacks, beverages, and frozen foods. The ability to physically browse and compare products, coupled with the availability of in-store promotions and discounts, makes these stores a preferred shopping destination for health-conscious consumers. The trust and reliability associated with established supermarket and hypermarket chains also play a crucial role in their dominance. Additionally, the integration of health and wellness sections within these stores highlights their commitment to catering to the growing demand for nutritious and low-carb products, reinforcing their leading position in the market.
Healthy Fats and Low Carb Market Segmentation
By Source
Vegetables
Grains
Nuts
Fruits
Others
By Product
Soups
Snacks
Beverages
Frozen Foods
Others
By Distribution Channel
Supermarket/Hypermarket
Convenience stores
Specialty Stores
Online Stores
Others
Countries Analyzed
North America (US, Canada, Mexico)
Europe (Germany, UK, France, Spain, Italy, Russia, Rest of Europe)
Asia Pacific (China, India, Japan, South Korea, Australia, South East Asia, Rest of Asia)
South America (Brazil, Argentina, Rest of South America)
Middle East and Africa (Saudi Arabia, UAE, Rest of Middle East, South Africa, Egypt, Rest of Africa)
Healthy Fats and Low Carb Companies Profiled in the Study
Adele Baker
Ample Foods
Ancient Nutrition
Anna Lor
Bulletproof 360 Incorporation
Dang Foods Corp
Dr Nicole Ross
Emma Kent
Fat Snax
Gavin Sanders
Glanbia Plc
Jasmine Green
Kay's Natural
Nestlé SA
Pruvit Ventures Incorporation
Serena Green
The Good Fat Corp
*- List Not Exhaustive
Chapter 1. TABLE OF CONTENTS
Chapter 2. Introduction to Healthy Fats and Low Carb Market
2.1. Market Overview
2.2. Key Statistics and Report Highlights
2.3. Scope of the Comprehensive Study
2.3.1. Market Definition
2.3.2 Countries and Regions Covered
2.3.3 Research Objective
2.3.4 Units, Currency, and Conversions
2.3.5 Industry Value Chain
2.4. Key Market Segments
2.5. Key Companies
2.6. Study Period
Chapter 3. Strategic Analysis Review
3.1. Healthy Fats and Low Carb Pricing Analysis and Forecast
3.2. Porter’s Five Forces
3.3. Market Ecosystem
3.4. SWOT Analysis
3.5. Regulatory Scenario
3.3. Effects of Inflation, Russia-Ukraine War, moderating economic growth, and other macroeconomic factors
Chapter 4. Competitive Landscape
4.1. Market Share Analysis
4.1.1. Global Healthy Fats and Low Carb Market Share by Company, 2023
4.1.2. Product Offerings of Leading Healthy Fats and Low Carb Companies
4.2. Market Entropy
4.2.1. New Product Launches in the Industry
4.2.2. Mergers, Acquisitions, Joint ventures, and Partnerships
4.3. Key Strategies and Best Practices
Chapter 5. Global Market Projections: Best, Reference, and Low Case Scenarios
5.1. Growth Analysis- Case Scenario Definitions
5.2. Low Growth Case Scenario Forecasts
5.3. Reference Growth Case Scenario Forecasts
5.4. High Growth Case Scenario Forecasts
Chapter 6. Market Dynamics
6.1. Healthy Fats and Low Carb Market Drivers
6.2. Healthy Fats and Low Carb Market Challenges
6.6. Healthy Fats and Low Carb Market Opportunities
6.4. Healthy Fats and Low Carb Market Trends
Chapter 7. Global Healthy Fats and Low Carb Market Outlook Trends
7.1. Global Healthy Fats and Low Carb Revenue (USD Million) and CAGR (%) by Type (2021-2032)
7.2. Global Healthy Fats and Low Carb Revenue (USD Million) and CAGR (%) by Application (2021-2032)
7.3. Global Healthy Fats and Low Carb Revenue (USD Million) and CAGR (%) by Product (2021-2032)
By Source
Vegetables
Grains
Nuts
Fruits
Others
By Product
Soups
Snacks
Beverages
Frozen Foods
Others
By Distribution Channel
Supermarket/Hypermarket
Convenience stores
Specialty Stores
Online Stores
Others
Chapter 8. Global Healthy Fats and Low Carb Regional Analysis and Outlook
8.1. Global Healthy Fats and Low Carb Revenue (USD Million) By Regions (2021- 2032)
8.2. North America Healthy Fats and Low Carb Revenue (USD Million) by Country (2021-2032)
8.2.1. United States Healthy Fats and Low Carb Regional Analysis and Outlook
8.2.2. Canada Healthy Fats and Low Carb Regional Analysis and Outlook
8.2.3. Mexico Healthy Fats and Low Carb Regional Analysis and Outlook
8.3. Europe Healthy Fats and Low Carb Revenue (USD Million), by Country (2021-2032)
8.3.1. Germany Healthy Fats and Low Carb Regional Analysis and Outlook
8.3.2. France Healthy Fats and Low Carb Regional Analysis and Outlook
8.3.3. United Kingdom Healthy Fats and Low Carb Regional Analysis and Outlook
8.3.4. Spain Healthy Fats and Low Carb Regional Analysis and Outlook
8.3.5. Italy Healthy Fats and Low Carb Regional Analysis and Outlook
8.3.6. Russia Healthy Fats and Low Carb Regional Analysis and Outlook
8.3.7. Rest of Europe Healthy Fats and Low Carb Regional Analysis and Outlook
8.4. Asia Pacific Healthy Fats and Low Carb Revenue (USD Million) by Country (2021-2032)
8.4.1. China Healthy Fats and Low Carb Regional Analysis and Outlook
8.4.2. Japan Healthy Fats and Low Carb Regional Analysis and Outlook
8.4.3. India Healthy Fats and Low Carb Regional Analysis and Outlook
8.4.4. South Korea Healthy Fats and Low Carb Regional Analysis and Outlook
8.4.5. Australia Healthy Fats and Low Carb Regional Analysis and Outlook
8.4.6. South East Asia Healthy Fats and Low Carb Regional Analysis and Outlook
8.4.7. Rest of Asia Pacific Healthy Fats and Low Carb Regional Analysis and Outlook
8.5. South America Healthy Fats and Low Carb Revenue (USD Million), by Country (2021-2032)
8.5.1. Brazil Healthy Fats and Low Carb Regional Analysis and Outlook
8.5.2. Argentina Healthy Fats and Low Carb Regional Analysis and Outlook
8.5.3. Rest of South America Healthy Fats and Low Carb Regional Analysis and Outlook
8.6. Middle East and Africa Healthy Fats and Low Carb Revenue (USD Million) by Country (2021-2032)
8.6.1. Middle East Healthy Fats and Low Carb Regional Analysis and Outlook
8.6.2. Africa Healthy Fats and Low Carb Regional Analysis and Outlook
Chapter 9. North America Healthy Fats and Low Carb Analysis and Outlook
9.1. North America Healthy Fats and Low Carb Revenue (USD Million) by Segments (2021-2032)
9.1.1. North America Healthy Fats and Low Carb Revenue (USD Million) by Type (2021-2032)
9.1.2. North America Healthy Fats and Low Carb Revenue (USD Million) by Application (2021-2032)
9.1.3. North America Healthy Fats and Low Carb Revenue (USD Million) by Product (2021-2032)
By Source
Vegetables
Grains
Nuts
Fruits
Others
By Product
Soups
Snacks
Beverages
Frozen Foods
Others
By Distribution Channel
Supermarket/Hypermarket
Convenience stores
Specialty Stores
Online Stores
Others
Chapter 10. Europe Healthy Fats and Low Carb Analysis and Outlook
10.1. Europe Healthy Fats and Low Carb Revenue (USD Million), by Segments (USD Million) (2021-2032)
10.1.1. Europe Healthy Fats and Low Carb Revenue (USD Million) by Type (2021-2032)
10.1.2. Europe Healthy Fats and Low Carb Revenue (USD Million) by Application (2021-2032)
10.1.3. Europe Healthy Fats and Low Carb Revenue (USD Million) by Product (2021-2032)
By Source
Vegetables
Grains
Nuts
Fruits
Others
By Product
Soups
Snacks
Beverages
Frozen Foods
Others
By Distribution Channel
Supermarket/Hypermarket
Convenience stores
Specialty Stores
Online Stores
Others
Chapter 11. Asia Pacific Healthy Fats and Low Carb Analysis and Outlook
11.1. Asia Pacific Healthy Fats and Low Carb Revenue (USD Million), and Revenue (USD Million) by Segments (2021-2032)
11.1.1. Asia Pacific Healthy Fats and Low Carb Revenue (USD Million) by Type (2021-2032)
11.1.2. Asia Pacific Healthy Fats and Low Carb Revenue (USD Million) by Application (2021-2032)
11.1.3. Asia Pacific Healthy Fats and Low Carb Revenue (USD Million) by Product (2021-2032)
By Source
Vegetables
Grains
Nuts
Fruits
Others
By Product
Soups
Snacks
Beverages
Frozen Foods
Others
By Distribution Channel
Supermarket/Hypermarket
Convenience stores
Specialty Stores
Online Stores
Others
Chapter 12. South America Healthy Fats and Low Carb Analysis and Outlook
12.1. South America Healthy Fats and Low Carb Revenue (USD Million), by Segments (2021-2032)
12.1.1. South America Healthy Fats and Low Carb Revenue (USD Million) by Type (2021-2032)
12.1.2. South America Healthy Fats and Low Carb Revenue (USD Million) by Application (2021-2032)
12.1.3. South America Healthy Fats and Low Carb Revenue (USD Million) by Product (2021-2032)
By Source
Vegetables
Grains
Nuts
Fruits
Others
By Product
Soups
Snacks
Beverages
Frozen Foods
Others
By Distribution Channel
Supermarket/Hypermarket
Convenience stores
Specialty Stores
Online Stores
Others
Chapter 13. Middle East and Africa Healthy Fats and Low Carb Analysis and Outlook
13.1. Middle East and Africa Healthy Fats and Low Carb Revenue (USD Million), by Segments (2021-2032)
13.1.1. Middle East and Africa Healthy Fats and Low Carb Revenue (USD Million) by Type (2021-2032)
13.1.2. Middle East and Africa Healthy Fats and Low Carb Revenue (USD Million) by Application (2021-2032)
13.1.3. Middle East and Africa Healthy Fats and Low Carb Revenue (USD Million) by Product (2021-2032)
By Source
Vegetables
Grains
Nuts
Fruits
Others
By Product
Soups
Snacks
Beverages
Frozen Foods
Others
By Distribution Channel
Supermarket/Hypermarket
Convenience stores
Specialty Stores
Online Stores
Others
Chapter 14. Healthy Fats and Low Carb Company Profiles
14.1 Business Overview
14.2 Product Profiles
14.3 SWOT Profiles
14.5 Recent Developments
14.6 Financial Profile
List of Companies
Adele Baker
Ample Foods
Ancient Nutrition
Anna Lor
Bulletproof 360 Incorporation
Dang Foods Corp
Dr Nicole Ross
Emma Kent
Fat Snax
Gavin Sanders
Glanbia Plc
Jasmine Green
Kay's Natural
Nestlé SA
Pruvit Ventures Incorporation
Serena Green
The Good Fat Corp
15. Methodology and Data Sources
15.1 Customization Offerings
15.2 Subscription Services
15.3 Related Reports
15.4 Publisher Expertise
LIST OF TABLES
Table 1 Market Segmentation Analysis
Table 2 Global Healthy Fats and Low Carb Market Share of Leading Companies, 2023
Table 3 Product Offerings of Leading Companies
Table 4 Low Growth Scenario Forecasts
Table 5 Reference Case Growth Scenario
Table 6 High Growth Case Scenario
Table 7 Global Healthy Fats and Low Carb Revenue (USD Million) And CAGR (%) By Type (2021-2032)
Table 8 Global Healthy Fats and Low Carb Revenue (USD Million) And CAGR (%) By Application (2021-2032)
Table 9 Global Healthy Fats and Low Carb Revenue (USD Million) And CAGR (%) By Product (2021-2032)
Table 10 Global Healthy Fats and Low Carb Market Revenue (USD Million) By Regions (2021-2032)
Table 11 Global Healthy Fats and Low Carb Market Share (%) By Regions (2021-2032)
Table 12 North America Healthy Fats and Low Carb Revenue (USD Million) By Country (2021-2032)
Table 13 Europe Healthy Fats and Low Carb Revenue (USD Million) By Country (2021-2032)
Table 14 Asia Pacific Healthy Fats and Low Carb Revenue (USD Million) By Country (2021-2032)
Table 15 South America Healthy Fats and Low Carb Revenue (USD Million) By Country (2021-2032)
Table 16 Middle East and Africa Healthy Fats and Low Carb Revenue (USD Million) By Region (2021-2032)
Table 17 North America Healthy Fats and Low Carb Revenue (USD Million) By Type (2021-2032)
Table 18 North America Healthy Fats and Low Carb Revenue (USD Million) By Application (2021-2032)
Table 19 North America Healthy Fats and Low Carb Revenue (USD Million) By Product (2021-2032)
Table 20 Europe Healthy Fats and Low Carb Revenue (USD Million) By Type (2021-2032)
Table 21 Europe Healthy Fats and Low Carb Revenue (USD Million) By Application (2021-2032)
Table 22 Europe Healthy Fats and Low Carb Revenue (USD Million) By Product (2021-2032)
Table 23 Asia Pacific Healthy Fats and Low Carb Revenue (USD Million) By Type (2021-2032)
Table 24 Asia Pacific Healthy Fats and Low Carb Revenue (USD Million) By Application (2021-2032)
Table 25 Asia Pacific Healthy Fats and Low Carb Revenue (USD Million) By Product (2021-2032)
Table 26 South America Healthy Fats and Low Carb Revenue (USD Million) By Type (2021-2032)
Table 27 South America Healthy Fats and Low Carb Revenue (USD Million) By Application (2021-2032)
Table 28 South America Healthy Fats and Low Carb Revenue (USD Million) By Product (2021-2032)
Table 29 Middle East and Africa Healthy Fats and Low Carb Revenue (USD Million) By Type (2021-2032)
Table 30 Middle East and Africa Healthy Fats and Low Carb Revenue (USD Million) By Application (2021-2032)
Table 31 Middle East and Africa Healthy Fats and Low Carb Revenue (USD Million) By Product (2021-2032)
LIST OF FIGURES
Figure 1. Market Scope
Figure 2. Pricing Forecasts Per Unit, 2023- 2032
Figure 3. Porter’s Five Forces
Figure 4. Global Healthy Fats and Low Carb Market Revenue (USD Million) By Regions (2021-2032)
Figure 5. Global Healthy Fats and Low Carb Market Share (%) By Regions (2023)
Figure 6. North America Healthy Fats and Low Carb Revenue (USD Million) By Country (2021-2032)
Figure 7. United States Healthy Fats and Low Carb Revenue (USD Million) By Country (2021-2032)
Figure 8. Canada Healthy Fats and Low Carb Revenue (USD Million) By Country (2021-2032)
Figure 9. Mexico Healthy Fats and Low Carb Revenue (USD Million) By Country (2021-2032)
Figure 10. Europe Healthy Fats and Low Carb Revenue (USD Million) By Country (2021-2032)
Figure 11. Germany Healthy Fats and Low Carb Revenue (USD Million) By Country (2021-2032)
Figure 12. France Healthy Fats and Low Carb Revenue (USD Million) By Country (2021-2032)
Figure 13. United Kingdom Healthy Fats and Low Carb Revenue (USD Million) By Country (2021-2032)
Figure 14. Spain Healthy Fats and Low Carb Revenue (USD Million) By Country (2021-2032)
Figure 15. Italy Healthy Fats and Low Carb Revenue (USD Million) By Country (2021-2032)
Figure 16. Russia Healthy Fats and Low Carb Revenue (USD Million) By Country (2021-2032)
Figure 17. Rest of Europe Healthy Fats and Low Carb Revenue (USD Million) By Country (2021-2032)
Figure 11. Asia Pacific Healthy Fats and Low Carb Revenue (USD Million) By Country (2021-2032)
Figure 12. China Healthy Fats and Low Carb Revenue (USD Million) By Country (2021-2032)
Figure 13. Japan Healthy Fats and Low Carb Revenue (USD Million) By Country (2021-2032)
Figure 14. India Healthy Fats and Low Carb Revenue (USD Million) By Country (2021-2032)
Figure 15. South Korea Healthy Fats and Low Carb Revenue (USD Million) By Country (2021-2032)
Figure 16. Australia Healthy Fats and Low Carb Revenue (USD Million) By Country (2021-2032)
Figure 17. South East Asia Healthy Fats and Low Carb Revenue (USD Million) By Country (2021-2032)
Figure 18. South America Healthy Fats and Low Carb Revenue (USD Million) By Country (2021-2032)
Figure 19. Brazil Healthy Fats and Low Carb Revenue (USD Million) By Country (2021-2032)
Figure 20. Argentina Healthy Fats and Low Carb Revenue (USD Million) By Country (2021-2032)
Figure 21. Rest of Asia Pacific Healthy Fats and Low Carb Revenue (USD Million) By Country (2021-2032)
Figure 22. Middle East and Africa Healthy Fats and Low Carb Revenue (USD Million) By Region (2021-2032)
Figure 23. Saudi Arabia Healthy Fats and Low Carb Revenue (USD Million) By Region (2021-2032)
Figure 24. The UAE Healthy Fats and Low Carb Revenue (USD Million) By Region (2021-2032)
Figure 25. Rest of Middle East Healthy Fats and Low Carb Revenue (USD Million) By Region (2021-2032)
Figure 26. South Africa Healthy Fats and Low Carb Revenue (USD Million) By Region (2021-2032)
Figure 27. Africa Healthy Fats and Low Carb Revenue (USD Million) By Region (2021-2032)
Figure 28. North America Healthy Fats and Low Carb Revenue (USD Million) By Type (2021-2032)
Figure 29. North America Healthy Fats and Low Carb Revenue (USD Million) By Application (2021-2032)
Figure 30. North America Healthy Fats and Low Carb Revenue (USD Million) By Product (2021-2032)
Figure 31. Europe Healthy Fats and Low Carb Revenue (USD Million) By Type (2021-2032)
Figure 32. Europe Healthy Fats and Low Carb Revenue (USD Million) By Application (2021-2032)
Figure 33. Europe Healthy Fats and Low Carb Revenue (USD Million) By Product (2021-2032)
Figure 34. Asia Pacific Healthy Fats and Low Carb Revenue (USD Million) By Type (2021-2032)
Figure 35. Asia Pacific Healthy Fats and Low Carb Revenue (USD Million) By Application (2021-2032)
Figure 36. Asia Pacific Healthy Fats and Low Carb Revenue (USD Million) By Product (2021-2032)
Figure 37. South America Healthy Fats and Low Carb Revenue (USD Million) By Type (2021-2032)
Figure 38. South America Healthy Fats and Low Carb Revenue (USD Million) By Application (2021-2032)
Figure 39. South America Healthy Fats and Low Carb Revenue (USD Million) By Product (2021-2032)
Figure 40. Middle East and Africa Healthy Fats and Low Carb Revenue (USD Million) By Type (2021-2032)
Figure 41. Middle East and Africa Healthy Fats and Low Carb Revenue (USD Million) By Application (2021-2032)
Figure 42. Middle East and Africa Healthy Fats and Low Carb Revenue (USD Million) By Product (2021-2032)
By Source
Vegetables
Grains
Nuts
Fruits
Others
By Product
Soups
Snacks
Beverages
Frozen Foods
Others
By Distribution Channel
Supermarket/Hypermarket
Convenience stores
Specialty Stores
Online Stores
Others
Countries Analyzed
North America (US, Canada, Mexico)
Europe (Germany, UK, France, Spain, Italy, Russia, Rest of Europe)
Asia Pacific (China, India, Japan, South Korea, Australia, South East Asia, Rest of Asia)
South America (Brazil, Argentina, Rest of South America)
Middle East and Africa (Saudi Arabia, UAE, Rest of Middle East, South Africa, Egypt, Rest of Africa)
