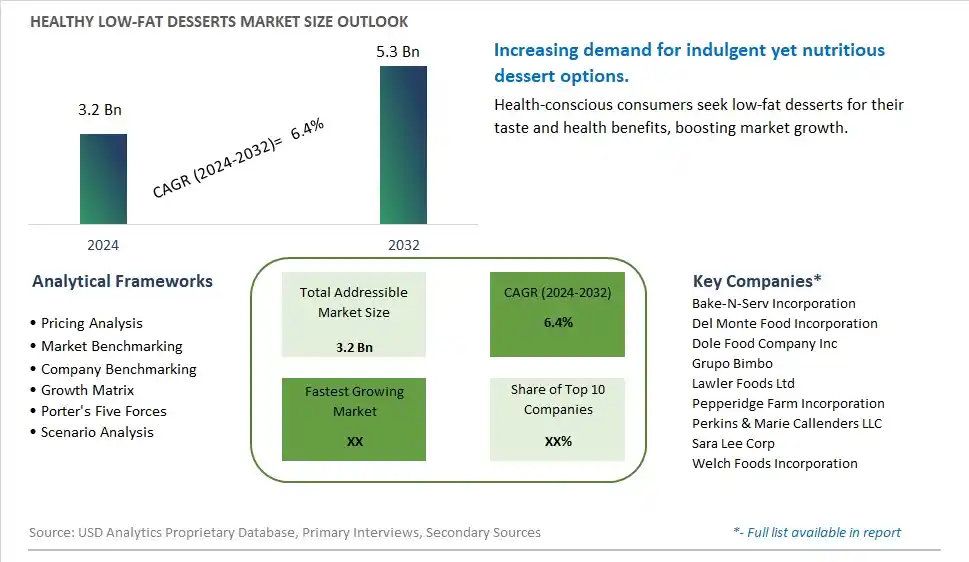
Global Healthy Low-Fat Desserts Market Size is valued at $3.2 Billion in 2024 and is forecast to register a growth rate (CAGR) of 6.4% to reach $5.3 Billion by 2032.
The global Healthy Low-Fat Desserts Market Comprehensive Study analyzes and forecasts the market size across 6 regions and 24 countries for diverse segments -By Product (Frozen Desserts, Bakery Desserts, Dairy-Based Desserts), By End-User (Household, Bakery, On Packaging, Bottles, Jars, Pouches), By Distribution Channel (Supermarket/Hypermarket, Convenience stores, Specialty Stores, Online Stores, Others)
An Introduction to Healthy Low-Fat Desserts Market
The Healthy Low-Fat Desserts Market involves the production and sale of desserts formulated with reduced fat content, catering to consumers seeking healthier and indulgent options. These desserts provide flavor and texture while minimizing calorie intake. The market is driven by increasing health consciousness, rising prevalence of obesity and related health conditions, and growing demand for low-fat and nutritious desserts. Additionally, innovations in dessert formulations and the expansion of product offerings support market growth.
Healthy Low Fat Desserts Competitive Landscape
The market report analyses the leading companies in the industry including Bake-N-Serv Incorporation, Del Monte Food Incorporation, Dole Food Company Inc, Grupo Bimbo, Lawler Foods Ltd, Pepperidge Farm Incorporation, Perkins & Marie Callenders LLC, Sara Lee Corp, Welch Foods Incorporation, and Others.
Healthy Low Fat Desserts Market Dynamics
Healthy Low-Fat Desserts Market Trend: Rising Demand for Healthier Dessert Options
The most prominent trend in the Healthy Low-Fat Desserts Market is the rising demand for healthier dessert options. As consumers seek to satisfy their sweet cravings without compromising on their health goals, low-fat desserts are gaining popularity for their ability to provide indulgence with reduced fat content. This trend is driven by the increasing interest in health and wellness and the desire for desserts that offer nutritional benefits.
Healthy Low-Fat Desserts Market Driver: Increase in Health and Wellness Consciousness
The key driver of the Healthy Low-Fat Desserts Market is the increase in health and wellness consciousness. As more people focus on maintaining a balanced diet and reducing their fat intake, there is a higher demand for desserts that offer essential nutrients and are free from unhealthy fats. This driver is supported by the trend towards clean-label products and the increasing availability of healthy dessert options in the market, driving growth for this sector.
Healthy Low-Fat Desserts Market Opportunity: Innovation in Dessert Formulations and Flavors
A significant opportunity in the Healthy Low-Fat Desserts Market lies in innovation in dessert formulations and flavors. By developing new and unique low-fat desserts that incorporate natural ingredients and offer diverse flavors, companies can attract health-conscious consumers. Offering high-quality low-fat desserts that cater to different taste preferences and dietary needs can help expand market reach and drive growth in the healthy dessert sector.
Healthy Low-Fat Desserts Market Share Analysis- Largest Segment by Product
The Frozen Desserts segment is the largest in the Healthy Low-Fat Desserts Market by product. This dominance is driven by the high consumer demand for frozen treats that offer a satisfying and indulgent experience without the high fat content. Frozen desserts, such as low-fat ice cream, sorbet, and frozen yogurt, are popular for their refreshing taste and convenience. The continuous innovation in frozen dessert formulations, including the introduction of new flavors, low-sugar options, and added nutritional benefits, enhances their appeal. Additionally, the growing trend of health and wellness supports the significant market share of the frozen desserts segment, as consumers seek healthier alternatives to traditional high-fat frozen treats. The extensive availability of low-fat frozen desserts in supermarkets, specialty stores, and online platforms further boosts their accessibility to a broad consumer base. The strong consumer preference for indulgent yet healthy frozen treats reinforces the dominant position of the frozen desserts segment in the market.
Healthy Low-Fat Desserts Market Share Analysis- Fastest Growing Segment by End-User
The Household segment is poised to grow the fastest in the Healthy Low-Fat Desserts Market by end-user over the next five years. This rapid growth is driven by the increasing consumer preference for preparing and consuming healthy low-fat desserts at home. The convenience of having low-fat dessert options readily available for home consumption appeals to a broad range of consumers, from health-conscious individuals to families. The continuous innovation in home-friendly dessert products, including ready-to-eat and easy-to-prepare options, enhances their appeal. Additionally, the growing trend of home cooking and the increasing availability of low-fat dessert recipes and ingredients support the fast growth of the household segment. The influence of health and wellness trends and the increasing awareness of the benefits of homemade and controlled-ingredient desserts contribute to the rapid growth of this segment.
Healthy Low-Fat Desserts Market Share Analysis- Largest Segment by Distribution Channel
The Supermarket/Hypermarket segment is the largest in the Healthy Low-Fat Desserts Market by distribution channel. This dominance is driven by the high consumer preference for purchasing food products from supermarkets and hypermarkets due to their convenience, wide product selection, and competitive pricing. Supermarkets and hypermarkets offer an extensive range of healthy low-fat desserts, including popular brands and private labels, catering to diverse consumer needs. The continuous innovation in product displays, promotional activities, and in-store experiences enhances the appeal of supermarkets and hypermarkets as preferred shopping destinations for desserts. Additionally, the growing trend of one-stop shopping and the increasing availability of healthy low-fat desserts in the frozen and refrigerated sections of supermarkets and hypermarkets support their significant market share. The strong consumer preference for convenience and variety reinforces the dominant position of the supermarket/hypermarket segment in the market.
Healthy Low Fat Desserts Market Segmentation
By Product
Frozen Desserts
Bakery Desserts
Dairy-Based Desserts
By End-User
Household
Bakery
On Packaging
Bottles
Jars
Pouches
By Distribution Channel
Supermarket/Hypermarket
Convenience stores
Specialty Stores
Online Stores
Others
Countries Analyzed
North America (US, Canada, Mexico)
Europe (Germany, UK, France, Spain, Italy, Russia, Rest of Europe)
Asia Pacific (China, India, Japan, South Korea, Australia, South East Asia, Rest of Asia)
South America (Brazil, Argentina, Rest of South America)
Middle East and Africa (Saudi Arabia, UAE, Rest of Middle East, South Africa, Egypt, Rest of Africa)
Healthy Low Fat Desserts Companies Profiled in the Study
Bake-N-Serv Incorporation
Del Monte Food Incorporation
Dole Food Company Inc
Grupo Bimbo
Lawler Foods Ltd
Pepperidge Farm Incorporation
Perkins & Marie Callenders LLC
Sara Lee Corp
Welch Foods Incorporation
*- List Not Exhaustive
Chapter 1. TABLE OF CONTENTS
Chapter 2. Introduction to Healthy Low Fat Desserts Market
2.1. Market Overview
2.2. Key Statistics and Report Highlights
2.3. Scope of the Comprehensive Study
2.3.1. Market Definition
2.3.2 Countries and Regions Covered
2.3.3 Research Objective
2.3.4 Units, Currency, and Conversions
2.3.5 Industry Value Chain
2.4. Key Market Segments
2.5. Key Companies
2.6. Study Period
Chapter 3. Strategic Analysis Review
3.1. Healthy Low Fat Desserts Pricing Analysis and Forecast
3.2. Porter’s Five Forces
3.3. Market Ecosystem
3.4. SWOT Analysis
3.5. Regulatory Scenario
3.3. Effects of Inflation, Russia-Ukraine War, moderating economic growth, and other macroeconomic factors
Chapter 4. Competitive Landscape
4.1. Market Share Analysis
4.1.1. Global Healthy Low Fat Desserts Market Share by Company, 2023
4.1.2. Product Offerings of Leading Healthy Low Fat Desserts Companies
4.2. Market Entropy
4.2.1. New Product Launches in the Industry
4.2.2. Mergers, Acquisitions, Joint ventures, and Partnerships
4.3. Key Strategies and Best Practices
Chapter 5. Global Market Projections: Best, Reference, and Low Case Scenarios
5.1. Growth Analysis- Case Scenario Definitions
5.2. Low Growth Case Scenario Forecasts
5.3. Reference Growth Case Scenario Forecasts
5.4. High Growth Case Scenario Forecasts
Chapter 6. Market Dynamics
6.1. Healthy Low Fat Desserts Market Drivers
6.2. Healthy Low Fat Desserts Market Challenges
6.6. Healthy Low Fat Desserts Market Opportunities
6.4. Healthy Low Fat Desserts Market Trends
Chapter 7. Global Healthy Low Fat Desserts Market Outlook Trends
7.1. Global Healthy Low Fat Desserts Revenue (USD Million) and CAGR (%) by Type (2021-2032)
7.2. Global Healthy Low Fat Desserts Revenue (USD Million) and CAGR (%) by Application (2021-2032)
7.3. Global Healthy Low Fat Desserts Revenue (USD Million) and CAGR (%) by Product (2021-2032)
By Product
Frozen Desserts
Bakery Desserts
Dairy-Based Desserts
By End-User
Household
Bakery
On Packaging
Bottles
Jars
Pouches
By Distribution Channel
Supermarket/Hypermarket
Convenience stores
Specialty Stores
Online Stores
Others
Chapter 8. Global Healthy Low Fat Desserts Regional Analysis and Outlook
8.1. Global Healthy Low Fat Desserts Revenue (USD Million) By Regions (2021- 2032)
8.2. North America Healthy Low Fat Desserts Revenue (USD Million) by Country (2021-2032)
8.2.1. United States Healthy Low Fat Desserts Regional Analysis and Outlook
8.2.2. Canada Healthy Low Fat Desserts Regional Analysis and Outlook
8.2.3. Mexico Healthy Low Fat Desserts Regional Analysis and Outlook
8.3. Europe Healthy Low Fat Desserts Revenue (USD Million), by Country (2021-2032)
8.3.1. Germany Healthy Low Fat Desserts Regional Analysis and Outlook
8.3.2. France Healthy Low Fat Desserts Regional Analysis and Outlook
8.3.3. United Kingdom Healthy Low Fat Desserts Regional Analysis and Outlook
8.3.4. Spain Healthy Low Fat Desserts Regional Analysis and Outlook
8.3.5. Italy Healthy Low Fat Desserts Regional Analysis and Outlook
8.3.6. Russia Healthy Low Fat Desserts Regional Analysis and Outlook
8.3.7. Rest of Europe Healthy Low Fat Desserts Regional Analysis and Outlook
8.4. Asia Pacific Healthy Low Fat Desserts Revenue (USD Million) by Country (2021-2032)
8.4.1. China Healthy Low Fat Desserts Regional Analysis and Outlook
8.4.2. Japan Healthy Low Fat Desserts Regional Analysis and Outlook
8.4.3. India Healthy Low Fat Desserts Regional Analysis and Outlook
8.4.4. South Korea Healthy Low Fat Desserts Regional Analysis and Outlook
8.4.5. Australia Healthy Low Fat Desserts Regional Analysis and Outlook
8.4.6. South East Asia Healthy Low Fat Desserts Regional Analysis and Outlook
8.4.7. Rest of Asia Pacific Healthy Low Fat Desserts Regional Analysis and Outlook
8.5. South America Healthy Low Fat Desserts Revenue (USD Million), by Country (2021-2032)
8.5.1. Brazil Healthy Low Fat Desserts Regional Analysis and Outlook
8.5.2. Argentina Healthy Low Fat Desserts Regional Analysis and Outlook
8.5.3. Rest of South America Healthy Low Fat Desserts Regional Analysis and Outlook
8.6. Middle East and Africa Healthy Low Fat Desserts Revenue (USD Million) by Country (2021-2032)
8.6.1. Middle East Healthy Low Fat Desserts Regional Analysis and Outlook
8.6.2. Africa Healthy Low Fat Desserts Regional Analysis and Outlook
Chapter 9. North America Healthy Low Fat Desserts Analysis and Outlook
9.1. North America Healthy Low Fat Desserts Revenue (USD Million) by Segments (2021-2032)
9.1.1. North America Healthy Low Fat Desserts Revenue (USD Million) by Type (2021-2032)
9.1.2. North America Healthy Low Fat Desserts Revenue (USD Million) by Application (2021-2032)
9.1.3. North America Healthy Low Fat Desserts Revenue (USD Million) by Product (2021-2032)
By Product
Frozen Desserts
Bakery Desserts
Dairy-Based Desserts
By End-User
Household
Bakery
On Packaging
Bottles
Jars
Pouches
By Distribution Channel
Supermarket/Hypermarket
Convenience stores
Specialty Stores
Online Stores
Others
Chapter 10. Europe Healthy Low Fat Desserts Analysis and Outlook
10.1. Europe Healthy Low Fat Desserts Revenue (USD Million), by Segments (USD Million) (2021-2032)
10.1.1. Europe Healthy Low Fat Desserts Revenue (USD Million) by Type (2021-2032)
10.1.2. Europe Healthy Low Fat Desserts Revenue (USD Million) by Application (2021-2032)
10.1.3. Europe Healthy Low Fat Desserts Revenue (USD Million) by Product (2021-2032)
By Product
Frozen Desserts
Bakery Desserts
Dairy-Based Desserts
By End-User
Household
Bakery
On Packaging
Bottles
Jars
Pouches
By Distribution Channel
Supermarket/Hypermarket
Convenience stores
Specialty Stores
Online Stores
Others
Chapter 11. Asia Pacific Healthy Low Fat Desserts Analysis and Outlook
11.1. Asia Pacific Healthy Low Fat Desserts Revenue (USD Million), and Revenue (USD Million) by Segments (2021-2032)
11.1.1. Asia Pacific Healthy Low Fat Desserts Revenue (USD Million) by Type (2021-2032)
11.1.2. Asia Pacific Healthy Low Fat Desserts Revenue (USD Million) by Application (2021-2032)
11.1.3. Asia Pacific Healthy Low Fat Desserts Revenue (USD Million) by Product (2021-2032)
By Product
Frozen Desserts
Bakery Desserts
Dairy-Based Desserts
By End-User
Household
Bakery
On Packaging
Bottles
Jars
Pouches
By Distribution Channel
Supermarket/Hypermarket
Convenience stores
Specialty Stores
Online Stores
Others
Chapter 12. South America Healthy Low Fat Desserts Analysis and Outlook
12.1. South America Healthy Low Fat Desserts Revenue (USD Million), by Segments (2021-2032)
12.1.1. South America Healthy Low Fat Desserts Revenue (USD Million) by Type (2021-2032)
12.1.2. South America Healthy Low Fat Desserts Revenue (USD Million) by Application (2021-2032)
12.1.3. South America Healthy Low Fat Desserts Revenue (USD Million) by Product (2021-2032)
By Product
Frozen Desserts
Bakery Desserts
Dairy-Based Desserts
By End-User
Household
Bakery
On Packaging
Bottles
Jars
Pouches
By Distribution Channel
Supermarket/Hypermarket
Convenience stores
Specialty Stores
Online Stores
Others
Chapter 13. Middle East and Africa Healthy Low Fat Desserts Analysis and Outlook
13.1. Middle East and Africa Healthy Low Fat Desserts Revenue (USD Million), by Segments (2021-2032)
13.1.1. Middle East and Africa Healthy Low Fat Desserts Revenue (USD Million) by Type (2021-2032)
13.1.2. Middle East and Africa Healthy Low Fat Desserts Revenue (USD Million) by Application (2021-2032)
13.1.3. Middle East and Africa Healthy Low Fat Desserts Revenue (USD Million) by Product (2021-2032)
By Product
Frozen Desserts
Bakery Desserts
Dairy-Based Desserts
By End-User
Household
Bakery
On Packaging
Bottles
Jars
Pouches
By Distribution Channel
Supermarket/Hypermarket
Convenience stores
Specialty Stores
Online Stores
Others
Chapter 14. Healthy Low Fat Desserts Company Profiles
14.1 Business Overview
14.2 Product Profiles
14.3 SWOT Profiles
14.5 Recent Developments
14.6 Financial Profile
List of Companies
Bake-N-Serv Incorporation
Del Monte Food Incorporation
Dole Food Company Inc
Grupo Bimbo
Lawler Foods Ltd
Pepperidge Farm Incorporation
Perkins & Marie Callenders LLC
Sara Lee Corp
Welch Foods Incorporation
15. Methodology and Data Sources
15.1 Customization Offerings
15.2 Subscription Services
15.3 Related Reports
15.4 Publisher Expertise
LIST OF TABLES
Table 1 Market Segmentation Analysis
Table 2 Global Healthy Low Fat Desserts Market Share of Leading Companies, 2023
Table 3 Product Offerings of Leading Companies
Table 4 Low Growth Scenario Forecasts
Table 5 Reference Case Growth Scenario
Table 6 High Growth Case Scenario
Table 7 Global Healthy Low Fat Desserts Revenue (USD Million) And CAGR (%) By Type (2021-2032)
Table 8 Global Healthy Low Fat Desserts Revenue (USD Million) And CAGR (%) By Application (2021-2032)
Table 9 Global Healthy Low Fat Desserts Revenue (USD Million) And CAGR (%) By Product (2021-2032)
Table 10 Global Healthy Low Fat Desserts Market Revenue (USD Million) By Regions (2021-2032)
Table 11 Global Healthy Low Fat Desserts Market Share (%) By Regions (2021-2032)
Table 12 North America Healthy Low Fat Desserts Revenue (USD Million) By Country (2021-2032)
Table 13 Europe Healthy Low Fat Desserts Revenue (USD Million) By Country (2021-2032)
Table 14 Asia Pacific Healthy Low Fat Desserts Revenue (USD Million) By Country (2021-2032)
Table 15 South America Healthy Low Fat Desserts Revenue (USD Million) By Country (2021-2032)
Table 16 Middle East and Africa Healthy Low Fat Desserts Revenue (USD Million) By Region (2021-2032)
Table 17 North America Healthy Low Fat Desserts Revenue (USD Million) By Type (2021-2032)
Table 18 North America Healthy Low Fat Desserts Revenue (USD Million) By Application (2021-2032)
Table 19 North America Healthy Low Fat Desserts Revenue (USD Million) By Product (2021-2032)
Table 20 Europe Healthy Low Fat Desserts Revenue (USD Million) By Type (2021-2032)
Table 21 Europe Healthy Low Fat Desserts Revenue (USD Million) By Application (2021-2032)
Table 22 Europe Healthy Low Fat Desserts Revenue (USD Million) By Product (2021-2032)
Table 23 Asia Pacific Healthy Low Fat Desserts Revenue (USD Million) By Type (2021-2032)
Table 24 Asia Pacific Healthy Low Fat Desserts Revenue (USD Million) By Application (2021-2032)
Table 25 Asia Pacific Healthy Low Fat Desserts Revenue (USD Million) By Product (2021-2032)
Table 26 South America Healthy Low Fat Desserts Revenue (USD Million) By Type (2021-2032)
Table 27 South America Healthy Low Fat Desserts Revenue (USD Million) By Application (2021-2032)
Table 28 South America Healthy Low Fat Desserts Revenue (USD Million) By Product (2021-2032)
Table 29 Middle East and Africa Healthy Low Fat Desserts Revenue (USD Million) By Type (2021-2032)
Table 30 Middle East and Africa Healthy Low Fat Desserts Revenue (USD Million) By Application (2021-2032)
Table 31 Middle East and Africa Healthy Low Fat Desserts Revenue (USD Million) By Product (2021-2032)
LIST OF FIGURES
Figure 1. Market Scope
Figure 2. Pricing Forecasts Per Unit, 2023- 2032
Figure 3. Porter’s Five Forces
Figure 4. Global Healthy Low Fat Desserts Market Revenue (USD Million) By Regions (2021-2032)
Figure 5. Global Healthy Low Fat Desserts Market Share (%) By Regions (2023)
Figure 6. North America Healthy Low Fat Desserts Revenue (USD Million) By Country (2021-2032)
Figure 7. United States Healthy Low Fat Desserts Revenue (USD Million) By Country (2021-2032)
Figure 8. Canada Healthy Low Fat Desserts Revenue (USD Million) By Country (2021-2032)
Figure 9. Mexico Healthy Low Fat Desserts Revenue (USD Million) By Country (2021-2032)
Figure 10. Europe Healthy Low Fat Desserts Revenue (USD Million) By Country (2021-2032)
Figure 11. Germany Healthy Low Fat Desserts Revenue (USD Million) By Country (2021-2032)
Figure 12. France Healthy Low Fat Desserts Revenue (USD Million) By Country (2021-2032)
Figure 13. United Kingdom Healthy Low Fat Desserts Revenue (USD Million) By Country (2021-2032)
Figure 14. Spain Healthy Low Fat Desserts Revenue (USD Million) By Country (2021-2032)
Figure 15. Italy Healthy Low Fat Desserts Revenue (USD Million) By Country (2021-2032)
Figure 16. Russia Healthy Low Fat Desserts Revenue (USD Million) By Country (2021-2032)
Figure 17. Rest of Europe Healthy Low Fat Desserts Revenue (USD Million) By Country (2021-2032)
Figure 11. Asia Pacific Healthy Low Fat Desserts Revenue (USD Million) By Country (2021-2032)
Figure 12. China Healthy Low Fat Desserts Revenue (USD Million) By Country (2021-2032)
Figure 13. Japan Healthy Low Fat Desserts Revenue (USD Million) By Country (2021-2032)
Figure 14. India Healthy Low Fat Desserts Revenue (USD Million) By Country (2021-2032)
Figure 15. South Korea Healthy Low Fat Desserts Revenue (USD Million) By Country (2021-2032)
Figure 16. Australia Healthy Low Fat Desserts Revenue (USD Million) By Country (2021-2032)
Figure 17. South East Asia Healthy Low Fat Desserts Revenue (USD Million) By Country (2021-2032)
Figure 18. South America Healthy Low Fat Desserts Revenue (USD Million) By Country (2021-2032)
Figure 19. Brazil Healthy Low Fat Desserts Revenue (USD Million) By Country (2021-2032)
Figure 20. Argentina Healthy Low Fat Desserts Revenue (USD Million) By Country (2021-2032)
Figure 21. Rest of Asia Pacific Healthy Low Fat Desserts Revenue (USD Million) By Country (2021-2032)
Figure 22. Middle East and Africa Healthy Low Fat Desserts Revenue (USD Million) By Region (2021-2032)
Figure 23. Saudi Arabia Healthy Low Fat Desserts Revenue (USD Million) By Region (2021-2032)
Figure 24. The UAE Healthy Low Fat Desserts Revenue (USD Million) By Region (2021-2032)
Figure 25. Rest of Middle East Healthy Low Fat Desserts Revenue (USD Million) By Region (2021-2032)
Figure 26. South Africa Healthy Low Fat Desserts Revenue (USD Million) By Region (2021-2032)
Figure 27. Africa Healthy Low Fat Desserts Revenue (USD Million) By Region (2021-2032)
Figure 28. North America Healthy Low Fat Desserts Revenue (USD Million) By Type (2021-2032)
Figure 29. North America Healthy Low Fat Desserts Revenue (USD Million) By Application (2021-2032)
Figure 30. North America Healthy Low Fat Desserts Revenue (USD Million) By Product (2021-2032)
Figure 31. Europe Healthy Low Fat Desserts Revenue (USD Million) By Type (2021-2032)
Figure 32. Europe Healthy Low Fat Desserts Revenue (USD Million) By Application (2021-2032)
Figure 33. Europe Healthy Low Fat Desserts Revenue (USD Million) By Product (2021-2032)
Figure 34. Asia Pacific Healthy Low Fat Desserts Revenue (USD Million) By Type (2021-2032)
Figure 35. Asia Pacific Healthy Low Fat Desserts Revenue (USD Million) By Application (2021-2032)
Figure 36. Asia Pacific Healthy Low Fat Desserts Revenue (USD Million) By Product (2021-2032)
Figure 37. South America Healthy Low Fat Desserts Revenue (USD Million) By Type (2021-2032)
Figure 38. South America Healthy Low Fat Desserts Revenue (USD Million) By Application (2021-2032)
Figure 39. South America Healthy Low Fat Desserts Revenue (USD Million) By Product (2021-2032)
Figure 40. Middle East and Africa Healthy Low Fat Desserts Revenue (USD Million) By Type (2021-2032)
Figure 41. Middle East and Africa Healthy Low Fat Desserts Revenue (USD Million) By Application (2021-2032)
Figure 42. Middle East and Africa Healthy Low Fat Desserts Revenue (USD Million) By Product (2021-2032)
By Product
Frozen Desserts
Bakery Desserts
Dairy-Based Desserts
By End-User
Household
Bakery
On Packaging
Bottles
Jars
Pouches
By Distribution Channel
Supermarket/Hypermarket
Convenience stores
Specialty Stores
Online Stores
Others
Countries Analyzed
North America (US, Canada, Mexico)
Europe (Germany, UK, France, Spain, Italy, Russia, Rest of Europe)
Asia Pacific (China, India, Japan, South Korea, Australia, South East Asia, Rest of Asia)
South America (Brazil, Argentina, Rest of South America)
Middle East and Africa (Saudi Arabia, UAE, Rest of Middle East, South Africa, Egypt, Rest of Africa)
