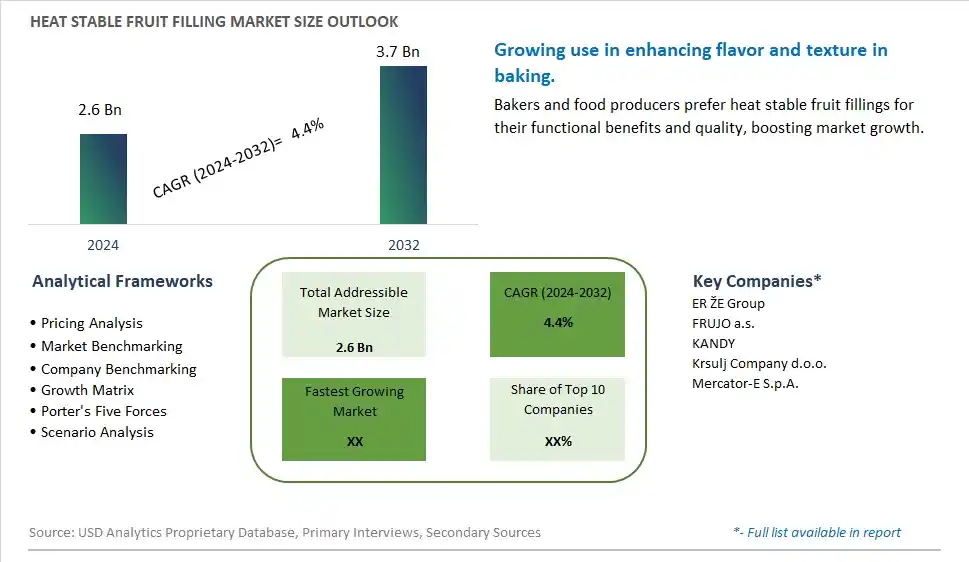
Global Heat Stable Fruit Filling Market Size is valued at $2.6 Billion in 2024 and is forecast to register a growth rate (CAGR) of 4.4% to reach $3.7 Billion by 2032.
The global Heat Stable Fruit Filling Market Comprehensive Study analyzes and forecasts the market size across 6 regions and 24 countries for diverse segments -By Type (Fillings with Fruit Pieces, Fillings without Fruit Pieces), By Application (Food Industry, Beverage Industry, Dairy Product Industry, Others)
An Introduction to Heat Stable Fruit Filling Market
In 2024, the Heat Stable Fruit Filling market is thriving, fueled by the rising demand for high-quality and versatile fruit fillings in baking and confectionery products. Heat stable fruit fillings, known for their ability to retain texture and flavor during baking, are popular in pies, pastries, and desserts. The market benefits from advancements in fruit processing and stabilization technologies, the growing trend of premium and artisanal baked goods, and the expansion of the global bakery sector. Additionally, the increasing focus on clean label and natural ingredients in fruit fillings is contributing to market growth.
Heat Stable Fruit Filling Competitive Landscape
The market report analyses the leading companies in the industry including ER ŽE Group, FRUJO a.s., KANDY, Krsulj Company d.o.o., Mercator-E S.p.A., and Others.
Heat Stable Fruit Filling Market Dynamics
Heat Stable Fruit Filling Market Trend: Growing Demand for Convenient and Versatile Ingredients
The most prominent trend in the Heat Stable Fruit Filling Market is the growing demand for convenient and versatile ingredients. As consumers and food manufacturers seek ingredients that offer convenience and high performance, heat stable fruit fillings are gaining popularity for their ability to withstand high temperatures without losing texture or flavor. This trend is driven by the increasing interest in premium and high-quality baked goods and desserts.
Heat Stable Fruit Filling Market Driver: Growth in the Bakery and Confectionery Industries
The key driver of the Heat Stable Fruit Filling Market is the growth in the bakery and confectionery industries. As more consumers indulge in baked goods and desserts, there is a higher demand for ingredients that enhance the quality and taste of these products. This driver is supported by the trend towards premiumization and the increasing use of heat stable fruit fillings in various bakery and confectionery applications, driving growth for this sector.
Heat Stable Fruit Filling Market Opportunity: Innovation in Fruit Filling Formulations and Applications
A significant opportunity in the Heat Stable Fruit Filling Market lies in innovation in fruit filling formulations and applications. By developing new and unique fruit fillings that offer enhanced performance and flavor profiles, companies can attract both home bakers and professional chefs. Offering high-quality fruit fillings that cater to diverse culinary applications can help expand market reach and drive growth in the premium ingredient sector.
Heat Stable Fruit Filling Market Share Analysis: Fillings with Fruit Pieces segment generated the highest revenue share in the industry
Fillings with fruit pieces are the largest segment in the Heat Stable Fruit Filling Market by type. This segment's dominance is driven by the consumer preference for fillings that offer a more authentic and textured fruit experience. Fillings with fruit pieces provide a visually appealing and flavorful addition to various baked goods, desserts, and confectioneries. They are popular among bakers and food manufacturers for their ability to retain the integrity and taste of the fruit even after baking or cooking at high temperatures. The presence of actual fruit pieces in the filling enhances the overall sensory appeal of the final product, making it more attractive to consumers. Additionally, the versatility of these fillings allows them to be used in a wide range of applications, from pies and pastries to cookies and cakes, further boosting their demand in the market.
Heat Stable Fruit Filling Market Share Analysis: Food Industry is the fastest growing segment over the forecast period to 2032
The food industry is the fastest-growing segment in the Heat Stable Fruit Filling Market by application, projected to see significant growth by 2032. This rapid growth is driven by the increasing demand for high-quality, convenient, and ready-to-use fruit fillings in various food products. The food industry encompasses a wide range of sectors, including bakery, confectionery, and ready-to-eat meals, all of which benefit from the versatility and convenience of heat stable fruit fillings. These fillings help food manufacturers streamline their production processes by providing a consistent and reliable ingredient that can withstand high temperatures without compromising on taste or texture. The growing consumer preference for premium and innovative bakery and confectionery products also fuels the demand for heat stable fruit fillings. As consumers continue to seek out indulgent yet convenient food options, the food industry is expected to drive the growth of the heat stable fruit filling market.
Heat Stable Fruit Filling Market Segmentation
By Type
Fillings with Fruit Pieces
Fillings without Fruit Pieces
By Application
Food Industry
Beverage Industry
Dairy Product Industry
Others
Countries Analyzed
North America (US, Canada, Mexico)
Europe (Germany, UK, France, Spain, Italy, Russia, Rest of Europe)
Asia Pacific (China, India, Japan, South Korea, Australia, South East Asia, Rest of Asia)
South America (Brazil, Argentina, Rest of South America)
Middle East and Africa (Saudi Arabia, UAE, Rest of Middle East, South Africa, Egypt, Rest of Africa)
Heat Stable Fruit Filling Companies Profiled in the Study
ER ŽE Group
FRUJO a.s.
KANDY
Krsulj Company d.o.o.
Mercator-E S.p.A.
*- List Not Exhaustive
Chapter 1. TABLE OF CONTENTS
Chapter 2. Introduction to Heat Stable Fruit Filling Market
2.1. Market Overview
2.2. Key Statistics and Report Highlights
2.3. Scope of the Comprehensive Study
2.3.1. Market Definition
2.3.2 Countries and Regions Covered
2.3.3 Research Objective
2.3.4 Units, Currency, and Conversions
2.3.5 Industry Value Chain
2.4. Key Market Segments
2.5. Key Companies
2.6. Study Period
Chapter 3. Strategic Analysis Review
3.1. Heat Stable Fruit Filling Pricing Analysis and Forecast
3.2. Porter’s Five Forces
3.3. Market Ecosystem
3.4. SWOT Analysis
3.5. Regulatory Scenario
3.3. Effects of Inflation, Russia-Ukraine War, moderating economic growth, and other macroeconomic factors
Chapter 4. Competitive Landscape
4.1. Market Share Analysis
4.1.1. Global Heat Stable Fruit Filling Market Share by Company, 2023
4.1.2. Product Offerings of Leading Heat Stable Fruit Filling Companies
4.2. Market Entropy
4.2.1. New Product Launches in the Industry
4.2.2. Mergers, Acquisitions, Joint ventures, and Partnerships
4.3. Key Strategies and Best Practices
Chapter 5. Global Market Projections: Best, Reference, and Low Case Scenarios
5.1. Growth Analysis- Case Scenario Definitions
5.2. Low Growth Case Scenario Forecasts
5.3. Reference Growth Case Scenario Forecasts
5.4. High Growth Case Scenario Forecasts
Chapter 6. Market Dynamics
6.1. Heat Stable Fruit Filling Market Drivers
6.2. Heat Stable Fruit Filling Market Challenges
6.6. Heat Stable Fruit Filling Market Opportunities
6.4. Heat Stable Fruit Filling Market Trends
Chapter 7. Global Heat Stable Fruit Filling Market Outlook Trends
7.1. Global Heat Stable Fruit Filling Revenue (USD Million) and CAGR (%) by Type (2021-2032)
7.2. Global Heat Stable Fruit Filling Revenue (USD Million) and CAGR (%) by Application (2021-2032)
7.3. Global Heat Stable Fruit Filling Revenue (USD Million) and CAGR (%) by Product (2021-2032)
By Type
Fillings with Fruit Pieces
Fillings without Fruit Pieces
By Application
Food Industry
Beverage Industry
Dairy Product Industry
Others
Chapter 8. Global Heat Stable Fruit Filling Regional Analysis and Outlook
8.1. Global Heat Stable Fruit Filling Revenue (USD Million) By Regions (2021- 2032)
8.2. North America Heat Stable Fruit Filling Revenue (USD Million) by Country (2021-2032)
8.2.1. United States Heat Stable Fruit Filling Regional Analysis and Outlook
8.2.2. Canada Heat Stable Fruit Filling Regional Analysis and Outlook
8.2.3. Mexico Heat Stable Fruit Filling Regional Analysis and Outlook
8.3. Europe Heat Stable Fruit Filling Revenue (USD Million), by Country (2021-2032)
8.3.1. Germany Heat Stable Fruit Filling Regional Analysis and Outlook
8.3.2. France Heat Stable Fruit Filling Regional Analysis and Outlook
8.3.3. United Kingdom Heat Stable Fruit Filling Regional Analysis and Outlook
8.3.4. Spain Heat Stable Fruit Filling Regional Analysis and Outlook
8.3.5. Italy Heat Stable Fruit Filling Regional Analysis and Outlook
8.3.6. Russia Heat Stable Fruit Filling Regional Analysis and Outlook
8.3.7. Rest of Europe Heat Stable Fruit Filling Regional Analysis and Outlook
8.4. Asia Pacific Heat Stable Fruit Filling Revenue (USD Million) by Country (2021-2032)
8.4.1. China Heat Stable Fruit Filling Regional Analysis and Outlook
8.4.2. Japan Heat Stable Fruit Filling Regional Analysis and Outlook
8.4.3. India Heat Stable Fruit Filling Regional Analysis and Outlook
8.4.4. South Korea Heat Stable Fruit Filling Regional Analysis and Outlook
8.4.5. Australia Heat Stable Fruit Filling Regional Analysis and Outlook
8.4.6. South East Asia Heat Stable Fruit Filling Regional Analysis and Outlook
8.4.7. Rest of Asia Pacific Heat Stable Fruit Filling Regional Analysis and Outlook
8.5. South America Heat Stable Fruit Filling Revenue (USD Million), by Country (2021-2032)
8.5.1. Brazil Heat Stable Fruit Filling Regional Analysis and Outlook
8.5.2. Argentina Heat Stable Fruit Filling Regional Analysis and Outlook
8.5.3. Rest of South America Heat Stable Fruit Filling Regional Analysis and Outlook
8.6. Middle East and Africa Heat Stable Fruit Filling Revenue (USD Million) by Country (2021-2032)
8.6.1. Middle East Heat Stable Fruit Filling Regional Analysis and Outlook
8.6.2. Africa Heat Stable Fruit Filling Regional Analysis and Outlook
Chapter 9. North America Heat Stable Fruit Filling Analysis and Outlook
9.1. North America Heat Stable Fruit Filling Revenue (USD Million) by Segments (2021-2032)
9.1.1. North America Heat Stable Fruit Filling Revenue (USD Million) by Type (2021-2032)
9.1.2. North America Heat Stable Fruit Filling Revenue (USD Million) by Application (2021-2032)
9.1.3. North America Heat Stable Fruit Filling Revenue (USD Million) by Product (2021-2032)
By Type
Fillings with Fruit Pieces
Fillings without Fruit Pieces
By Application
Food Industry
Beverage Industry
Dairy Product Industry
Others
Chapter 10. Europe Heat Stable Fruit Filling Analysis and Outlook
10.1. Europe Heat Stable Fruit Filling Revenue (USD Million), by Segments (USD Million) (2021-2032)
10.1.1. Europe Heat Stable Fruit Filling Revenue (USD Million) by Type (2021-2032)
10.1.2. Europe Heat Stable Fruit Filling Revenue (USD Million) by Application (2021-2032)
10.1.3. Europe Heat Stable Fruit Filling Revenue (USD Million) by Product (2021-2032)
By Type
Fillings with Fruit Pieces
Fillings without Fruit Pieces
By Application
Food Industry
Beverage Industry
Dairy Product Industry
Others
Chapter 11. Asia Pacific Heat Stable Fruit Filling Analysis and Outlook
11.1. Asia Pacific Heat Stable Fruit Filling Revenue (USD Million), and Revenue (USD Million) by Segments (2021-2032)
11.1.1. Asia Pacific Heat Stable Fruit Filling Revenue (USD Million) by Type (2021-2032)
11.1.2. Asia Pacific Heat Stable Fruit Filling Revenue (USD Million) by Application (2021-2032)
11.1.3. Asia Pacific Heat Stable Fruit Filling Revenue (USD Million) by Product (2021-2032)
By Type
Fillings with Fruit Pieces
Fillings without Fruit Pieces
By Application
Food Industry
Beverage Industry
Dairy Product Industry
Others
Chapter 12. South America Heat Stable Fruit Filling Analysis and Outlook
12.1. South America Heat Stable Fruit Filling Revenue (USD Million), by Segments (2021-2032)
12.1.1. South America Heat Stable Fruit Filling Revenue (USD Million) by Type (2021-2032)
12.1.2. South America Heat Stable Fruit Filling Revenue (USD Million) by Application (2021-2032)
12.1.3. South America Heat Stable Fruit Filling Revenue (USD Million) by Product (2021-2032)
By Type
Fillings with Fruit Pieces
Fillings without Fruit Pieces
By Application
Food Industry
Beverage Industry
Dairy Product Industry
Others
Chapter 13. Middle East and Africa Heat Stable Fruit Filling Analysis and Outlook
13.1. Middle East and Africa Heat Stable Fruit Filling Revenue (USD Million), by Segments (2021-2032)
13.1.1. Middle East and Africa Heat Stable Fruit Filling Revenue (USD Million) by Type (2021-2032)
13.1.2. Middle East and Africa Heat Stable Fruit Filling Revenue (USD Million) by Application (2021-2032)
13.1.3. Middle East and Africa Heat Stable Fruit Filling Revenue (USD Million) by Product (2021-2032)
By Type
Fillings with Fruit Pieces
Fillings without Fruit Pieces
By Application
Food Industry
Beverage Industry
Dairy Product Industry
Others
Chapter 14. Heat Stable Fruit Filling Company Profiles
14.1 Business Overview
14.2 Product Profiles
14.3 SWOT Profiles
14.5 Recent Developments
14.6 Financial Profile
List of Companies
ER ŽE Group
FRUJO a.s.
KANDY
Krsulj Company d.o.o.
Mercator-E S.p.A.
15. Methodology and Data Sources
15.1 Customization Offerings
15.2 Subscription Services
15.3 Related Reports
15.4 Publisher Expertise
LIST OF TABLES
Table 1 Market Segmentation Analysis
Table 2 Global Heat Stable Fruit Filling Market Share of Leading Companies, 2023
Table 3 Product Offerings of Leading Companies
Table 4 Low Growth Scenario Forecasts
Table 5 Reference Case Growth Scenario
Table 6 High Growth Case Scenario
Table 7 Global Heat Stable Fruit Filling Revenue (USD Million) And CAGR (%) By Type (2021-2032)
Table 8 Global Heat Stable Fruit Filling Revenue (USD Million) And CAGR (%) By Application (2021-2032)
Table 9 Global Heat Stable Fruit Filling Revenue (USD Million) And CAGR (%) By Product (2021-2032)
Table 10 Global Heat Stable Fruit Filling Market Revenue (USD Million) By Regions (2021-2032)
Table 11 Global Heat Stable Fruit Filling Market Share (%) By Regions (2021-2032)
Table 12 North America Heat Stable Fruit Filling Revenue (USD Million) By Country (2021-2032)
Table 13 Europe Heat Stable Fruit Filling Revenue (USD Million) By Country (2021-2032)
Table 14 Asia Pacific Heat Stable Fruit Filling Revenue (USD Million) By Country (2021-2032)
Table 15 South America Heat Stable Fruit Filling Revenue (USD Million) By Country (2021-2032)
Table 16 Middle East and Africa Heat Stable Fruit Filling Revenue (USD Million) By Region (2021-2032)
Table 17 North America Heat Stable Fruit Filling Revenue (USD Million) By Type (2021-2032)
Table 18 North America Heat Stable Fruit Filling Revenue (USD Million) By Application (2021-2032)
Table 19 North America Heat Stable Fruit Filling Revenue (USD Million) By Product (2021-2032)
Table 20 Europe Heat Stable Fruit Filling Revenue (USD Million) By Type (2021-2032)
Table 21 Europe Heat Stable Fruit Filling Revenue (USD Million) By Application (2021-2032)
Table 22 Europe Heat Stable Fruit Filling Revenue (USD Million) By Product (2021-2032)
Table 23 Asia Pacific Heat Stable Fruit Filling Revenue (USD Million) By Type (2021-2032)
Table 24 Asia Pacific Heat Stable Fruit Filling Revenue (USD Million) By Application (2021-2032)
Table 25 Asia Pacific Heat Stable Fruit Filling Revenue (USD Million) By Product (2021-2032)
Table 26 South America Heat Stable Fruit Filling Revenue (USD Million) By Type (2021-2032)
Table 27 South America Heat Stable Fruit Filling Revenue (USD Million) By Application (2021-2032)
Table 28 South America Heat Stable Fruit Filling Revenue (USD Million) By Product (2021-2032)
Table 29 Middle East and Africa Heat Stable Fruit Filling Revenue (USD Million) By Type (2021-2032)
Table 30 Middle East and Africa Heat Stable Fruit Filling Revenue (USD Million) By Application (2021-2032)
Table 31 Middle East and Africa Heat Stable Fruit Filling Revenue (USD Million) By Product (2021-2032)
LIST OF FIGURES
Figure 1. Market Scope
Figure 2. Pricing Forecasts Per Unit, 2023- 2032
Figure 3. Porter’s Five Forces
Figure 4. Global Heat Stable Fruit Filling Market Revenue (USD Million) By Regions (2021-2032)
Figure 5. Global Heat Stable Fruit Filling Market Share (%) By Regions (2023)
Figure 6. North America Heat Stable Fruit Filling Revenue (USD Million) By Country (2021-2032)
Figure 7. United States Heat Stable Fruit Filling Revenue (USD Million) By Country (2021-2032)
Figure 8. Canada Heat Stable Fruit Filling Revenue (USD Million) By Country (2021-2032)
Figure 9. Mexico Heat Stable Fruit Filling Revenue (USD Million) By Country (2021-2032)
Figure 10. Europe Heat Stable Fruit Filling Revenue (USD Million) By Country (2021-2032)
Figure 11. Germany Heat Stable Fruit Filling Revenue (USD Million) By Country (2021-2032)
Figure 12. France Heat Stable Fruit Filling Revenue (USD Million) By Country (2021-2032)
Figure 13. United Kingdom Heat Stable Fruit Filling Revenue (USD Million) By Country (2021-2032)
Figure 14. Spain Heat Stable Fruit Filling Revenue (USD Million) By Country (2021-2032)
Figure 15. Italy Heat Stable Fruit Filling Revenue (USD Million) By Country (2021-2032)
Figure 16. Russia Heat Stable Fruit Filling Revenue (USD Million) By Country (2021-2032)
Figure 17. Rest of Europe Heat Stable Fruit Filling Revenue (USD Million) By Country (2021-2032)
Figure 11. Asia Pacific Heat Stable Fruit Filling Revenue (USD Million) By Country (2021-2032)
Figure 12. China Heat Stable Fruit Filling Revenue (USD Million) By Country (2021-2032)
Figure 13. Japan Heat Stable Fruit Filling Revenue (USD Million) By Country (2021-2032)
Figure 14. India Heat Stable Fruit Filling Revenue (USD Million) By Country (2021-2032)
Figure 15. South Korea Heat Stable Fruit Filling Revenue (USD Million) By Country (2021-2032)
Figure 16. Australia Heat Stable Fruit Filling Revenue (USD Million) By Country (2021-2032)
Figure 17. South East Asia Heat Stable Fruit Filling Revenue (USD Million) By Country (2021-2032)
Figure 18. South America Heat Stable Fruit Filling Revenue (USD Million) By Country (2021-2032)
Figure 19. Brazil Heat Stable Fruit Filling Revenue (USD Million) By Country (2021-2032)
Figure 20. Argentina Heat Stable Fruit Filling Revenue (USD Million) By Country (2021-2032)
Figure 21. Rest of Asia Pacific Heat Stable Fruit Filling Revenue (USD Million) By Country (2021-2032)
Figure 22. Middle East and Africa Heat Stable Fruit Filling Revenue (USD Million) By Region (2021-2032)
Figure 23. Saudi Arabia Heat Stable Fruit Filling Revenue (USD Million) By Region (2021-2032)
Figure 24. The UAE Heat Stable Fruit Filling Revenue (USD Million) By Region (2021-2032)
Figure 25. Rest of Middle East Heat Stable Fruit Filling Revenue (USD Million) By Region (2021-2032)
Figure 26. South Africa Heat Stable Fruit Filling Revenue (USD Million) By Region (2021-2032)
Figure 27. Africa Heat Stable Fruit Filling Revenue (USD Million) By Region (2021-2032)
Figure 28. North America Heat Stable Fruit Filling Revenue (USD Million) By Type (2021-2032)
Figure 29. North America Heat Stable Fruit Filling Revenue (USD Million) By Application (2021-2032)
Figure 30. North America Heat Stable Fruit Filling Revenue (USD Million) By Product (2021-2032)
Figure 31. Europe Heat Stable Fruit Filling Revenue (USD Million) By Type (2021-2032)
Figure 32. Europe Heat Stable Fruit Filling Revenue (USD Million) By Application (2021-2032)
Figure 33. Europe Heat Stable Fruit Filling Revenue (USD Million) By Product (2021-2032)
Figure 34. Asia Pacific Heat Stable Fruit Filling Revenue (USD Million) By Type (2021-2032)
Figure 35. Asia Pacific Heat Stable Fruit Filling Revenue (USD Million) By Application (2021-2032)
Figure 36. Asia Pacific Heat Stable Fruit Filling Revenue (USD Million) By Product (2021-2032)
Figure 37. South America Heat Stable Fruit Filling Revenue (USD Million) By Type (2021-2032)
Figure 38. South America Heat Stable Fruit Filling Revenue (USD Million) By Application (2021-2032)
Figure 39. South America Heat Stable Fruit Filling Revenue (USD Million) By Product (2021-2032)
Figure 40. Middle East and Africa Heat Stable Fruit Filling Revenue (USD Million) By Type (2021-2032)
Figure 41. Middle East and Africa Heat Stable Fruit Filling Revenue (USD Million) By Application (2021-2032)
Figure 42. Middle East and Africa Heat Stable Fruit Filling Revenue (USD Million) By Product (2021-2032)
By Type
Fillings with Fruit Pieces
Fillings without Fruit Pieces
By Application
Food Industry
Beverage Industry
Dairy Product Industry
Others
Countries Analyzed
North America (US, Canada, Mexico)
Europe (Germany, UK, France, Spain, Italy, Russia, Rest of Europe)
Asia Pacific (China, India, Japan, South Korea, Australia, South East Asia, Rest of Asia)
South America (Brazil, Argentina, Rest of South America)
Middle East and Africa (Saudi Arabia, UAE, Rest of Middle East, South Africa, Egypt, Rest of Africa)
