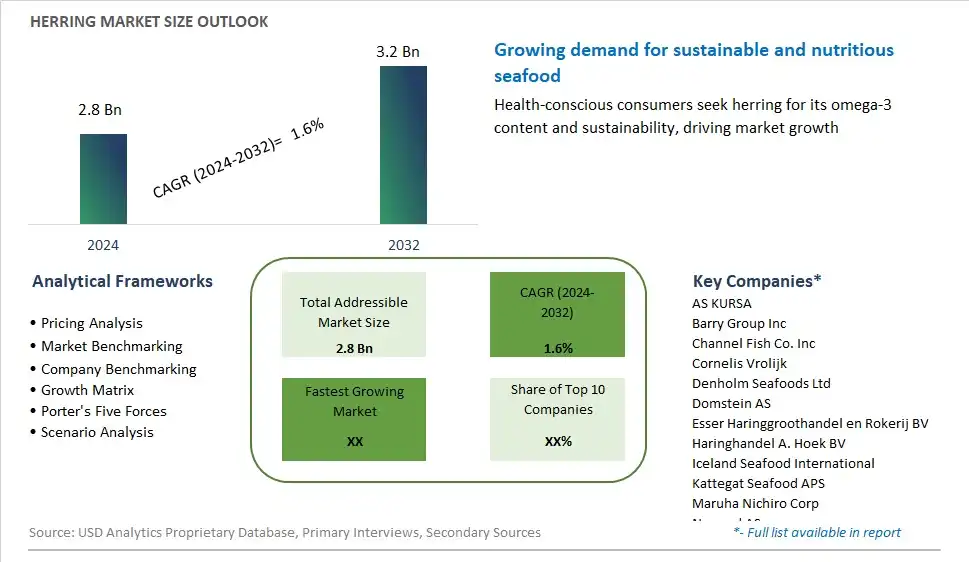
Global Herring Market Size is valued at $2.8 Billion in 2024 and is forecast to register a growth rate (CAGR) of 1.6% to reach $3.2 Billion by 2032.
The global Herring Market Comprehensive Study analyzes and forecasts the market size across 6 regions and 24 countries for diverse segments -By Type (Atlantic Herring, Pacific Herring, Others)
An Introduction to Herring Market
In 2024, the market for herring remains robust as consumers worldwide continue to appreciate the flavorful and nutritious qualities of this oily fish. Herring, a species of small, oily fish found in the North Atlantic and North Pacific oceans, is prized for its rich taste, high omega-3 fatty acid content, and versatility in culinary applications. From smoked and pickled herring to grilled fillets and sushi toppings, herring is enjoyed in various forms and cuisines around the world. Moreover, herring is recognized for its health benefits, including heart health, brain function, and inflammation reduction, making it a popular choice among health-conscious consumers seeking nutrient-dense and sustainable protein sources. Additionally, the sustainability of herring fisheries, responsible fishing practices, and certifications such as Marine Stewardship Council (MSC) play a crucial role in ensuring the long-term viability of herring stocks and maintaining environmental balance in marine ecosystems. With growing consumer awareness of the nutritional value and culinary versatility of herring, the market for this flavorful fish is poised for continued growth and diversification, offering opportunities for product innovation, market expansion, and sustainable seafood sourcing initiatives.
Herring Competitive Landscape
The market report analyses the leading companies in the industry including AS KURSA, Barry Group Inc, Channel Fish Co. Inc, Cornelis Vrolijk, Denholm Seafoods Ltd, Domstein AS, Esser Haringgroothandel en Rokerij BV, Haringhandel A. Hoek BV, Iceland Seafood International, Kattegat Seafood APS, Maruha Nichiro Corp, Nergard AS, Nordic Group AS, NOREBO Holding, Northbay Pelagic Ltd, OSTBALTFISH Ltd, Saare Fishexport OU, and Others.
Herring Market Dynamics
Herring Market Trend: Increasing Demand for Sustainable Seafood Options
The herring market is experiencing a prominent trend towards sustainable seafood consumption, driven by growing environmental concerns and a shift towards ethical sourcing practices. As consumers become more conscious of the ecological impact of their food choices, there is a rising demand for seafood species that are harvested or farmed in an environmentally responsible manner. Herring, known for its abundance and low environmental impact, is gaining popularity among consumers seeking nutritious and sustainable protein sources, driving market growth in the seafood industry.
Market Driver: Health Benefits and Nutritional Value
A key driver propelling the herring market is the growing recognition of herring's health benefits and nutritional value. Herring is rich in omega-3 fatty acids, protein, vitamins, and minerals, making it a highly nutritious food choice with various health benefits, including improved heart health, brain function, and immune support. As consumers become more health-conscious and prioritize nutritious foods in their diets, the demand for herring and other oily fish is increasing, driving production, distribution, and consumption in both domestic and international markets.
Market Opportunity: Diversification of Product Offerings and Market Channels
An opportunity exists for the herring industry to diversify its product offerings and explore new market channels to capitalize on growing consumer demand. Beyond traditional canned or smoked herring products, there is potential to introduce innovative value-added products such as herring fillets, marinated herring salads, or herring-based snacks targeting health-conscious consumers. Moreover, expanding into emerging markets or developing regions where herring is not commonly consumed can open up new growth opportunities for the industry. By leveraging marketing strategies that highlight herring's nutritional benefits, sustainability credentials, and versatility in culinary applications, stakeholders can position herring as a premium seafood option and capture a larger share of the global market.
Herring Market Share Analysis: Atlantic Herring held the dominant market share in 2024
In the Herring Market, the Atlantic herring segment is the largest, driven by its widespread availability, commercial importance, and established demand in various global markets. Atlantic herring, scientifically known as Clupea harengus, is one of the most widely distributed fish species in the world, inhabiting the North Atlantic Ocean and adjacent seas. Its popularity stems from its abundance, nutritional value, and versatility in culinary applications. Atlantic herring is prized for its mild flavor, firm texture, and rich omega-3 fatty acid content, making it a staple ingredient in numerous traditional and contemporary dishes, including pickled herring, smoked herring, and canned herring products. Further, Atlantic herring supports lucrative commercial fisheries across Europe, North America, and other regions, contributing significantly to the economies of coastal communities and seafood industries. Additionally, the growing awareness of the health benefits associated with consuming oily fish rich in omega-3 fatty acids further drives the demand for Atlantic herring products. As a result of its widespread availability, established market presence, and versatile usage, the Atlantic herring segment maintains its dominance in the Herring Market, poised for continued growth and market leadership.
Herring Market Segmentation
By Type
Atlantic Herring
Pacific Herring
Others
Countries Analyzed
North America (US, Canada, Mexico)
Europe (Germany, UK, France, Spain, Italy, Russia, Rest of Europe)
Asia Pacific (China, India, Japan, South Korea, Australia, South East Asia, Rest of Asia)
South America (Brazil, Argentina, Rest of South America)
Middle East and Africa (Saudi Arabia, UAE, Rest of Middle East, South Africa, Egypt, Rest of Africa)
Herring Companies Profiled in the Study
AS KURSA
Barry Group Inc
Channel Fish Co. Inc
Cornelis Vrolijk
Denholm Seafoods Ltd
Domstein AS
Esser Haringgroothandel en Rokerij BV
Haringhandel A. Hoek BV
Iceland Seafood International
Kattegat Seafood APS
Maruha Nichiro Corp
Nergard AS
Nordic Group AS
NOREBO Holding
Northbay Pelagic Ltd
OSTBALTFISH Ltd
Saare Fishexport OU
*- List Not Exhaustive
Chapter 1. TABLE OF CONTENTS
Chapter 2. Introduction to Herring Market
2.1. Market Overview
2.2. Key Statistics and Report Highlights
2.3. Scope of the Comprehensive Study
2.3.1. Market Definition
2.3.2 Countries and Regions Covered
2.3.3 Research Objective
2.3.4 Units, Currency, and Conversions
2.3.5 Industry Value Chain
2.4. Key Market Segments
2.5. Key Companies
2.6. Study Period
Chapter 3. Strategic Analysis Review
3.1. Herring Pricing Analysis and Forecast
3.2. Porter’s Five Forces
3.3. Market Ecosystem
3.4. SWOT Analysis
3.5. Regulatory Scenario
3.3. Effects of Inflation, Russia-Ukraine War, moderating economic growth, and other macroeconomic factors
Chapter 4. Competitive Landscape
4.1. Market Share Analysis
4.1.1. Global Herring Market Share by Company, 2023
4.1.2. Product Offerings of Leading Herring Companies
4.2. Market Entropy
4.2.1. New Product Launches in the Industry
4.2.2. Mergers, Acquisitions, Joint ventures, and Partnerships
4.3. Key Strategies and Best Practices
Chapter 5. Global Market Projections: Best, Reference, and Low Case Scenarios
5.1. Growth Analysis- Case Scenario Definitions
5.2. Low Growth Case Scenario Forecasts
5.3. Reference Growth Case Scenario Forecasts
5.4. High Growth Case Scenario Forecasts
Chapter 6. Market Dynamics
6.1. Herring Market Drivers
6.2. Herring Market Challenges
6.6. Herring Market Opportunities
6.4. Herring Market Trends
Chapter 7. Global Herring Market Outlook Trends
7.1. Global Herring Revenue (USD Million) and CAGR (%) by Type (2021-2032)
7.2. Global Herring Revenue (USD Million) and CAGR (%) by Application (2021-2032)
7.3. Global Herring Revenue (USD Million) and CAGR (%) by Product (2021-2032)
By Type
Atlantic Herring
Pacific Herring
Others
Chapter 8. Global Herring Regional Analysis and Outlook
8.1. Global Herring Revenue (USD Million) By Regions (2021- 2032)
8.2. North America Herring Revenue (USD Million) by Country (2021-2032)
8.2.1. United States Herring Regional Analysis and Outlook
8.2.2. Canada Herring Regional Analysis and Outlook
8.2.3. Mexico Herring Regional Analysis and Outlook
8.3. Europe Herring Revenue (USD Million), by Country (2021-2032)
8.3.1. Germany Herring Regional Analysis and Outlook
8.3.2. France Herring Regional Analysis and Outlook
8.3.3. United Kingdom Herring Regional Analysis and Outlook
8.3.4. Spain Herring Regional Analysis and Outlook
8.3.5. Italy Herring Regional Analysis and Outlook
8.3.6. Russia Herring Regional Analysis and Outlook
8.3.7. Rest of Europe Herring Regional Analysis and Outlook
8.4. Asia Pacific Herring Revenue (USD Million) by Country (2021-2032)
8.4.1. China Herring Regional Analysis and Outlook
8.4.2. Japan Herring Regional Analysis and Outlook
8.4.3. India Herring Regional Analysis and Outlook
8.4.4. South Korea Herring Regional Analysis and Outlook
8.4.5. Australia Herring Regional Analysis and Outlook
8.4.6. South East Asia Herring Regional Analysis and Outlook
8.4.7. Rest of Asia Pacific Herring Regional Analysis and Outlook
8.5. South America Herring Revenue (USD Million), by Country (2021-2032)
8.5.1. Brazil Herring Regional Analysis and Outlook
8.5.2. Argentina Herring Regional Analysis and Outlook
8.5.3. Rest of South America Herring Regional Analysis and Outlook
8.6. Middle East and Africa Herring Revenue (USD Million) by Country (2021-2032)
8.6.1. Middle East Herring Regional Analysis and Outlook
8.6.2. Africa Herring Regional Analysis and Outlook
Chapter 9. North America Herring Analysis and Outlook
9.1. North America Herring Revenue (USD Million) by Segments (2021-2032)
9.1.1. North America Herring Revenue (USD Million) by Type (2021-2032)
9.1.2. North America Herring Revenue (USD Million) by Application (2021-2032)
9.1.3. North America Herring Revenue (USD Million) by Product (2021-2032)
By Type
Atlantic Herring
Pacific Herring
Others
Chapter 10. Europe Herring Analysis and Outlook
10.1. Europe Herring Revenue (USD Million), by Segments (USD Million) (2021-2032)
10.1.1. Europe Herring Revenue (USD Million) by Type (2021-2032)
10.1.2. Europe Herring Revenue (USD Million) by Application (2021-2032)
10.1.3. Europe Herring Revenue (USD Million) by Product (2021-2032)
By Type
Atlantic Herring
Pacific Herring
Others
Chapter 11. Asia Pacific Herring Analysis and Outlook
11.1. Asia Pacific Herring Revenue (USD Million), and Revenue (USD Million) by Segments (2021-2032)
11.1.1. Asia Pacific Herring Revenue (USD Million) by Type (2021-2032)
11.1.2. Asia Pacific Herring Revenue (USD Million) by Application (2021-2032)
11.1.3. Asia Pacific Herring Revenue (USD Million) by Product (2021-2032)
By Type
Atlantic Herring
Pacific Herring
Others
Chapter 12. South America Herring Analysis and Outlook
12.1. South America Herring Revenue (USD Million), by Segments (2021-2032)
12.1.1. South America Herring Revenue (USD Million) by Type (2021-2032)
12.1.2. South America Herring Revenue (USD Million) by Application (2021-2032)
12.1.3. South America Herring Revenue (USD Million) by Product (2021-2032)
By Type
Atlantic Herring
Pacific Herring
Others
Chapter 13. Middle East and Africa Herring Analysis and Outlook
13.1. Middle East and Africa Herring Revenue (USD Million), by Segments (2021-2032)
13.1.1. Middle East and Africa Herring Revenue (USD Million) by Type (2021-2032)
13.1.2. Middle East and Africa Herring Revenue (USD Million) by Application (2021-2032)
13.1.3. Middle East and Africa Herring Revenue (USD Million) by Product (2021-2032)
By Type
Atlantic Herring
Pacific Herring
Others
Chapter 14. Herring Company Profiles
14.1 Business Overview
14.2 Product Profiles
14.3 SWOT Profiles
14.5 Recent Developments
14.6 Financial Profile
List of Companies
AS KURSA
Barry Group Inc
Channel Fish Co. Inc
Cornelis Vrolijk
Denholm Seafoods Ltd
Domstein AS
Esser Haringgroothandel en Rokerij BV
Haringhandel A. Hoek BV
Iceland Seafood International
Kattegat Seafood APS
Maruha Nichiro Corp
Nergard AS
Nordic Group AS
NOREBO Holding
Northbay Pelagic Ltd
OSTBALTFISH Ltd
Saare Fishexport OU
15. Methodology and Data Sources
15.1 Customization Offerings
15.2 Subscription Services
15.3 Related Reports
15.4 Publisher Expertise
LIST OF TABLES
Table 1 Market Segmentation Analysis
Table 2 Global Herring Market Share of Leading Companies, 2023
Table 3 Product Offerings of Leading Companies
Table 4 Low Growth Scenario Forecasts
Table 5 Reference Case Growth Scenario
Table 6 High Growth Case Scenario
Table 7 Global Herring Revenue (USD Million) And CAGR (%) By Type (2021-2032)
Table 8 Global Herring Revenue (USD Million) And CAGR (%) By Application (2021-2032)
Table 9 Global Herring Revenue (USD Million) And CAGR (%) By Product (2021-2032)
Table 10 Global Herring Market Revenue (USD Million) By Regions (2021-2032)
Table 11 Global Herring Market Share (%) By Regions (2021-2032)
Table 12 North America Herring Revenue (USD Million) By Country (2021-2032)
Table 13 Europe Herring Revenue (USD Million) By Country (2021-2032)
Table 14 Asia Pacific Herring Revenue (USD Million) By Country (2021-2032)
Table 15 South America Herring Revenue (USD Million) By Country (2021-2032)
Table 16 Middle East and Africa Herring Revenue (USD Million) By Region (2021-2032)
Table 17 North America Herring Revenue (USD Million) By Type (2021-2032)
Table 18 North America Herring Revenue (USD Million) By Application (2021-2032)
Table 19 North America Herring Revenue (USD Million) By Product (2021-2032)
Table 20 Europe Herring Revenue (USD Million) By Type (2021-2032)
Table 21 Europe Herring Revenue (USD Million) By Application (2021-2032)
Table 22 Europe Herring Revenue (USD Million) By Product (2021-2032)
Table 23 Asia Pacific Herring Revenue (USD Million) By Type (2021-2032)
Table 24 Asia Pacific Herring Revenue (USD Million) By Application (2021-2032)
Table 25 Asia Pacific Herring Revenue (USD Million) By Product (2021-2032)
Table 26 South America Herring Revenue (USD Million) By Type (2021-2032)
Table 27 South America Herring Revenue (USD Million) By Application (2021-2032)
Table 28 South America Herring Revenue (USD Million) By Product (2021-2032)
Table 29 Middle East and Africa Herring Revenue (USD Million) By Type (2021-2032)
Table 30 Middle East and Africa Herring Revenue (USD Million) By Application (2021-2032)
Table 31 Middle East and Africa Herring Revenue (USD Million) By Product (2021-2032)
LIST OF FIGURES
Figure 1. Market Scope
Figure 2. Pricing Forecasts Per Unit, 2023- 2032
Figure 3. Porter’s Five Forces
Figure 4. Global Herring Market Revenue (USD Million) By Regions (2021-2032)
Figure 5. Global Herring Market Share (%) By Regions (2023)
Figure 6. North America Herring Revenue (USD Million) By Country (2021-2032)
Figure 7. United States Herring Revenue (USD Million) By Country (2021-2032)
Figure 8. Canada Herring Revenue (USD Million) By Country (2021-2032)
Figure 9. Mexico Herring Revenue (USD Million) By Country (2021-2032)
Figure 10. Europe Herring Revenue (USD Million) By Country (2021-2032)
Figure 11. Germany Herring Revenue (USD Million) By Country (2021-2032)
Figure 12. France Herring Revenue (USD Million) By Country (2021-2032)
Figure 13. United Kingdom Herring Revenue (USD Million) By Country (2021-2032)
Figure 14. Spain Herring Revenue (USD Million) By Country (2021-2032)
Figure 15. Italy Herring Revenue (USD Million) By Country (2021-2032)
Figure 16. Russia Herring Revenue (USD Million) By Country (2021-2032)
Figure 17. Rest of Europe Herring Revenue (USD Million) By Country (2021-2032)
Figure 11. Asia Pacific Herring Revenue (USD Million) By Country (2021-2032)
Figure 12. China Herring Revenue (USD Million) By Country (2021-2032)
Figure 13. Japan Herring Revenue (USD Million) By Country (2021-2032)
Figure 14. India Herring Revenue (USD Million) By Country (2021-2032)
Figure 15. South Korea Herring Revenue (USD Million) By Country (2021-2032)
Figure 16. Australia Herring Revenue (USD Million) By Country (2021-2032)
Figure 17. South East Asia Herring Revenue (USD Million) By Country (2021-2032)
Figure 18. South America Herring Revenue (USD Million) By Country (2021-2032)
Figure 19. Brazil Herring Revenue (USD Million) By Country (2021-2032)
Figure 20. Argentina Herring Revenue (USD Million) By Country (2021-2032)
Figure 21. Rest of Asia Pacific Herring Revenue (USD Million) By Country (2021-2032)
Figure 22. Middle East and Africa Herring Revenue (USD Million) By Region (2021-2032)
Figure 23. Saudi Arabia Herring Revenue (USD Million) By Region (2021-2032)
Figure 24. The UAE Herring Revenue (USD Million) By Region (2021-2032)
Figure 25. Rest of Middle East Herring Revenue (USD Million) By Region (2021-2032)
Figure 26. South Africa Herring Revenue (USD Million) By Region (2021-2032)
Figure 27. Africa Herring Revenue (USD Million) By Region (2021-2032)
Figure 28. North America Herring Revenue (USD Million) By Type (2021-2032)
Figure 29. North America Herring Revenue (USD Million) By Application (2021-2032)
Figure 30. North America Herring Revenue (USD Million) By Product (2021-2032)
Figure 31. Europe Herring Revenue (USD Million) By Type (2021-2032)
Figure 32. Europe Herring Revenue (USD Million) By Application (2021-2032)
Figure 33. Europe Herring Revenue (USD Million) By Product (2021-2032)
Figure 34. Asia Pacific Herring Revenue (USD Million) By Type (2021-2032)
Figure 35. Asia Pacific Herring Revenue (USD Million) By Application (2021-2032)
Figure 36. Asia Pacific Herring Revenue (USD Million) By Product (2021-2032)
Figure 37. South America Herring Revenue (USD Million) By Type (2021-2032)
Figure 38. South America Herring Revenue (USD Million) By Application (2021-2032)
Figure 39. South America Herring Revenue (USD Million) By Product (2021-2032)
Figure 40. Middle East and Africa Herring Revenue (USD Million) By Type (2021-2032)
Figure 41. Middle East and Africa Herring Revenue (USD Million) By Application (2021-2032)
Figure 42. Middle East and Africa Herring Revenue (USD Million) By Product (2021-2032)
By Type
Atlantic Herring
Pacific Herring
Others
Countries Analyzed
North America (US, Canada, Mexico)
Europe (Germany, UK, France, Spain, Italy, Russia, Rest of Europe)
Asia Pacific (China, India, Japan, South Korea, Australia, South East Asia, Rest of Asia)
South America (Brazil, Argentina, Rest of South America)
Middle East and Africa (Saudi Arabia, UAE, Rest of Middle East, South Africa, Egypt, Rest of Africa)
