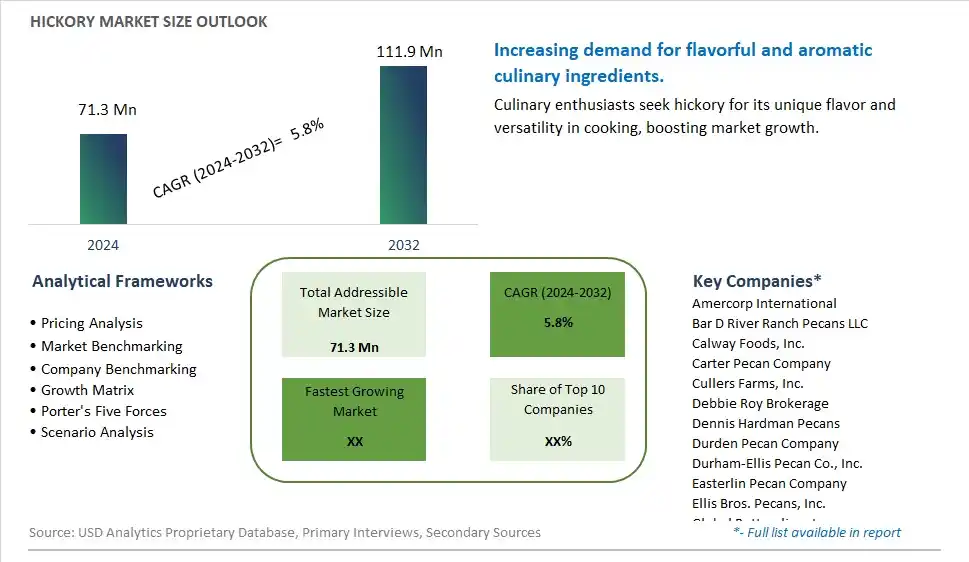
Global Hickory Market Size is valued at $71.3 Million in 2024 and is forecast to register a growth rate (CAGR) of 5.8% to reach $111.9 Million by 2032.
The global Hickory Market Comprehensive Study analyzes and forecasts the market size across 6 regions and 24 countries for diverse segments -By Product (In-shell Pecans, Shelled Pecans), By End-User (Ready to eat, Confectionery & Bakery, Others)
An Introduction to Hickory Market
In 2024, the Hickory market is witnessing robust growth, driven by the rising demand for high-quality hardwood in furniture, flooring, and smoking applications. Hickory, known for its durability, strength, and distinctive grain patterns, is popular among manufacturers and consumers seeking premium wood products. The market benefits from advancements in sustainable forestry practices, the growing trend of rustic and handcrafted furniture, and the expansion of the global woodworking industry. Additionally, the increasing awareness of the benefits of hickory wood for smoking meats and enhancing flavor profiles is contributing to market growth.
Hickory Competitive Landscape
The market report analyses the leading companies in the industry including Amercorp International, Bar D River Ranch Pecans LLC, Calway Foods, Inc., Carter Pecan Company, Cullers Farms, Inc., Debbie Roy Brokerage, Dennis Hardman Pecans, Durden Pecan Company, Durham-Ellis Pecan Co., Inc., Easterlin Pecan Company, Ellis Bros. Pecans, Inc., Global Bottomline, Inc., Green Valley Pecan Company, Hudson Pecan Company, John B. Sanfilippo & Son, Inc., Lamar Pecan Company, Lane Southern Orchards, Merritt Pecan Company, Montz Pecans, LLC, Navarro Pecan Company, Nut Tree Pecan Company, Royalty Pecan Farms, LLC, San Saba Pecan, LP, Shamrock Ranch, South Georgia Pecan Co. Inc., The Alabama Pecan Co., Tularosa Pecan Company, U.S. Pecans LLC, Whaley Pecan Company, Wharton Ranch, and Others.
Hickory Market Dynamics
Hickory Market Trend: Increasing Demand for Natural and Smoky Flavors
The most prominent trend in the Hickory Market is the increasing demand for natural and smoky flavors. As consumers seek authentic and rich taste experiences, hickory is gaining popularity for its ability to impart a distinctive smoky flavor to various foods. This trend is driven by the growing interest in traditional cooking methods and the desire for natural flavor enhancers that elevate culinary creations.
Hickory Market Driver: Growth in the Barbecue and Grilling Culture
The key driver of the Hickory Market is the growth in the barbecue and grilling culture. As more people embrace outdoor cooking and seek high-quality grilling ingredients, there is a higher demand for hickory products, such as wood chips, charcoal, and smoke flavorings. This driver is supported by the trend towards experiential dining and the increasing popularity of barbecue events and competitions, driving growth for this sector.
Hickory Market Opportunity: Innovation in Flavoring Products and Applications
A significant opportunity in the Hickory Market lies in innovation in flavoring products and applications. By developing new and unique hickory products that offer enhanced performance and diverse flavor profiles, companies can attract culinary enthusiasts and professional chefs. Offering high-quality hickory products that cater to different cooking methods and culinary applications can help expand market reach and drive growth in the premium flavoring sector.
Hickory Market Share Analysis: Shelled Pecans segment generated the highest revenue share in the industry
Shelled pecans are the largest segment in the Hickory Market by product. This dominance is driven by the convenience and versatility that shelled pecans offer to consumers and manufacturers. Shelled pecans eliminate the need for cracking and shelling, making them immediately ready for consumption or use in various culinary applications. They are popular in a wide range of products, including snacks, desserts, salads, and main dishes, due to their rich flavor and nutritional benefits, such as high levels of healthy fats, protein, vitamins, and minerals. The demand for shelled pecans is further bolstered by the growing trend towards healthy snacking and the increasing use of pecans as an ingredient in gourmet and specialty foods. Their availability in both retail and bulk packaging makes them accessible to both individual consumers and the foodservice industry, reinforcing their position as the largest segment in the market.
Hickory Market Share Analysis: Confectionery & Bakery is the fastest growing segment over the forecast period to 2032
The confectionery & bakery segment is the fastest-growing segment in the Hickory Market by end-user, projected to see significant growth by 2032. This rapid growth is driven by the increasing consumer demand for high-quality, nut-infused baked goods and confections. Pecans are a popular ingredient in a variety of confectionery products, including chocolates, candies, and pralines, as well as in bakery items like pies, cookies, and cakes. The rich, buttery flavor and crunchy texture of pecans enhance the appeal of these products, making them a favorite among consumers. The trend towards premium and artisanal baked goods and confections has led to a higher demand for quality ingredients like pecans. Additionally, the growing awareness of the health benefits associated with nuts, such as improved heart health and weight management, has encouraged their inclusion in more health-conscious and indulgent treats. As the confectionery and bakery industries continue to innovate and expand their product offerings, the demand for pecans in this segment is expected to grow significantly.
Hickory Market Segmentation
By Product
In-shell Pecans
Shelled Pecans
By End-User
Ready to eat
Confectionery & Bakery
Others
Countries Analyzed
North America (US, Canada, Mexico)
Europe (Germany, UK, France, Spain, Italy, Russia, Rest of Europe)
Asia Pacific (China, India, Japan, South Korea, Australia, South East Asia, Rest of Asia)
South America (Brazil, Argentina, Rest of South America)
Middle East and Africa (Saudi Arabia, UAE, Rest of Middle East, South Africa, Egypt, Rest of Africa)
Hickory Companies Profiled in the Study
Amercorp International
Bar D River Ranch Pecans LLC
Calway Foods, Inc.
Carter Pecan Company
Cullers Farms, Inc.
Debbie Roy Brokerage
Dennis Hardman Pecans
Durden Pecan Company
Durham-Ellis Pecan Co., Inc.
Easterlin Pecan Company
Ellis Bros. Pecans, Inc.
Global Bottomline, Inc.
Green Valley Pecan Company
Hudson Pecan Company
John B. Sanfilippo & Son, Inc.
Lamar Pecan Company
Lane Southern Orchards
Merritt Pecan Company
Montz Pecans, LLC
Navarro Pecan Company
Nut Tree Pecan Company
Royalty Pecan Farms, LLC
San Saba Pecan, LP
Shamrock Ranch
South Georgia Pecan Co. Inc.
The Alabama Pecan Co.
Tularosa Pecan Company
U.S. Pecans LLC
Whaley Pecan Company
Wharton Ranch
*- List Not Exhaustive
Chapter 1. TABLE OF CONTENTS
Chapter 2. Introduction to Hickory Market
2.1. Market Overview
2.2. Key Statistics and Report Highlights
2.3. Scope of the Comprehensive Study
2.3.1. Market Definition
2.3.2 Countries and Regions Covered
2.3.3 Research Objective
2.3.4 Units, Currency, and Conversions
2.3.5 Industry Value Chain
2.4. Key Market Segments
2.5. Key Companies
2.6. Study Period
Chapter 3. Strategic Analysis Review
3.1. Hickory Pricing Analysis and Forecast
3.2. Porter’s Five Forces
3.3. Market Ecosystem
3.4. SWOT Analysis
3.5. Regulatory Scenario
3.3. Effects of Inflation, Russia-Ukraine War, moderating economic growth, and other macroeconomic factors
Chapter 4. Competitive Landscape
4.1. Market Share Analysis
4.1.1. Global Hickory Market Share by Company, 2023
4.1.2. Product Offerings of Leading Hickory Companies
4.2. Market Entropy
4.2.1. New Product Launches in the Industry
4.2.2. Mergers, Acquisitions, Joint ventures, and Partnerships
4.3. Key Strategies and Best Practices
Chapter 5. Global Market Projections: Best, Reference, and Low Case Scenarios
5.1. Growth Analysis- Case Scenario Definitions
5.2. Low Growth Case Scenario Forecasts
5.3. Reference Growth Case Scenario Forecasts
5.4. High Growth Case Scenario Forecasts
Chapter 6. Market Dynamics
6.1. Hickory Market Drivers
6.2. Hickory Market Challenges
6.6. Hickory Market Opportunities
6.4. Hickory Market Trends
Chapter 7. Global Hickory Market Outlook Trends
7.1. Global Hickory Revenue (USD Million) and CAGR (%) by Type (2021-2032)
7.2. Global Hickory Revenue (USD Million) and CAGR (%) by Application (2021-2032)
7.3. Global Hickory Revenue (USD Million) and CAGR (%) by Product (2021-2032)
By Product
In-shell Pecans
Shelled Pecans
By End-User
Ready to eat
Confectionery & Bakery
Others
Chapter 8. Global Hickory Regional Analysis and Outlook
8.1. Global Hickory Revenue (USD Million) By Regions (2021- 2032)
8.2. North America Hickory Revenue (USD Million) by Country (2021-2032)
8.2.1. United States Hickory Regional Analysis and Outlook
8.2.2. Canada Hickory Regional Analysis and Outlook
8.2.3. Mexico Hickory Regional Analysis and Outlook
8.3. Europe Hickory Revenue (USD Million), by Country (2021-2032)
8.3.1. Germany Hickory Regional Analysis and Outlook
8.3.2. France Hickory Regional Analysis and Outlook
8.3.3. United Kingdom Hickory Regional Analysis and Outlook
8.3.4. Spain Hickory Regional Analysis and Outlook
8.3.5. Italy Hickory Regional Analysis and Outlook
8.3.6. Russia Hickory Regional Analysis and Outlook
8.3.7. Rest of Europe Hickory Regional Analysis and Outlook
8.4. Asia Pacific Hickory Revenue (USD Million) by Country (2021-2032)
8.4.1. China Hickory Regional Analysis and Outlook
8.4.2. Japan Hickory Regional Analysis and Outlook
8.4.3. India Hickory Regional Analysis and Outlook
8.4.4. South Korea Hickory Regional Analysis and Outlook
8.4.5. Australia Hickory Regional Analysis and Outlook
8.4.6. South East Asia Hickory Regional Analysis and Outlook
8.4.7. Rest of Asia Pacific Hickory Regional Analysis and Outlook
8.5. South America Hickory Revenue (USD Million), by Country (2021-2032)
8.5.1. Brazil Hickory Regional Analysis and Outlook
8.5.2. Argentina Hickory Regional Analysis and Outlook
8.5.3. Rest of South America Hickory Regional Analysis and Outlook
8.6. Middle East and Africa Hickory Revenue (USD Million) by Country (2021-2032)
8.6.1. Middle East Hickory Regional Analysis and Outlook
8.6.2. Africa Hickory Regional Analysis and Outlook
Chapter 9. North America Hickory Analysis and Outlook
9.1. North America Hickory Revenue (USD Million) by Segments (2021-2032)
9.1.1. North America Hickory Revenue (USD Million) by Type (2021-2032)
9.1.2. North America Hickory Revenue (USD Million) by Application (2021-2032)
9.1.3. North America Hickory Revenue (USD Million) by Product (2021-2032)
By Product
In-shell Pecans
Shelled Pecans
By End-User
Ready to eat
Confectionery & Bakery
Others
Chapter 10. Europe Hickory Analysis and Outlook
10.1. Europe Hickory Revenue (USD Million), by Segments (USD Million) (2021-2032)
10.1.1. Europe Hickory Revenue (USD Million) by Type (2021-2032)
10.1.2. Europe Hickory Revenue (USD Million) by Application (2021-2032)
10.1.3. Europe Hickory Revenue (USD Million) by Product (2021-2032)
By Product
In-shell Pecans
Shelled Pecans
By End-User
Ready to eat
Confectionery & Bakery
Others
Chapter 11. Asia Pacific Hickory Analysis and Outlook
11.1. Asia Pacific Hickory Revenue (USD Million), and Revenue (USD Million) by Segments (2021-2032)
11.1.1. Asia Pacific Hickory Revenue (USD Million) by Type (2021-2032)
11.1.2. Asia Pacific Hickory Revenue (USD Million) by Application (2021-2032)
11.1.3. Asia Pacific Hickory Revenue (USD Million) by Product (2021-2032)
By Product
In-shell Pecans
Shelled Pecans
By End-User
Ready to eat
Confectionery & Bakery
Others
Chapter 12. South America Hickory Analysis and Outlook
12.1. South America Hickory Revenue (USD Million), by Segments (2021-2032)
12.1.1. South America Hickory Revenue (USD Million) by Type (2021-2032)
12.1.2. South America Hickory Revenue (USD Million) by Application (2021-2032)
12.1.3. South America Hickory Revenue (USD Million) by Product (2021-2032)
By Product
In-shell Pecans
Shelled Pecans
By End-User
Ready to eat
Confectionery & Bakery
Others
Chapter 13. Middle East and Africa Hickory Analysis and Outlook
13.1. Middle East and Africa Hickory Revenue (USD Million), by Segments (2021-2032)
13.1.1. Middle East and Africa Hickory Revenue (USD Million) by Type (2021-2032)
13.1.2. Middle East and Africa Hickory Revenue (USD Million) by Application (2021-2032)
13.1.3. Middle East and Africa Hickory Revenue (USD Million) by Product (2021-2032)
By Product
In-shell Pecans
Shelled Pecans
By End-User
Ready to eat
Confectionery & Bakery
Others
Chapter 14. Hickory Company Profiles
14.1 Business Overview
14.2 Product Profiles
14.3 SWOT Profiles
14.5 Recent Developments
14.6 Financial Profile
List of Companies
Amercorp International
Bar D River Ranch Pecans LLC
Calway Foods, Inc.
Carter Pecan Company
Cullers Farms, Inc.
Debbie Roy Brokerage
Dennis Hardman Pecans
Durden Pecan Company
Durham-Ellis Pecan Co., Inc.
Easterlin Pecan Company
Ellis Bros. Pecans, Inc.
Global Bottomline, Inc.
Green Valley Pecan Company
Hudson Pecan Company
John B. Sanfilippo & Son, Inc.
Lamar Pecan Company
Lane Southern Orchards
Merritt Pecan Company
Montz Pecans, LLC
Navarro Pecan Company
Nut Tree Pecan Company
Royalty Pecan Farms, LLC
San Saba Pecan, LP
Shamrock Ranch
South Georgia Pecan Co. Inc.
The Alabama Pecan Co.
Tularosa Pecan Company
U.S. Pecans LLC
Whaley Pecan Company
Wharton Ranch
15. Methodology and Data Sources
15.1 Customization Offerings
15.2 Subscription Services
15.3 Related Reports
15.4 Publisher Expertise
LIST OF TABLES
Table 1 Market Segmentation Analysis
Table 2 Global Hickory Market Share of Leading Companies, 2023
Table 3 Product Offerings of Leading Companies
Table 4 Low Growth Scenario Forecasts
Table 5 Reference Case Growth Scenario
Table 6 High Growth Case Scenario
Table 7 Global Hickory Revenue (USD Million) And CAGR (%) By Type (2021-2032)
Table 8 Global Hickory Revenue (USD Million) And CAGR (%) By Application (2021-2032)
Table 9 Global Hickory Revenue (USD Million) And CAGR (%) By Product (2021-2032)
Table 10 Global Hickory Market Revenue (USD Million) By Regions (2021-2032)
Table 11 Global Hickory Market Share (%) By Regions (2021-2032)
Table 12 North America Hickory Revenue (USD Million) By Country (2021-2032)
Table 13 Europe Hickory Revenue (USD Million) By Country (2021-2032)
Table 14 Asia Pacific Hickory Revenue (USD Million) By Country (2021-2032)
Table 15 South America Hickory Revenue (USD Million) By Country (2021-2032)
Table 16 Middle East and Africa Hickory Revenue (USD Million) By Region (2021-2032)
Table 17 North America Hickory Revenue (USD Million) By Type (2021-2032)
Table 18 North America Hickory Revenue (USD Million) By Application (2021-2032)
Table 19 North America Hickory Revenue (USD Million) By Product (2021-2032)
Table 20 Europe Hickory Revenue (USD Million) By Type (2021-2032)
Table 21 Europe Hickory Revenue (USD Million) By Application (2021-2032)
Table 22 Europe Hickory Revenue (USD Million) By Product (2021-2032)
Table 23 Asia Pacific Hickory Revenue (USD Million) By Type (2021-2032)
Table 24 Asia Pacific Hickory Revenue (USD Million) By Application (2021-2032)
Table 25 Asia Pacific Hickory Revenue (USD Million) By Product (2021-2032)
Table 26 South America Hickory Revenue (USD Million) By Type (2021-2032)
Table 27 South America Hickory Revenue (USD Million) By Application (2021-2032)
Table 28 South America Hickory Revenue (USD Million) By Product (2021-2032)
Table 29 Middle East and Africa Hickory Revenue (USD Million) By Type (2021-2032)
Table 30 Middle East and Africa Hickory Revenue (USD Million) By Application (2021-2032)
Table 31 Middle East and Africa Hickory Revenue (USD Million) By Product (2021-2032)
LIST OF FIGURES
Figure 1. Market Scope
Figure 2. Pricing Forecasts Per Unit, 2023- 2032
Figure 3. Porter’s Five Forces
Figure 4. Global Hickory Market Revenue (USD Million) By Regions (2021-2032)
Figure 5. Global Hickory Market Share (%) By Regions (2023)
Figure 6. North America Hickory Revenue (USD Million) By Country (2021-2032)
Figure 7. United States Hickory Revenue (USD Million) By Country (2021-2032)
Figure 8. Canada Hickory Revenue (USD Million) By Country (2021-2032)
Figure 9. Mexico Hickory Revenue (USD Million) By Country (2021-2032)
Figure 10. Europe Hickory Revenue (USD Million) By Country (2021-2032)
Figure 11. Germany Hickory Revenue (USD Million) By Country (2021-2032)
Figure 12. France Hickory Revenue (USD Million) By Country (2021-2032)
Figure 13. United Kingdom Hickory Revenue (USD Million) By Country (2021-2032)
Figure 14. Spain Hickory Revenue (USD Million) By Country (2021-2032)
Figure 15. Italy Hickory Revenue (USD Million) By Country (2021-2032)
Figure 16. Russia Hickory Revenue (USD Million) By Country (2021-2032)
Figure 17. Rest of Europe Hickory Revenue (USD Million) By Country (2021-2032)
Figure 11. Asia Pacific Hickory Revenue (USD Million) By Country (2021-2032)
Figure 12. China Hickory Revenue (USD Million) By Country (2021-2032)
Figure 13. Japan Hickory Revenue (USD Million) By Country (2021-2032)
Figure 14. India Hickory Revenue (USD Million) By Country (2021-2032)
Figure 15. South Korea Hickory Revenue (USD Million) By Country (2021-2032)
Figure 16. Australia Hickory Revenue (USD Million) By Country (2021-2032)
Figure 17. South East Asia Hickory Revenue (USD Million) By Country (2021-2032)
Figure 18. South America Hickory Revenue (USD Million) By Country (2021-2032)
Figure 19. Brazil Hickory Revenue (USD Million) By Country (2021-2032)
Figure 20. Argentina Hickory Revenue (USD Million) By Country (2021-2032)
Figure 21. Rest of Asia Pacific Hickory Revenue (USD Million) By Country (2021-2032)
Figure 22. Middle East and Africa Hickory Revenue (USD Million) By Region (2021-2032)
Figure 23. Saudi Arabia Hickory Revenue (USD Million) By Region (2021-2032)
Figure 24. The UAE Hickory Revenue (USD Million) By Region (2021-2032)
Figure 25. Rest of Middle East Hickory Revenue (USD Million) By Region (2021-2032)
Figure 26. South Africa Hickory Revenue (USD Million) By Region (2021-2032)
Figure 27. Africa Hickory Revenue (USD Million) By Region (2021-2032)
Figure 28. North America Hickory Revenue (USD Million) By Type (2021-2032)
Figure 29. North America Hickory Revenue (USD Million) By Application (2021-2032)
Figure 30. North America Hickory Revenue (USD Million) By Product (2021-2032)
Figure 31. Europe Hickory Revenue (USD Million) By Type (2021-2032)
Figure 32. Europe Hickory Revenue (USD Million) By Application (2021-2032)
Figure 33. Europe Hickory Revenue (USD Million) By Product (2021-2032)
Figure 34. Asia Pacific Hickory Revenue (USD Million) By Type (2021-2032)
Figure 35. Asia Pacific Hickory Revenue (USD Million) By Application (2021-2032)
Figure 36. Asia Pacific Hickory Revenue (USD Million) By Product (2021-2032)
Figure 37. South America Hickory Revenue (USD Million) By Type (2021-2032)
Figure 38. South America Hickory Revenue (USD Million) By Application (2021-2032)
Figure 39. South America Hickory Revenue (USD Million) By Product (2021-2032)
Figure 40. Middle East and Africa Hickory Revenue (USD Million) By Type (2021-2032)
Figure 41. Middle East and Africa Hickory Revenue (USD Million) By Application (2021-2032)
Figure 42. Middle East and Africa Hickory Revenue (USD Million) By Product (2021-2032)
By Product
In-shell Pecans
Shelled Pecans
By End-User
Ready to eat
Confectionery & Bakery
Others
Countries Analyzed
North America (US, Canada, Mexico)
Europe (Germany, UK, France, Spain, Italy, Russia, Rest of Europe)
Asia Pacific (China, India, Japan, South Korea, Australia, South East Asia, Rest of Asia)
South America (Brazil, Argentina, Rest of South America)
Middle East and Africa (Saudi Arabia, UAE, Rest of Middle East, South Africa, Egypt, Rest of Africa)
