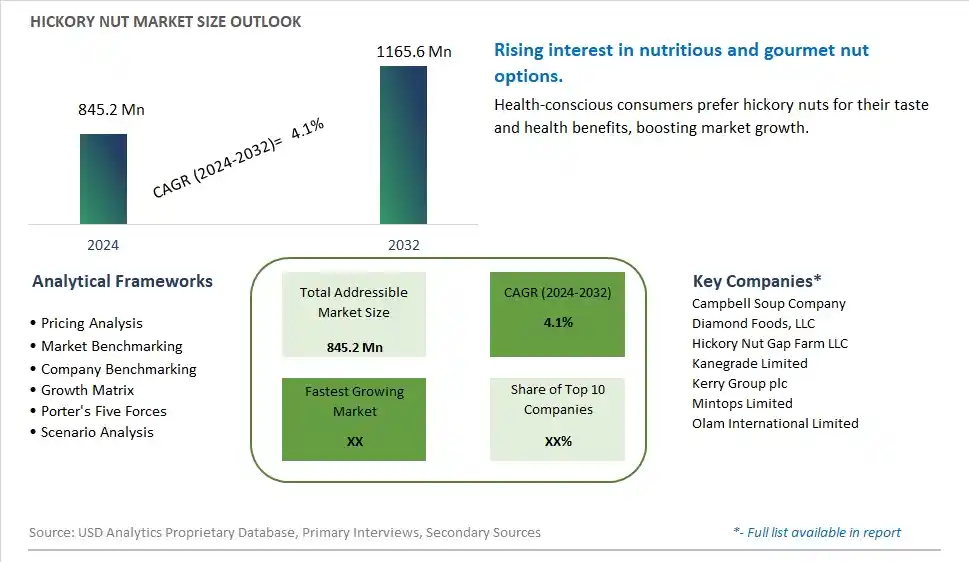
Global Hickory Nut Market Size is valued at $845.2 Million in 2024 and is forecast to register a growth rate (CAGR) of 4.1% to reach $1165.6 Million by 2032.
The global Hickory Nut Market Comprehensive Study analyzes and forecasts the market size across 6 regions and 24 countries for diverse segments -By Type (Bitternut, Shellbark, Shagbark, Pignut), By Application (Bakery Products, Snacks and Bars, Beverages, Confectionaries, Others)
An Introduction to Hickory Nut Market
The Hickory Nut market in 2024 is experiencing significant growth, driven by the rising demand for nutritious and flavorful nuts. Hickory nuts, valued for their rich taste and high nutrient content, are popular in culinary applications and as a healthy snack option. The market benefits from advancements in nut harvesting and processing technologies, the growing trend of health-conscious eating, and the expansion of the global nut sector. Additionally, the increasing awareness of the health benefits of hickory nuts, such as their high levels of healthy fats and antioxidants, is contributing to market growth.
Hickory Nut Competitive Landscape
The market report analyses the leading companies in the industry including Campbell Soup Company, Diamond Foods, LLC, Hickory Nut Gap Farm LLC, Kanegrade Limited, Kerry Group plc, Mintops Limited, Olam International Limited, and Others.
Hickory Nut Market Dynamics
Hickory Nut Market Trend: Rising Popularity of Nut-Based Ingredients
The most prominent trend in the Hickory Nut Market is the rising popularity of nut-based ingredients. As consumers seek healthier and more versatile food options, hickory nuts are gaining traction for their rich flavor and nutritional benefits. This trend is driven by the increasing interest in plant-based diets and the desire for natural and minimally processed ingredients that offer multiple health benefits.
Hickory Nut Market Driver: Increase in Health and Wellness Consciousness
The key driver of the Hickory Nut Market is the increase in health and wellness consciousness. As more people focus on maintaining a balanced diet and incorporating nutrient-dense foods into their meals, there is a higher demand for nuts that offer essential nutrients, such as hickory nuts. This driver is supported by the trend towards clean-label products and the increasing use of hickory nuts in various food and beverage applications, driving market growth.
Hickory Nut Market Opportunity: Expansion into New Product Categories and Applications
A significant opportunity in the Hickory Nut Market lies in the expansion into new product categories and applications. By developing innovative products that incorporate hickory nuts, such as snacks, dairy alternatives, and baked goods, companies can attract health-conscious consumers. Offering high-quality hickory nut products that provide multiple health benefits can help expand market reach and drive growth in the functional food sector.
Hickory Nut Market Share Analysis: Shagbark segment generated the highest revenue share in the industry
Shagbark is the largest segment in the Hickory Nut Market by type. Shagbark hickory nuts are highly valued for their rich, sweet flavor and nutritional benefits, making them a popular choice among consumers and food manufacturers. These nuts are versatile and can be used in a variety of culinary applications, from baking to cooking and snacking. The thick shell of the shagbark hickory nut protects the kernel, ensuring its freshness and quality, which is particularly appealing to both consumers and producers. The popularity of shagbark hickory nuts is also driven by their availability and the traditional use in various recipes, especially in regions where hickory trees are native. The combination of taste, nutritional value, and culinary versatility makes shagbark hickory nuts the dominant type in the market.
Hickory Nut Market Share Analysis: Snacks and Bars is the fastest growing segment over the forecast period to 2032
The snacks and bars segment is the fastest-growing segment in the Hickory Nut Market by application, projected to see significant growth by 2032. This rapid growth is fueled by the increasing consumer demand for healthy, convenient, and nutritious snack options. Hickory nuts are rich in protein, healthy fats, vitamins, and minerals, making them an ideal ingredient for energy bars and snacks aimed at health-conscious consumers. The trend towards clean eating and the preference for natural ingredients further boost the popularity of hickory nuts in this segment. Additionally, the innovation in snack bar formulations, which often include a mix of nuts, dried fruits, and seeds, has created more opportunities for incorporating hickory nuts. The portability and convenience of snacks and bars make them a perfect choice for busy lifestyles, driving their demand. As consumers continue to seek out healthy and on-the-go snack options, the snacks and bars segment is expected to experience robust growth, solidifying its position as the fastest-growing application in the hickory nut market.
Hickory Nut Market Segmentation
By Type
Bitternut
Shellbark
Shagbark
Pignut
By Application
Bakery Products
Snacks and Bars
Beverages
Confectionaries
Others
Countries Analyzed
North America (US, Canada, Mexico)
Europe (Germany, UK, France, Spain, Italy, Russia, Rest of Europe)
Asia Pacific (China, India, Japan, South Korea, Australia, South East Asia, Rest of Asia)
South America (Brazil, Argentina, Rest of South America)
Middle East and Africa (Saudi Arabia, UAE, Rest of Middle East, South Africa, Egypt, Rest of Africa)
Hickory Nut Companies Profiled in the Study
Campbell Soup Company
Diamond Foods, LLC
Hickory Nut Gap Farm LLC
Kanegrade Limited
Kerry Group plc
Mintops Limited
Olam International Limited
*- List Not Exhaustive
Chapter 1. TABLE OF CONTENTS
Chapter 2. Introduction to Hickory Nut Market
2.1. Market Overview
2.2. Key Statistics and Report Highlights
2.3. Scope of the Comprehensive Study
2.3.1. Market Definition
2.3.2 Countries and Regions Covered
2.3.3 Research Objective
2.3.4 Units, Currency, and Conversions
2.3.5 Industry Value Chain
2.4. Key Market Segments
2.5. Key Companies
2.6. Study Period
Chapter 3. Strategic Analysis Review
3.1. Hickory Nut Pricing Analysis and Forecast
3.2. Porter’s Five Forces
3.3. Market Ecosystem
3.4. SWOT Analysis
3.5. Regulatory Scenario
3.3. Effects of Inflation, Russia-Ukraine War, moderating economic growth, and other macroeconomic factors
Chapter 4. Competitive Landscape
4.1. Market Share Analysis
4.1.1. Global Hickory Nut Market Share by Company, 2023
4.1.2. Product Offerings of Leading Hickory Nut Companies
4.2. Market Entropy
4.2.1. New Product Launches in the Industry
4.2.2. Mergers, Acquisitions, Joint ventures, and Partnerships
4.3. Key Strategies and Best Practices
Chapter 5. Global Market Projections: Best, Reference, and Low Case Scenarios
5.1. Growth Analysis- Case Scenario Definitions
5.2. Low Growth Case Scenario Forecasts
5.3. Reference Growth Case Scenario Forecasts
5.4. High Growth Case Scenario Forecasts
Chapter 6. Market Dynamics
6.1. Hickory Nut Market Drivers
6.2. Hickory Nut Market Challenges
6.6. Hickory Nut Market Opportunities
6.4. Hickory Nut Market Trends
Chapter 7. Global Hickory Nut Market Outlook Trends
7.1. Global Hickory Nut Revenue (USD Million) and CAGR (%) by Type (2021-2032)
7.2. Global Hickory Nut Revenue (USD Million) and CAGR (%) by Application (2021-2032)
7.3. Global Hickory Nut Revenue (USD Million) and CAGR (%) by Product (2021-2032)
By Type
Bitternut
Shellbark
Shagbark
Pignut
By Application
Bakery Products
Snacks and Bars
Beverages
Confectionaries
Others
Chapter 8. Global Hickory Nut Regional Analysis and Outlook
8.1. Global Hickory Nut Revenue (USD Million) By Regions (2021- 2032)
8.2. North America Hickory Nut Revenue (USD Million) by Country (2021-2032)
8.2.1. United States Hickory Nut Regional Analysis and Outlook
8.2.2. Canada Hickory Nut Regional Analysis and Outlook
8.2.3. Mexico Hickory Nut Regional Analysis and Outlook
8.3. Europe Hickory Nut Revenue (USD Million), by Country (2021-2032)
8.3.1. Germany Hickory Nut Regional Analysis and Outlook
8.3.2. France Hickory Nut Regional Analysis and Outlook
8.3.3. United Kingdom Hickory Nut Regional Analysis and Outlook
8.3.4. Spain Hickory Nut Regional Analysis and Outlook
8.3.5. Italy Hickory Nut Regional Analysis and Outlook
8.3.6. Russia Hickory Nut Regional Analysis and Outlook
8.3.7. Rest of Europe Hickory Nut Regional Analysis and Outlook
8.4. Asia Pacific Hickory Nut Revenue (USD Million) by Country (2021-2032)
8.4.1. China Hickory Nut Regional Analysis and Outlook
8.4.2. Japan Hickory Nut Regional Analysis and Outlook
8.4.3. India Hickory Nut Regional Analysis and Outlook
8.4.4. South Korea Hickory Nut Regional Analysis and Outlook
8.4.5. Australia Hickory Nut Regional Analysis and Outlook
8.4.6. South East Asia Hickory Nut Regional Analysis and Outlook
8.4.7. Rest of Asia Pacific Hickory Nut Regional Analysis and Outlook
8.5. South America Hickory Nut Revenue (USD Million), by Country (2021-2032)
8.5.1. Brazil Hickory Nut Regional Analysis and Outlook
8.5.2. Argentina Hickory Nut Regional Analysis and Outlook
8.5.3. Rest of South America Hickory Nut Regional Analysis and Outlook
8.6. Middle East and Africa Hickory Nut Revenue (USD Million) by Country (2021-2032)
8.6.1. Middle East Hickory Nut Regional Analysis and Outlook
8.6.2. Africa Hickory Nut Regional Analysis and Outlook
Chapter 9. North America Hickory Nut Analysis and Outlook
9.1. North America Hickory Nut Revenue (USD Million) by Segments (2021-2032)
9.1.1. North America Hickory Nut Revenue (USD Million) by Type (2021-2032)
9.1.2. North America Hickory Nut Revenue (USD Million) by Application (2021-2032)
9.1.3. North America Hickory Nut Revenue (USD Million) by Product (2021-2032)
By Type
Bitternut
Shellbark
Shagbark
Pignut
By Application
Bakery Products
Snacks and Bars
Beverages
Confectionaries
Others
Chapter 10. Europe Hickory Nut Analysis and Outlook
10.1. Europe Hickory Nut Revenue (USD Million), by Segments (USD Million) (2021-2032)
10.1.1. Europe Hickory Nut Revenue (USD Million) by Type (2021-2032)
10.1.2. Europe Hickory Nut Revenue (USD Million) by Application (2021-2032)
10.1.3. Europe Hickory Nut Revenue (USD Million) by Product (2021-2032)
By Type
Bitternut
Shellbark
Shagbark
Pignut
By Application
Bakery Products
Snacks and Bars
Beverages
Confectionaries
Others
Chapter 11. Asia Pacific Hickory Nut Analysis and Outlook
11.1. Asia Pacific Hickory Nut Revenue (USD Million), and Revenue (USD Million) by Segments (2021-2032)
11.1.1. Asia Pacific Hickory Nut Revenue (USD Million) by Type (2021-2032)
11.1.2. Asia Pacific Hickory Nut Revenue (USD Million) by Application (2021-2032)
11.1.3. Asia Pacific Hickory Nut Revenue (USD Million) by Product (2021-2032)
By Type
Bitternut
Shellbark
Shagbark
Pignut
By Application
Bakery Products
Snacks and Bars
Beverages
Confectionaries
Others
Chapter 12. South America Hickory Nut Analysis and Outlook
12.1. South America Hickory Nut Revenue (USD Million), by Segments (2021-2032)
12.1.1. South America Hickory Nut Revenue (USD Million) by Type (2021-2032)
12.1.2. South America Hickory Nut Revenue (USD Million) by Application (2021-2032)
12.1.3. South America Hickory Nut Revenue (USD Million) by Product (2021-2032)
By Type
Bitternut
Shellbark
Shagbark
Pignut
By Application
Bakery Products
Snacks and Bars
Beverages
Confectionaries
Others
Chapter 13. Middle East and Africa Hickory Nut Analysis and Outlook
13.1. Middle East and Africa Hickory Nut Revenue (USD Million), by Segments (2021-2032)
13.1.1. Middle East and Africa Hickory Nut Revenue (USD Million) by Type (2021-2032)
13.1.2. Middle East and Africa Hickory Nut Revenue (USD Million) by Application (2021-2032)
13.1.3. Middle East and Africa Hickory Nut Revenue (USD Million) by Product (2021-2032)
By Type
Bitternut
Shellbark
Shagbark
Pignut
By Application
Bakery Products
Snacks and Bars
Beverages
Confectionaries
Others
Chapter 14. Hickory Nut Company Profiles
14.1 Business Overview
14.2 Product Profiles
14.3 SWOT Profiles
14.5 Recent Developments
14.6 Financial Profile
List of Companies
Campbell Soup Company
Diamond Foods, LLC
Hickory Nut Gap Farm LLC
Kanegrade Limited
Kerry Group plc
Mintops Limited
Olam International Limited
15. Methodology and Data Sources
15.1 Customization Offerings
15.2 Subscription Services
15.3 Related Reports
15.4 Publisher Expertise
LIST OF TABLES
Table 1 Market Segmentation Analysis
Table 2 Global Hickory Nut Market Share of Leading Companies, 2023
Table 3 Product Offerings of Leading Companies
Table 4 Low Growth Scenario Forecasts
Table 5 Reference Case Growth Scenario
Table 6 High Growth Case Scenario
Table 7 Global Hickory Nut Revenue (USD Million) And CAGR (%) By Type (2021-2032)
Table 8 Global Hickory Nut Revenue (USD Million) And CAGR (%) By Application (2021-2032)
Table 9 Global Hickory Nut Revenue (USD Million) And CAGR (%) By Product (2021-2032)
Table 10 Global Hickory Nut Market Revenue (USD Million) By Regions (2021-2032)
Table 11 Global Hickory Nut Market Share (%) By Regions (2021-2032)
Table 12 North America Hickory Nut Revenue (USD Million) By Country (2021-2032)
Table 13 Europe Hickory Nut Revenue (USD Million) By Country (2021-2032)
Table 14 Asia Pacific Hickory Nut Revenue (USD Million) By Country (2021-2032)
Table 15 South America Hickory Nut Revenue (USD Million) By Country (2021-2032)
Table 16 Middle East and Africa Hickory Nut Revenue (USD Million) By Region (2021-2032)
Table 17 North America Hickory Nut Revenue (USD Million) By Type (2021-2032)
Table 18 North America Hickory Nut Revenue (USD Million) By Application (2021-2032)
Table 19 North America Hickory Nut Revenue (USD Million) By Product (2021-2032)
Table 20 Europe Hickory Nut Revenue (USD Million) By Type (2021-2032)
Table 21 Europe Hickory Nut Revenue (USD Million) By Application (2021-2032)
Table 22 Europe Hickory Nut Revenue (USD Million) By Product (2021-2032)
Table 23 Asia Pacific Hickory Nut Revenue (USD Million) By Type (2021-2032)
Table 24 Asia Pacific Hickory Nut Revenue (USD Million) By Application (2021-2032)
Table 25 Asia Pacific Hickory Nut Revenue (USD Million) By Product (2021-2032)
Table 26 South America Hickory Nut Revenue (USD Million) By Type (2021-2032)
Table 27 South America Hickory Nut Revenue (USD Million) By Application (2021-2032)
Table 28 South America Hickory Nut Revenue (USD Million) By Product (2021-2032)
Table 29 Middle East and Africa Hickory Nut Revenue (USD Million) By Type (2021-2032)
Table 30 Middle East and Africa Hickory Nut Revenue (USD Million) By Application (2021-2032)
Table 31 Middle East and Africa Hickory Nut Revenue (USD Million) By Product (2021-2032)
LIST OF FIGURES
Figure 1. Market Scope
Figure 2. Pricing Forecasts Per Unit, 2023- 2032
Figure 3. Porter’s Five Forces
Figure 4. Global Hickory Nut Market Revenue (USD Million) By Regions (2021-2032)
Figure 5. Global Hickory Nut Market Share (%) By Regions (2023)
Figure 6. North America Hickory Nut Revenue (USD Million) By Country (2021-2032)
Figure 7. United States Hickory Nut Revenue (USD Million) By Country (2021-2032)
Figure 8. Canada Hickory Nut Revenue (USD Million) By Country (2021-2032)
Figure 9. Mexico Hickory Nut Revenue (USD Million) By Country (2021-2032)
Figure 10. Europe Hickory Nut Revenue (USD Million) By Country (2021-2032)
Figure 11. Germany Hickory Nut Revenue (USD Million) By Country (2021-2032)
Figure 12. France Hickory Nut Revenue (USD Million) By Country (2021-2032)
Figure 13. United Kingdom Hickory Nut Revenue (USD Million) By Country (2021-2032)
Figure 14. Spain Hickory Nut Revenue (USD Million) By Country (2021-2032)
Figure 15. Italy Hickory Nut Revenue (USD Million) By Country (2021-2032)
Figure 16. Russia Hickory Nut Revenue (USD Million) By Country (2021-2032)
Figure 17. Rest of Europe Hickory Nut Revenue (USD Million) By Country (2021-2032)
Figure 11. Asia Pacific Hickory Nut Revenue (USD Million) By Country (2021-2032)
Figure 12. China Hickory Nut Revenue (USD Million) By Country (2021-2032)
Figure 13. Japan Hickory Nut Revenue (USD Million) By Country (2021-2032)
Figure 14. India Hickory Nut Revenue (USD Million) By Country (2021-2032)
Figure 15. South Korea Hickory Nut Revenue (USD Million) By Country (2021-2032)
Figure 16. Australia Hickory Nut Revenue (USD Million) By Country (2021-2032)
Figure 17. South East Asia Hickory Nut Revenue (USD Million) By Country (2021-2032)
Figure 18. South America Hickory Nut Revenue (USD Million) By Country (2021-2032)
Figure 19. Brazil Hickory Nut Revenue (USD Million) By Country (2021-2032)
Figure 20. Argentina Hickory Nut Revenue (USD Million) By Country (2021-2032)
Figure 21. Rest of Asia Pacific Hickory Nut Revenue (USD Million) By Country (2021-2032)
Figure 22. Middle East and Africa Hickory Nut Revenue (USD Million) By Region (2021-2032)
Figure 23. Saudi Arabia Hickory Nut Revenue (USD Million) By Region (2021-2032)
Figure 24. The UAE Hickory Nut Revenue (USD Million) By Region (2021-2032)
Figure 25. Rest of Middle East Hickory Nut Revenue (USD Million) By Region (2021-2032)
Figure 26. South Africa Hickory Nut Revenue (USD Million) By Region (2021-2032)
Figure 27. Africa Hickory Nut Revenue (USD Million) By Region (2021-2032)
Figure 28. North America Hickory Nut Revenue (USD Million) By Type (2021-2032)
Figure 29. North America Hickory Nut Revenue (USD Million) By Application (2021-2032)
Figure 30. North America Hickory Nut Revenue (USD Million) By Product (2021-2032)
Figure 31. Europe Hickory Nut Revenue (USD Million) By Type (2021-2032)
Figure 32. Europe Hickory Nut Revenue (USD Million) By Application (2021-2032)
Figure 33. Europe Hickory Nut Revenue (USD Million) By Product (2021-2032)
Figure 34. Asia Pacific Hickory Nut Revenue (USD Million) By Type (2021-2032)
Figure 35. Asia Pacific Hickory Nut Revenue (USD Million) By Application (2021-2032)
Figure 36. Asia Pacific Hickory Nut Revenue (USD Million) By Product (2021-2032)
Figure 37. South America Hickory Nut Revenue (USD Million) By Type (2021-2032)
Figure 38. South America Hickory Nut Revenue (USD Million) By Application (2021-2032)
Figure 39. South America Hickory Nut Revenue (USD Million) By Product (2021-2032)
Figure 40. Middle East and Africa Hickory Nut Revenue (USD Million) By Type (2021-2032)
Figure 41. Middle East and Africa Hickory Nut Revenue (USD Million) By Application (2021-2032)
Figure 42. Middle East and Africa Hickory Nut Revenue (USD Million) By Product (2021-2032)
By Type
Bitternut
Shellbark
Shagbark
Pignut
By Application
Bakery Products
Snacks and Bars
Beverages
Confectionaries
Others
Countries Analyzed
North America (US, Canada, Mexico)
Europe (Germany, UK, France, Spain, Italy, Russia, Rest of Europe)
Asia Pacific (China, India, Japan, South Korea, Australia, South East Asia, Rest of Asia)
South America (Brazil, Argentina, Rest of South America)
Middle East and Africa (Saudi Arabia, UAE, Rest of Middle East, South Africa, Egypt, Rest of Africa)
