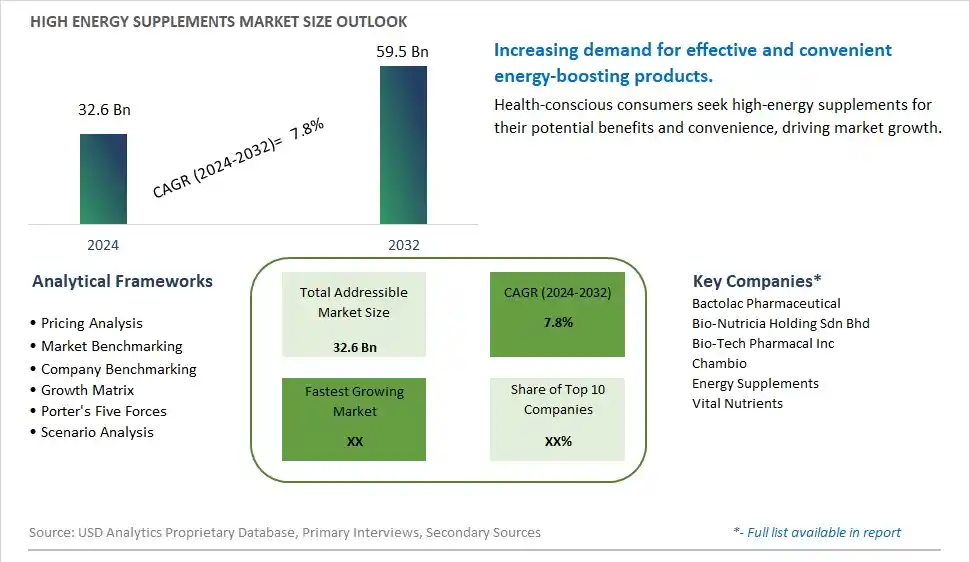
Global High Energy Supplements Market Size is valued at $32.6 Billion in 2024 and is forecast to register a growth rate (CAGR) of 7.8% to reach $59.5 Billion by 2032.
The global High Energy Supplements Market Comprehensive Study analyzes and forecasts the market size across 6 regions and 24 countries for diverse segments -By Type (Nutrient Supplement, Dietary Supplement), By Age Group (Children, Adult, Others)
An Introduction to High Energy Supplements Market
The High Energy Supplements market in 2024 is witnessing robust growth, driven by the rising demand for products that boost energy and enhance physical performance. High energy supplements, formulated with ingredients like caffeine, B vitamins, and amino acids, are popular among athletes, fitness enthusiasts, and busy professionals. The market benefits from advancements in supplement formulation and delivery technologies, the growing trend of health and wellness, and the expansion of the global nutraceutical sector. Additionally, the increasing awareness of the benefits of high energy supplements for sustained energy and mental alertness is contributing to market growth.
High Energy Supplements Competitive Landscape
The market report analyses the leading companies in the industry including Bactolac Pharmaceutical, Bio-Nutricia Holding Sdn Bhd, Bio-Tech Pharmacal Inc, Chambio, Energy Supplements, Vital Nutrients, and Others.
High Energy Supplements Market Dynamics
High Energy Supplements Market Trend: Increasing Demand for Natural and Effective Energy Supplements
The most prominent trend in the High Energy Supplements Market is the increasing demand for natural and effective energy supplements. As consumers seek products that provide a sustainable energy boost without synthetic ingredients, high energy supplements are gaining popularity for their natural formulations and health benefits. This trend is driven by the growing interest in health and wellness and the desire for supplements that offer clean-label and functional ingredients.
High Energy Supplements Market Driver: Growth in Health and Wellness Consciousness
The key driver of the High Energy Supplements Market is the growth in health and wellness consciousness. As more people focus on maintaining a balanced diet and improving their overall energy levels, there is a higher demand for supplements that offer essential nutrients and support sustained energy. This driver is supported by the trend towards clean-label products and the increasing availability of high energy supplements in the market, driving growth for this sector.
High Energy Supplements Market Opportunity: Innovation in Supplement Formulations and Delivery Formats
A significant opportunity in the High Energy Supplements Market lies in innovation in supplement formulations and delivery formats. By developing new and unique supplements that incorporate advanced energy-boosting ingredients, such as adaptogens, amino acids, and natural stimulants, companies can attract health-conscious consumers. Offering a variety of supplement formats, such as gummies, powders, and effervescent tablets, that cater to different preferences and lifestyles can help expand market reach and drive growth in the energy supplement sector.
High Energy Supplements Market Share Analysis: Dietary Supplement segment generated the highest revenue share in the industry
Dietary supplements are the largest segment in the High Energy Supplements Market by type. This segment's dominance is driven by the broad consumer base and the increasing awareness of the benefits of dietary supplements in supporting overall health and energy levels. Dietary supplements include vitamins, minerals, amino acids, and other nutritional components that help individuals meet their daily nutrient requirements, especially in today's fast-paced lifestyle where balanced diets are often neglected. The popularity of dietary supplements is also bolstered by the growing trend of preventive healthcare, where individuals proactively manage their health through supplementation. The wide availability of dietary supplements in various forms such as capsules, tablets, powders, and gummies, along with the extensive marketing efforts by manufacturers, further contributes to the segment's leading position in the market.
High Energy Supplements Market Share Analysis: Adult is the fastest growing segment over the forecast period to 2032
The adult segment is the fastest-growing segment in the High Energy Supplements Market by age group, projected to see significant growth by 2032. This rapid growth is fueled by the increasing demand for energy supplements among adults who lead busy, active lifestyles and seek to maintain high energy levels throughout the day. Adults, particularly working professionals, athletes, and fitness enthusiasts, are turning to high energy supplements to enhance their physical performance, mental alertness, and overall well-being. The growing awareness of the impact of lifestyle factors such as diet, stress, and physical activity on energy levels has led to a surge in the consumption of energy-boosting supplements. Additionally, the rise of the wellness trend and the focus on maintaining optimal health as one ages are driving the demand for energy supplements in this demographic. As more adults prioritize their health and seek convenient ways to boost their energy, the adult segment is expected to experience robust growth in the coming years.
High Energy Supplements Market Segmentation
By Type
Nutrient Supplement
Dietary Supplement
By Age Group
Children
Adult
Others
Countries Analyzed
North America (US, Canada, Mexico)
Europe (Germany, UK, France, Spain, Italy, Russia, Rest of Europe)
Asia Pacific (China, India, Japan, South Korea, Australia, South East Asia, Rest of Asia)
South America (Brazil, Argentina, Rest of South America)
Middle East and Africa (Saudi Arabia, UAE, Rest of Middle East, South Africa, Egypt, Rest of Africa)
High Energy Supplements Companies Profiled in the Study
Bactolac Pharmaceutical
Bio-Nutricia Holding Sdn Bhd
Bio-Tech Pharmacal Inc
Chambio
Energy Supplements
Vital Nutrients
*- List Not Exhaustive
Chapter 1. TABLE OF CONTENTS
Chapter 2. Introduction to High Energy Supplements Market
2.1. Market Overview
2.2. Key Statistics and Report Highlights
2.3. Scope of the Comprehensive Study
2.3.1. Market Definition
2.3.2 Countries and Regions Covered
2.3.3 Research Objective
2.3.4 Units, Currency, and Conversions
2.3.5 Industry Value Chain
2.4. Key Market Segments
2.5. Key Companies
2.6. Study Period
Chapter 3. Strategic Analysis Review
3.1. High Energy Supplements Pricing Analysis and Forecast
3.2. Porter’s Five Forces
3.3. Market Ecosystem
3.4. SWOT Analysis
3.5. Regulatory Scenario
3.3. Effects of Inflation, Russia-Ukraine War, moderating economic growth, and other macroeconomic factors
Chapter 4. Competitive Landscape
4.1. Market Share Analysis
4.1.1. Global High Energy Supplements Market Share by Company, 2023
4.1.2. Product Offerings of Leading High Energy Supplements Companies
4.2. Market Entropy
4.2.1. New Product Launches in the Industry
4.2.2. Mergers, Acquisitions, Joint ventures, and Partnerships
4.3. Key Strategies and Best Practices
Chapter 5. Global Market Projections: Best, Reference, and Low Case Scenarios
5.1. Growth Analysis- Case Scenario Definitions
5.2. Low Growth Case Scenario Forecasts
5.3. Reference Growth Case Scenario Forecasts
5.4. High Growth Case Scenario Forecasts
Chapter 6. Market Dynamics
6.1. High Energy Supplements Market Drivers
6.2. High Energy Supplements Market Challenges
6.6. High Energy Supplements Market Opportunities
6.4. High Energy Supplements Market Trends
Chapter 7. Global High Energy Supplements Market Outlook Trends
7.1. Global High Energy Supplements Revenue (USD Million) and CAGR (%) by Type (2021-2032)
7.2. Global High Energy Supplements Revenue (USD Million) and CAGR (%) by Application (2021-2032)
7.3. Global High Energy Supplements Revenue (USD Million) and CAGR (%) by Product (2021-2032)
By Type
Nutrient Supplement
Dietary Supplement
By Age Group
Children
Adult
Others
Chapter 8. Global High Energy Supplements Regional Analysis and Outlook
8.1. Global High Energy Supplements Revenue (USD Million) By Regions (2021- 2032)
8.2. North America High Energy Supplements Revenue (USD Million) by Country (2021-2032)
8.2.1. United States High Energy Supplements Regional Analysis and Outlook
8.2.2. Canada High Energy Supplements Regional Analysis and Outlook
8.2.3. Mexico High Energy Supplements Regional Analysis and Outlook
8.3. Europe High Energy Supplements Revenue (USD Million), by Country (2021-2032)
8.3.1. Germany High Energy Supplements Regional Analysis and Outlook
8.3.2. France High Energy Supplements Regional Analysis and Outlook
8.3.3. United Kingdom High Energy Supplements Regional Analysis and Outlook
8.3.4. Spain High Energy Supplements Regional Analysis and Outlook
8.3.5. Italy High Energy Supplements Regional Analysis and Outlook
8.3.6. Russia High Energy Supplements Regional Analysis and Outlook
8.3.7. Rest of Europe High Energy Supplements Regional Analysis and Outlook
8.4. Asia Pacific High Energy Supplements Revenue (USD Million) by Country (2021-2032)
8.4.1. China High Energy Supplements Regional Analysis and Outlook
8.4.2. Japan High Energy Supplements Regional Analysis and Outlook
8.4.3. India High Energy Supplements Regional Analysis and Outlook
8.4.4. South Korea High Energy Supplements Regional Analysis and Outlook
8.4.5. Australia High Energy Supplements Regional Analysis and Outlook
8.4.6. South East Asia High Energy Supplements Regional Analysis and Outlook
8.4.7. Rest of Asia Pacific High Energy Supplements Regional Analysis and Outlook
8.5. South America High Energy Supplements Revenue (USD Million), by Country (2021-2032)
8.5.1. Brazil High Energy Supplements Regional Analysis and Outlook
8.5.2. Argentina High Energy Supplements Regional Analysis and Outlook
8.5.3. Rest of South America High Energy Supplements Regional Analysis and Outlook
8.6. Middle East and Africa High Energy Supplements Revenue (USD Million) by Country (2021-2032)
8.6.1. Middle East High Energy Supplements Regional Analysis and Outlook
8.6.2. Africa High Energy Supplements Regional Analysis and Outlook
Chapter 9. North America High Energy Supplements Analysis and Outlook
9.1. North America High Energy Supplements Revenue (USD Million) by Segments (2021-2032)
9.1.1. North America High Energy Supplements Revenue (USD Million) by Type (2021-2032)
9.1.2. North America High Energy Supplements Revenue (USD Million) by Application (2021-2032)
9.1.3. North America High Energy Supplements Revenue (USD Million) by Product (2021-2032)
By Type
Nutrient Supplement
Dietary Supplement
By Age Group
Children
Adult
Others
Chapter 10. Europe High Energy Supplements Analysis and Outlook
10.1. Europe High Energy Supplements Revenue (USD Million), by Segments (USD Million) (2021-2032)
10.1.1. Europe High Energy Supplements Revenue (USD Million) by Type (2021-2032)
10.1.2. Europe High Energy Supplements Revenue (USD Million) by Application (2021-2032)
10.1.3. Europe High Energy Supplements Revenue (USD Million) by Product (2021-2032)
By Type
Nutrient Supplement
Dietary Supplement
By Age Group
Children
Adult
Others
Chapter 11. Asia Pacific High Energy Supplements Analysis and Outlook
11.1. Asia Pacific High Energy Supplements Revenue (USD Million), and Revenue (USD Million) by Segments (2021-2032)
11.1.1. Asia Pacific High Energy Supplements Revenue (USD Million) by Type (2021-2032)
11.1.2. Asia Pacific High Energy Supplements Revenue (USD Million) by Application (2021-2032)
11.1.3. Asia Pacific High Energy Supplements Revenue (USD Million) by Product (2021-2032)
By Type
Nutrient Supplement
Dietary Supplement
By Age Group
Children
Adult
Others
Chapter 12. South America High Energy Supplements Analysis and Outlook
12.1. South America High Energy Supplements Revenue (USD Million), by Segments (2021-2032)
12.1.1. South America High Energy Supplements Revenue (USD Million) by Type (2021-2032)
12.1.2. South America High Energy Supplements Revenue (USD Million) by Application (2021-2032)
12.1.3. South America High Energy Supplements Revenue (USD Million) by Product (2021-2032)
By Type
Nutrient Supplement
Dietary Supplement
By Age Group
Children
Adult
Others
Chapter 13. Middle East and Africa High Energy Supplements Analysis and Outlook
13.1. Middle East and Africa High Energy Supplements Revenue (USD Million), by Segments (2021-2032)
13.1.1. Middle East and Africa High Energy Supplements Revenue (USD Million) by Type (2021-2032)
13.1.2. Middle East and Africa High Energy Supplements Revenue (USD Million) by Application (2021-2032)
13.1.3. Middle East and Africa High Energy Supplements Revenue (USD Million) by Product (2021-2032)
By Type
Nutrient Supplement
Dietary Supplement
By Age Group
Children
Adult
Others
Chapter 14. High Energy Supplements Company Profiles
14.1 Business Overview
14.2 Product Profiles
14.3 SWOT Profiles
14.5 Recent Developments
14.6 Financial Profile
List of Companies
Bactolac Pharmaceutical
Bio-Nutricia Holding Sdn Bhd
Bio-Tech Pharmacal Inc
Chambio
Energy Supplements
Vital Nutrients
15. Methodology and Data Sources
15.1 Customization Offerings
15.2 Subscription Services
15.3 Related Reports
15.4 Publisher Expertise
LIST OF TABLES
Table 1 Market Segmentation Analysis
Table 2 Global High Energy Supplements Market Share of Leading Companies, 2023
Table 3 Product Offerings of Leading Companies
Table 4 Low Growth Scenario Forecasts
Table 5 Reference Case Growth Scenario
Table 6 High Growth Case Scenario
Table 7 Global High Energy Supplements Revenue (USD Million) And CAGR (%) By Type (2021-2032)
Table 8 Global High Energy Supplements Revenue (USD Million) And CAGR (%) By Application (2021-2032)
Table 9 Global High Energy Supplements Revenue (USD Million) And CAGR (%) By Product (2021-2032)
Table 10 Global High Energy Supplements Market Revenue (USD Million) By Regions (2021-2032)
Table 11 Global High Energy Supplements Market Share (%) By Regions (2021-2032)
Table 12 North America High Energy Supplements Revenue (USD Million) By Country (2021-2032)
Table 13 Europe High Energy Supplements Revenue (USD Million) By Country (2021-2032)
Table 14 Asia Pacific High Energy Supplements Revenue (USD Million) By Country (2021-2032)
Table 15 South America High Energy Supplements Revenue (USD Million) By Country (2021-2032)
Table 16 Middle East and Africa High Energy Supplements Revenue (USD Million) By Region (2021-2032)
Table 17 North America High Energy Supplements Revenue (USD Million) By Type (2021-2032)
Table 18 North America High Energy Supplements Revenue (USD Million) By Application (2021-2032)
Table 19 North America High Energy Supplements Revenue (USD Million) By Product (2021-2032)
Table 20 Europe High Energy Supplements Revenue (USD Million) By Type (2021-2032)
Table 21 Europe High Energy Supplements Revenue (USD Million) By Application (2021-2032)
Table 22 Europe High Energy Supplements Revenue (USD Million) By Product (2021-2032)
Table 23 Asia Pacific High Energy Supplements Revenue (USD Million) By Type (2021-2032)
Table 24 Asia Pacific High Energy Supplements Revenue (USD Million) By Application (2021-2032)
Table 25 Asia Pacific High Energy Supplements Revenue (USD Million) By Product (2021-2032)
Table 26 South America High Energy Supplements Revenue (USD Million) By Type (2021-2032)
Table 27 South America High Energy Supplements Revenue (USD Million) By Application (2021-2032)
Table 28 South America High Energy Supplements Revenue (USD Million) By Product (2021-2032)
Table 29 Middle East and Africa High Energy Supplements Revenue (USD Million) By Type (2021-2032)
Table 30 Middle East and Africa High Energy Supplements Revenue (USD Million) By Application (2021-2032)
Table 31 Middle East and Africa High Energy Supplements Revenue (USD Million) By Product (2021-2032)
LIST OF FIGURES
Figure 1. Market Scope
Figure 2. Pricing Forecasts Per Unit, 2023- 2032
Figure 3. Porter’s Five Forces
Figure 4. Global High Energy Supplements Market Revenue (USD Million) By Regions (2021-2032)
Figure 5. Global High Energy Supplements Market Share (%) By Regions (2023)
Figure 6. North America High Energy Supplements Revenue (USD Million) By Country (2021-2032)
Figure 7. United States High Energy Supplements Revenue (USD Million) By Country (2021-2032)
Figure 8. Canada High Energy Supplements Revenue (USD Million) By Country (2021-2032)
Figure 9. Mexico High Energy Supplements Revenue (USD Million) By Country (2021-2032)
Figure 10. Europe High Energy Supplements Revenue (USD Million) By Country (2021-2032)
Figure 11. Germany High Energy Supplements Revenue (USD Million) By Country (2021-2032)
Figure 12. France High Energy Supplements Revenue (USD Million) By Country (2021-2032)
Figure 13. United Kingdom High Energy Supplements Revenue (USD Million) By Country (2021-2032)
Figure 14. Spain High Energy Supplements Revenue (USD Million) By Country (2021-2032)
Figure 15. Italy High Energy Supplements Revenue (USD Million) By Country (2021-2032)
Figure 16. Russia High Energy Supplements Revenue (USD Million) By Country (2021-2032)
Figure 17. Rest of Europe High Energy Supplements Revenue (USD Million) By Country (2021-2032)
Figure 11. Asia Pacific High Energy Supplements Revenue (USD Million) By Country (2021-2032)
Figure 12. China High Energy Supplements Revenue (USD Million) By Country (2021-2032)
Figure 13. Japan High Energy Supplements Revenue (USD Million) By Country (2021-2032)
Figure 14. India High Energy Supplements Revenue (USD Million) By Country (2021-2032)
Figure 15. South Korea High Energy Supplements Revenue (USD Million) By Country (2021-2032)
Figure 16. Australia High Energy Supplements Revenue (USD Million) By Country (2021-2032)
Figure 17. South East Asia High Energy Supplements Revenue (USD Million) By Country (2021-2032)
Figure 18. South America High Energy Supplements Revenue (USD Million) By Country (2021-2032)
Figure 19. Brazil High Energy Supplements Revenue (USD Million) By Country (2021-2032)
Figure 20. Argentina High Energy Supplements Revenue (USD Million) By Country (2021-2032)
Figure 21. Rest of Asia Pacific High Energy Supplements Revenue (USD Million) By Country (2021-2032)
Figure 22. Middle East and Africa High Energy Supplements Revenue (USD Million) By Region (2021-2032)
Figure 23. Saudi Arabia High Energy Supplements Revenue (USD Million) By Region (2021-2032)
Figure 24. The UAE High Energy Supplements Revenue (USD Million) By Region (2021-2032)
Figure 25. Rest of Middle East High Energy Supplements Revenue (USD Million) By Region (2021-2032)
Figure 26. South Africa High Energy Supplements Revenue (USD Million) By Region (2021-2032)
Figure 27. Africa High Energy Supplements Revenue (USD Million) By Region (2021-2032)
Figure 28. North America High Energy Supplements Revenue (USD Million) By Type (2021-2032)
Figure 29. North America High Energy Supplements Revenue (USD Million) By Application (2021-2032)
Figure 30. North America High Energy Supplements Revenue (USD Million) By Product (2021-2032)
Figure 31. Europe High Energy Supplements Revenue (USD Million) By Type (2021-2032)
Figure 32. Europe High Energy Supplements Revenue (USD Million) By Application (2021-2032)
Figure 33. Europe High Energy Supplements Revenue (USD Million) By Product (2021-2032)
Figure 34. Asia Pacific High Energy Supplements Revenue (USD Million) By Type (2021-2032)
Figure 35. Asia Pacific High Energy Supplements Revenue (USD Million) By Application (2021-2032)
Figure 36. Asia Pacific High Energy Supplements Revenue (USD Million) By Product (2021-2032)
Figure 37. South America High Energy Supplements Revenue (USD Million) By Type (2021-2032)
Figure 38. South America High Energy Supplements Revenue (USD Million) By Application (2021-2032)
Figure 39. South America High Energy Supplements Revenue (USD Million) By Product (2021-2032)
Figure 40. Middle East and Africa High Energy Supplements Revenue (USD Million) By Type (2021-2032)
Figure 41. Middle East and Africa High Energy Supplements Revenue (USD Million) By Application (2021-2032)
Figure 42. Middle East and Africa High Energy Supplements Revenue (USD Million) By Product (2021-2032)
By Type
Nutrient Supplement
Dietary Supplement
By Age Group
Children
Adult
Others
Countries Analyzed
North America (US, Canada, Mexico)
Europe (Germany, UK, France, Spain, Italy, Russia, Rest of Europe)
Asia Pacific (China, India, Japan, South Korea, Australia, South East Asia, Rest of Asia)
South America (Brazil, Argentina, Rest of South America)
Middle East and Africa (Saudi Arabia, UAE, Rest of Middle East, South Africa, Egypt, Rest of Africa)
