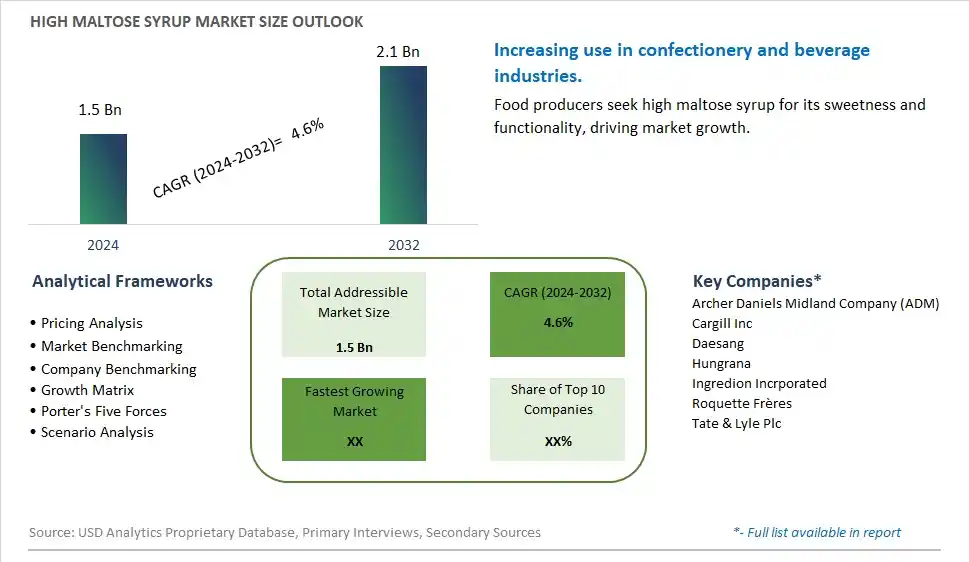
Global High Maltose Syrup Market Size is valued at $1.5 Billion in 2024 and is forecast to register a growth rate (CAGR) of 4.6% to reach $2.1 Billion by 2032.
The global High Maltose Syrup Market Comprehensive Study analyzes and forecasts the market size across 6 regions and 24 countries for diverse segments -By Type (Corn, Potatoes, Wheat, Rice Starch), By Application (Baking, Brewing Industry, Soft Drink Industry, Frozen Desserts)
An Introduction to High Maltose Syrup Market
In 2024, the High Maltose Syrup market is experiencing significant growth, driven by the rising demand for sweeteners with specific functional properties. High maltose syrup, used in confectionery, baking, and brewing, offers desirable characteristics such as high sweetness and low viscosity. The market benefits from advancements in starch processing and enzymatic conversion technologies, the growing trend of functional and specialty ingredients, and the expansion of the global food and beverage sector. Additionally, the increasing focus on clean label and natural sweeteners is contributing to market growth.
High Maltose Syrup Competitive Landscape
The market report analyses the leading companies in the industry including Archer Daniels Midland Company (ADM), Cargill Inc, Daesang, Hungrana, Ingredion Incrporated, Roquette Frères, Tate & Lyle Plc, and Others.
High Maltose Syrup Market Dynamics
High Maltose Syrup Market Trend: Increasing Use in Food and Beverage Industry
The most prominent trend in the High Maltose Syrup Market is the increasing use of high maltose syrup in the food and beverage industry. High maltose syrup, known for its sweetening properties and ability to enhance texture, is becoming a preferred ingredient in various applications, including confectionery, bakery products, and beverages. This trend is driven by the demand for cost-effective and versatile sweeteners that can improve product quality and shelf life.
High Maltose Syrup Market Driver: Demand for Processed and Convenience Foods
A key driver in the High Maltose Syrup Market is the growing demand for processed and convenience foods. As consumers lead busier lifestyles, there is a rising preference for ready-to-eat and easy-to-prepare food products. High maltose syrup plays a crucial role in the production of these foods, offering benefits such as improved flavor, texture, and stability. This demand is further fueled by the expansion of the food processing industry, particularly in emerging markets.
High Maltose Syrup Market Opportunity: Development of Healthier Formulations
One significant opportunity in the High Maltose Syrup Market lies in the development of healthier formulations. As consumers become more health-conscious, there is a growing demand for sweeteners that offer reduced calorie content and lower glycemic index. Companies can capitalize on this opportunity by creating high maltose syrup variants that cater to these health trends, such as low-calorie or natural versions, thus attracting a wider consumer base and enhancing market growth.
High Maltose Syrup Market Share Analysis: Corn segment generated the highest revenue share in the industry
Corn is the largest segment in the High Maltose Syrup Market by type. The dominance of corn-derived high maltose syrup is driven by its widespread availability, cost-effectiveness, and favorable processing characteristics. Corn is a staple crop in many parts of the world, particularly in North America, where it is abundantly grown and readily processed into various starch products. High maltose syrup produced from corn starch is extensively used in the food and beverage industry due to its excellent fermentability, sweetness, and ability to extend the shelf life of products. It is a key ingredient in many applications, including baking, brewing, and confectionery, where it provides desirable properties such as a mild flavor, clear appearance, and stable performance under different conditions. The well-established infrastructure for corn processing and the continuous advancements in extraction and refinement technologies further support the leading position of corn in the high maltose syrup market.
High Maltose Syrup Market Share Analysis: Brewing Industry is the fastest growing segment over the forecast period to 2032
The brewing industry is the fastest-growing segment in the High Maltose Syrup Market by application, projected to see significant growth by 2032. This growth is fueled by the increasing demand for beer and other malt beverages globally. High maltose syrup is preferred in brewing due to its high fermentable sugar content, which enhances the fermentation process, leading to higher alcohol yield and improved taste profiles in the final product. The brewing industry benefits from the use of high maltose syrup as it ensures consistent quality and efficiency in production. Additionally, the rising popularity of craft beers and the expansion of microbreweries have driven the demand for high-quality ingredients, including high maltose syrup. As consumers continue to explore diverse and innovative beer flavors, the brewing industry is expected to increasingly rely on high maltose syrup to meet the growing market demand, driving the rapid growth of this segment.
High Maltose Syrup Market Segmentation
By Type
Corn
Potatoes
Wheat
Rice Starch
By Application
Baking
Brewing Industry
Soft Drink Industry
Frozen Desserts
Countries Analyzed
North America (US, Canada, Mexico)
Europe (Germany, UK, France, Spain, Italy, Russia, Rest of Europe)
Asia Pacific (China, India, Japan, South Korea, Australia, South East Asia, Rest of Asia)
South America (Brazil, Argentina, Rest of South America)
Middle East and Africa (Saudi Arabia, UAE, Rest of Middle East, South Africa, Egypt, Rest of Africa)
High Maltose Syrup Companies Profiled in the Study
Archer Daniels Midland Company (ADM)
Cargill Inc
Daesang
Hungrana
Ingredion Incrporated
Roquette Frères
Tate & Lyle Plc
*- List Not Exhaustive
Chapter 1. TABLE OF CONTENTS
Chapter 2. Introduction to High Maltose Syrup Market
2.1. Market Overview
2.2. Key Statistics and Report Highlights
2.3. Scope of the Comprehensive Study
2.3.1. Market Definition
2.3.2 Countries and Regions Covered
2.3.3 Research Objective
2.3.4 Units, Currency, and Conversions
2.3.5 Industry Value Chain
2.4. Key Market Segments
2.5. Key Companies
2.6. Study Period
Chapter 3. Strategic Analysis Review
3.1. High Maltose Syrup Pricing Analysis and Forecast
3.2. Porter’s Five Forces
3.3. Market Ecosystem
3.4. SWOT Analysis
3.5. Regulatory Scenario
3.3. Effects of Inflation, Russia-Ukraine War, moderating economic growth, and other macroeconomic factors
Chapter 4. Competitive Landscape
4.1. Market Share Analysis
4.1.1. Global High Maltose Syrup Market Share by Company, 2023
4.1.2. Product Offerings of Leading High Maltose Syrup Companies
4.2. Market Entropy
4.2.1. New Product Launches in the Industry
4.2.2. Mergers, Acquisitions, Joint ventures, and Partnerships
4.3. Key Strategies and Best Practices
Chapter 5. Global Market Projections: Best, Reference, and Low Case Scenarios
5.1. Growth Analysis- Case Scenario Definitions
5.2. Low Growth Case Scenario Forecasts
5.3. Reference Growth Case Scenario Forecasts
5.4. High Growth Case Scenario Forecasts
Chapter 6. Market Dynamics
6.1. High Maltose Syrup Market Drivers
6.2. High Maltose Syrup Market Challenges
6.6. High Maltose Syrup Market Opportunities
6.4. High Maltose Syrup Market Trends
Chapter 7. Global High Maltose Syrup Market Outlook Trends
7.1. Global High Maltose Syrup Revenue (USD Million) and CAGR (%) by Type (2021-2032)
7.2. Global High Maltose Syrup Revenue (USD Million) and CAGR (%) by Application (2021-2032)
7.3. Global High Maltose Syrup Revenue (USD Million) and CAGR (%) by Product (2021-2032)
By Type
Corn
Potatoes
Wheat
Rice Starch
By Application
Baking
Brewing Industry
Soft Drink Industry
Frozen Desserts
Chapter 8. Global High Maltose Syrup Regional Analysis and Outlook
8.1. Global High Maltose Syrup Revenue (USD Million) By Regions (2021- 2032)
8.2. North America High Maltose Syrup Revenue (USD Million) by Country (2021-2032)
8.2.1. United States High Maltose Syrup Regional Analysis and Outlook
8.2.2. Canada High Maltose Syrup Regional Analysis and Outlook
8.2.3. Mexico High Maltose Syrup Regional Analysis and Outlook
8.3. Europe High Maltose Syrup Revenue (USD Million), by Country (2021-2032)
8.3.1. Germany High Maltose Syrup Regional Analysis and Outlook
8.3.2. France High Maltose Syrup Regional Analysis and Outlook
8.3.3. United Kingdom High Maltose Syrup Regional Analysis and Outlook
8.3.4. Spain High Maltose Syrup Regional Analysis and Outlook
8.3.5. Italy High Maltose Syrup Regional Analysis and Outlook
8.3.6. Russia High Maltose Syrup Regional Analysis and Outlook
8.3.7. Rest of Europe High Maltose Syrup Regional Analysis and Outlook
8.4. Asia Pacific High Maltose Syrup Revenue (USD Million) by Country (2021-2032)
8.4.1. China High Maltose Syrup Regional Analysis and Outlook
8.4.2. Japan High Maltose Syrup Regional Analysis and Outlook
8.4.3. India High Maltose Syrup Regional Analysis and Outlook
8.4.4. South Korea High Maltose Syrup Regional Analysis and Outlook
8.4.5. Australia High Maltose Syrup Regional Analysis and Outlook
8.4.6. South East Asia High Maltose Syrup Regional Analysis and Outlook
8.4.7. Rest of Asia Pacific High Maltose Syrup Regional Analysis and Outlook
8.5. South America High Maltose Syrup Revenue (USD Million), by Country (2021-2032)
8.5.1. Brazil High Maltose Syrup Regional Analysis and Outlook
8.5.2. Argentina High Maltose Syrup Regional Analysis and Outlook
8.5.3. Rest of South America High Maltose Syrup Regional Analysis and Outlook
8.6. Middle East and Africa High Maltose Syrup Revenue (USD Million) by Country (2021-2032)
8.6.1. Middle East High Maltose Syrup Regional Analysis and Outlook
8.6.2. Africa High Maltose Syrup Regional Analysis and Outlook
Chapter 9. North America High Maltose Syrup Analysis and Outlook
9.1. North America High Maltose Syrup Revenue (USD Million) by Segments (2021-2032)
9.1.1. North America High Maltose Syrup Revenue (USD Million) by Type (2021-2032)
9.1.2. North America High Maltose Syrup Revenue (USD Million) by Application (2021-2032)
9.1.3. North America High Maltose Syrup Revenue (USD Million) by Product (2021-2032)
By Type
Corn
Potatoes
Wheat
Rice Starch
By Application
Baking
Brewing Industry
Soft Drink Industry
Frozen Desserts
Chapter 10. Europe High Maltose Syrup Analysis and Outlook
10.1. Europe High Maltose Syrup Revenue (USD Million), by Segments (USD Million) (2021-2032)
10.1.1. Europe High Maltose Syrup Revenue (USD Million) by Type (2021-2032)
10.1.2. Europe High Maltose Syrup Revenue (USD Million) by Application (2021-2032)
10.1.3. Europe High Maltose Syrup Revenue (USD Million) by Product (2021-2032)
By Type
Corn
Potatoes
Wheat
Rice Starch
By Application
Baking
Brewing Industry
Soft Drink Industry
Frozen Desserts
Chapter 11. Asia Pacific High Maltose Syrup Analysis and Outlook
11.1. Asia Pacific High Maltose Syrup Revenue (USD Million), and Revenue (USD Million) by Segments (2021-2032)
11.1.1. Asia Pacific High Maltose Syrup Revenue (USD Million) by Type (2021-2032)
11.1.2. Asia Pacific High Maltose Syrup Revenue (USD Million) by Application (2021-2032)
11.1.3. Asia Pacific High Maltose Syrup Revenue (USD Million) by Product (2021-2032)
By Type
Corn
Potatoes
Wheat
Rice Starch
By Application
Baking
Brewing Industry
Soft Drink Industry
Frozen Desserts
Chapter 12. South America High Maltose Syrup Analysis and Outlook
12.1. South America High Maltose Syrup Revenue (USD Million), by Segments (2021-2032)
12.1.1. South America High Maltose Syrup Revenue (USD Million) by Type (2021-2032)
12.1.2. South America High Maltose Syrup Revenue (USD Million) by Application (2021-2032)
12.1.3. South America High Maltose Syrup Revenue (USD Million) by Product (2021-2032)
By Type
Corn
Potatoes
Wheat
Rice Starch
By Application
Baking
Brewing Industry
Soft Drink Industry
Frozen Desserts
Chapter 13. Middle East and Africa High Maltose Syrup Analysis and Outlook
13.1. Middle East and Africa High Maltose Syrup Revenue (USD Million), by Segments (2021-2032)
13.1.1. Middle East and Africa High Maltose Syrup Revenue (USD Million) by Type (2021-2032)
13.1.2. Middle East and Africa High Maltose Syrup Revenue (USD Million) by Application (2021-2032)
13.1.3. Middle East and Africa High Maltose Syrup Revenue (USD Million) by Product (2021-2032)
By Type
Corn
Potatoes
Wheat
Rice Starch
By Application
Baking
Brewing Industry
Soft Drink Industry
Frozen Desserts
Chapter 14. High Maltose Syrup Company Profiles
14.1 Business Overview
14.2 Product Profiles
14.3 SWOT Profiles
14.5 Recent Developments
14.6 Financial Profile
List of Companies
Archer Daniels Midland Company (ADM)
Cargill Inc
Daesang
Hungrana
Ingredion Incrporated
Roquette Frères
Tate & Lyle Plc
15. Methodology and Data Sources
15.1 Customization Offerings
15.2 Subscription Services
15.3 Related Reports
15.4 Publisher Expertise
LIST OF TABLES
Table 1 Market Segmentation Analysis
Table 2 Global High Maltose Syrup Market Share of Leading Companies, 2023
Table 3 Product Offerings of Leading Companies
Table 4 Low Growth Scenario Forecasts
Table 5 Reference Case Growth Scenario
Table 6 High Growth Case Scenario
Table 7 Global High Maltose Syrup Revenue (USD Million) And CAGR (%) By Type (2021-2032)
Table 8 Global High Maltose Syrup Revenue (USD Million) And CAGR (%) By Application (2021-2032)
Table 9 Global High Maltose Syrup Revenue (USD Million) And CAGR (%) By Product (2021-2032)
Table 10 Global High Maltose Syrup Market Revenue (USD Million) By Regions (2021-2032)
Table 11 Global High Maltose Syrup Market Share (%) By Regions (2021-2032)
Table 12 North America High Maltose Syrup Revenue (USD Million) By Country (2021-2032)
Table 13 Europe High Maltose Syrup Revenue (USD Million) By Country (2021-2032)
Table 14 Asia Pacific High Maltose Syrup Revenue (USD Million) By Country (2021-2032)
Table 15 South America High Maltose Syrup Revenue (USD Million) By Country (2021-2032)
Table 16 Middle East and Africa High Maltose Syrup Revenue (USD Million) By Region (2021-2032)
Table 17 North America High Maltose Syrup Revenue (USD Million) By Type (2021-2032)
Table 18 North America High Maltose Syrup Revenue (USD Million) By Application (2021-2032)
Table 19 North America High Maltose Syrup Revenue (USD Million) By Product (2021-2032)
Table 20 Europe High Maltose Syrup Revenue (USD Million) By Type (2021-2032)
Table 21 Europe High Maltose Syrup Revenue (USD Million) By Application (2021-2032)
Table 22 Europe High Maltose Syrup Revenue (USD Million) By Product (2021-2032)
Table 23 Asia Pacific High Maltose Syrup Revenue (USD Million) By Type (2021-2032)
Table 24 Asia Pacific High Maltose Syrup Revenue (USD Million) By Application (2021-2032)
Table 25 Asia Pacific High Maltose Syrup Revenue (USD Million) By Product (2021-2032)
Table 26 South America High Maltose Syrup Revenue (USD Million) By Type (2021-2032)
Table 27 South America High Maltose Syrup Revenue (USD Million) By Application (2021-2032)
Table 28 South America High Maltose Syrup Revenue (USD Million) By Product (2021-2032)
Table 29 Middle East and Africa High Maltose Syrup Revenue (USD Million) By Type (2021-2032)
Table 30 Middle East and Africa High Maltose Syrup Revenue (USD Million) By Application (2021-2032)
Table 31 Middle East and Africa High Maltose Syrup Revenue (USD Million) By Product (2021-2032)
LIST OF FIGURES
Figure 1. Market Scope
Figure 2. Pricing Forecasts Per Unit, 2023- 2032
Figure 3. Porter’s Five Forces
Figure 4. Global High Maltose Syrup Market Revenue (USD Million) By Regions (2021-2032)
Figure 5. Global High Maltose Syrup Market Share (%) By Regions (2023)
Figure 6. North America High Maltose Syrup Revenue (USD Million) By Country (2021-2032)
Figure 7. United States High Maltose Syrup Revenue (USD Million) By Country (2021-2032)
Figure 8. Canada High Maltose Syrup Revenue (USD Million) By Country (2021-2032)
Figure 9. Mexico High Maltose Syrup Revenue (USD Million) By Country (2021-2032)
Figure 10. Europe High Maltose Syrup Revenue (USD Million) By Country (2021-2032)
Figure 11. Germany High Maltose Syrup Revenue (USD Million) By Country (2021-2032)
Figure 12. France High Maltose Syrup Revenue (USD Million) By Country (2021-2032)
Figure 13. United Kingdom High Maltose Syrup Revenue (USD Million) By Country (2021-2032)
Figure 14. Spain High Maltose Syrup Revenue (USD Million) By Country (2021-2032)
Figure 15. Italy High Maltose Syrup Revenue (USD Million) By Country (2021-2032)
Figure 16. Russia High Maltose Syrup Revenue (USD Million) By Country (2021-2032)
Figure 17. Rest of Europe High Maltose Syrup Revenue (USD Million) By Country (2021-2032)
Figure 11. Asia Pacific High Maltose Syrup Revenue (USD Million) By Country (2021-2032)
Figure 12. China High Maltose Syrup Revenue (USD Million) By Country (2021-2032)
Figure 13. Japan High Maltose Syrup Revenue (USD Million) By Country (2021-2032)
Figure 14. India High Maltose Syrup Revenue (USD Million) By Country (2021-2032)
Figure 15. South Korea High Maltose Syrup Revenue (USD Million) By Country (2021-2032)
Figure 16. Australia High Maltose Syrup Revenue (USD Million) By Country (2021-2032)
Figure 17. South East Asia High Maltose Syrup Revenue (USD Million) By Country (2021-2032)
Figure 18. South America High Maltose Syrup Revenue (USD Million) By Country (2021-2032)
Figure 19. Brazil High Maltose Syrup Revenue (USD Million) By Country (2021-2032)
Figure 20. Argentina High Maltose Syrup Revenue (USD Million) By Country (2021-2032)
Figure 21. Rest of Asia Pacific High Maltose Syrup Revenue (USD Million) By Country (2021-2032)
Figure 22. Middle East and Africa High Maltose Syrup Revenue (USD Million) By Region (2021-2032)
Figure 23. Saudi Arabia High Maltose Syrup Revenue (USD Million) By Region (2021-2032)
Figure 24. The UAE High Maltose Syrup Revenue (USD Million) By Region (2021-2032)
Figure 25. Rest of Middle East High Maltose Syrup Revenue (USD Million) By Region (2021-2032)
Figure 26. South Africa High Maltose Syrup Revenue (USD Million) By Region (2021-2032)
Figure 27. Africa High Maltose Syrup Revenue (USD Million) By Region (2021-2032)
Figure 28. North America High Maltose Syrup Revenue (USD Million) By Type (2021-2032)
Figure 29. North America High Maltose Syrup Revenue (USD Million) By Application (2021-2032)
Figure 30. North America High Maltose Syrup Revenue (USD Million) By Product (2021-2032)
Figure 31. Europe High Maltose Syrup Revenue (USD Million) By Type (2021-2032)
Figure 32. Europe High Maltose Syrup Revenue (USD Million) By Application (2021-2032)
Figure 33. Europe High Maltose Syrup Revenue (USD Million) By Product (2021-2032)
Figure 34. Asia Pacific High Maltose Syrup Revenue (USD Million) By Type (2021-2032)
Figure 35. Asia Pacific High Maltose Syrup Revenue (USD Million) By Application (2021-2032)
Figure 36. Asia Pacific High Maltose Syrup Revenue (USD Million) By Product (2021-2032)
Figure 37. South America High Maltose Syrup Revenue (USD Million) By Type (2021-2032)
Figure 38. South America High Maltose Syrup Revenue (USD Million) By Application (2021-2032)
Figure 39. South America High Maltose Syrup Revenue (USD Million) By Product (2021-2032)
Figure 40. Middle East and Africa High Maltose Syrup Revenue (USD Million) By Type (2021-2032)
Figure 41. Middle East and Africa High Maltose Syrup Revenue (USD Million) By Application (2021-2032)
Figure 42. Middle East and Africa High Maltose Syrup Revenue (USD Million) By Product (2021-2032)
By Type
Corn
Potatoes
Wheat
Rice Starch
By Application
Baking
Brewing Industry
Soft Drink Industry
Frozen Desserts
Countries Analyzed
North America (US, Canada, Mexico)
Europe (Germany, UK, France, Spain, Italy, Russia, Rest of Europe)
Asia Pacific (China, India, Japan, South Korea, Australia, South East Asia, Rest of Asia)
South America (Brazil, Argentina, Rest of South America)
Middle East and Africa (Saudi Arabia, UAE, Rest of Middle East, South Africa, Egypt, Rest of Africa)
