
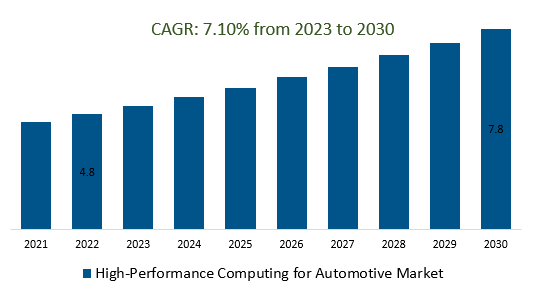
The global High-Performance Computing for Automotive Market Size is estimated to be US$4.8 Billion in 2023 and is poised to register 7.1% growth over the forecast period from 2023 to 2030 to reach US$7.8 Billion in 2030.
The market growth is driven predominantly by HPC facilitates the development of sophisticated algorithms for perception, decision-making, and control in autonomous vehicles. Higher performance computing for automotive accelerates EV battery design, range optimization, and charging infrastructure development.
High-Performance Computing (HPC) drives automotive innovation, powering autonomous driving, simulation-based design, electric vehicle advancement, real-time data processing for safety systems, connected vehicles, cybersecurity, and regulatory compliance. It fosters collaborations, personalization, sustainability, and supply chain optimization, reshaping vehicle development and performance across the industry.
Autonomous Driving Development within the High-Performance Computing (HPC) Automotive Market entails leveraging robust computational capabilities for real-time data fusion, sensor analysis, decision-making algorithms, and simulation-based testing. HPC accelerates the evolution of autonomous vehicles by processing immense data streams, optimizing AI-driven navigation, ensuring safety through virtual scenarios, and refining complex algorithms that drive the future of self-driving technology.
High-Performance Computing (HPC) is pivotal in Electric Vehicle (EV) development within the Automotive Market, advancing battery technology, optimizing range, enhancing charging systems, improving energy recovery and thermal management, driving lightweight materials, refining powertrains, addressing noise and vibration challenges, and enabling efficient data analysis and machine learning for predictive maintenance and performance optimization. HPC's role accelerates innovation in electric mobility, shaping the future of sustainable transportation.
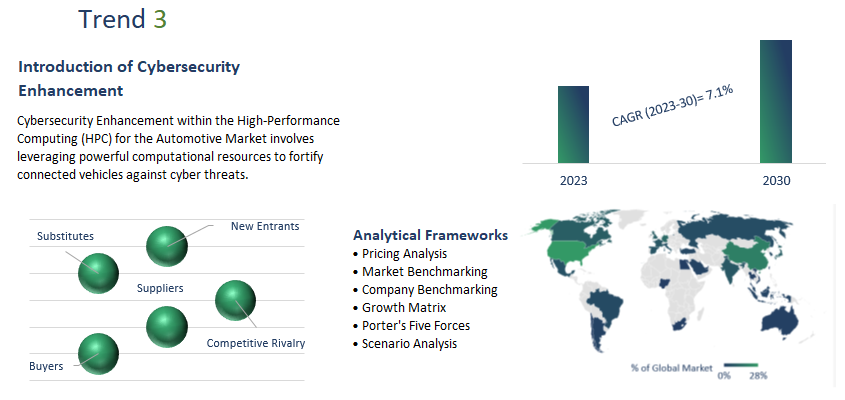
Cybersecurity Enhancement within the High-Performance Computing (HPC) for the Automotive Market involves leveraging powerful computational resources to fortify connected vehicles against cyber threats. HPC enables the development of robust intrusion detection systems, encryption algorithms, and anomaly detection methods, ensuring the integrity and safety of vehicle systems and data. By simulating potential attacks and vulnerabilities, HPC aids in identifying and addressing weaknesses, ultimately fostering secure communication, data protection, and trust in the evolving landscape of connected and autonomous vehicles.
Autopilot System: The Autopilot System within the High-Performance Computing (HPC) for the Automotive Market refers to advanced driver assistance and automation technologies that use HPC capabilities to enable vehicles to perform tasks typically handled by a human driver. Utilizing extensive sensor inputs, real-time data analysis, and sophisticated algorithms, HPC-driven Autopilot Systems provide functionalities such as adaptive cruise control, lane-keeping, automatic braking, and even partial autonomous driving. These systems rely on high-performance computing to process and interpret vast amounts of sensor data, enabling safer and more efficient driving experiences, reducing driver workload, and paving the way for higher levels of vehicle automation in the future.
Automotive Internet: The concept of "Automotive Internet" within the High-Performance Computing (HPC) for the Automotive Market refers to the integration of high-speed, reliable, and secure internet connectivity into vehicles. HPC plays a crucial role in enabling this connectivity by processing and managing the vast amount of data exchanged between vehicles, infrastructure, and external services. This connectivity allows vehicles to access real-time traffic information, navigation updates, software updates, entertainment services, and even interact with other vehicles (V2V) and infrastructure (V2X) for enhanced safety and efficiency. HPC-driven Automotive Internet transforms vehicles into connected platforms, enhancing driving experiences, enabling advanced driver assistance systems, and supporting the development of autonomous driving technologies.
By Type
By Application
By Region
Key Players
Leading companies profiled in the study include-
High-Performance Computing for Automotive Market Outlook 2023
1 Market Overview
1.1 Introduction to High-Performance Computing for Automotive Market
1.2 Scope of the Study
1.3 Research Objective
1.3.1 Key Market Scope and Segments
1.3.2 Players Covered
1.3.3 Years Considered
2 Executive Summary
2.1 2023 High-Performance Computing for Automotive Industry- Market Statistics
3 Market Dynamics
3.1 Market Drivers
3.2 Market Challenges
3.3 Market Opportunities
3.4 Market Trends
4 Market Factor Analysis
4.1 Porter’s Five Forces
4.2 Market Entropy
4.2.1 Global High-Performance Computing for Automotive Market Companies with Area Served
4.2.2 Products Offerings Global High-Performance Computing for Automotive Market
5 COVID-19 Impact Analysis and Outlook Scenarios
5.1.1 Covid-19 Impact Analysis
5.1.2 Post-COVID-19 Scenario- Low Growth Case
5.1.3 Post-COVID-19 Scenario- Reference Growth Case
5.1.4 Post-COVID-19 Scenario- Low Growth Case
6 Global High-Performance Computing for Automotive Market Trends
6.1 Global High-Performance Computing for Automotive Revenue (USD Million) and CAGR (%) by Type (2018-2030)
6.2 Global High-Performance Computing for Automotive Revenue (USD Million) and CAGR (%) by Applications (2018-2030)
6.3 Global High-Performance Computing for Automotive Revenue (USD Million) and CAGR (%) by Regions (2018-2030)
7 Global High-Performance Computing for Automotive Market Revenue (USD Million) by Type, and Applications (2018-2022)
7.1 Global High-Performance Computing for Automotive Revenue (USD Million) by Type (2018-2022)
7.1.1 Global High-Performance Computing for Automotive Revenue (USD Million), Market Share (%) by Type (2018-2022)
7.2 Global High-Performance Computing for Automotive Revenue (USD Million) by Applications (2018-2022)
7.2.1 Global High-Performance Computing for Automotive Revenue (USD Million), Market Share (%) by Applications (2018-2022)
8 Global High-Performance Computing for Automotive Development Regional Status and Outlook
8.1 Global High-Performance Computing for Automotive Revenue (USD Million) By Regions (2018-2022)
8.2 North America High-Performance Computing for Automotive Revenue (USD Million) by Type, and Application (2018-2022)
8.2.1 North America High-Performance Computing for Automotive Revenue (USD Million) by Country (2018-2022)
8.2.2 North America High-Performance Computing for Automotive Revenue (USD Million) by Type (2018-2022)
8.2.3 North America High-Performance Computing for Automotive Revenue (USD Million) by Applications (2018-2022)
8.3 Europe High-Performance Computing for Automotive Revenue (USD Million), by Type, and Applications (USD Million) (2018-2022)
8.3.1 Europe High-Performance Computing for Automotive Revenue (USD Million), by Country (2018-2022)
8.3.2 Europe High-Performance Computing for Automotive Revenue (USD Million) by Type (2018-2022)
8.3.3 Europe High-Performance Computing for Automotive Revenue (USD Million) by Applications (2018-2022)
8.4 Asia Pacific High-Performance Computing for Automotive Revenue (USD Million), and Revenue (USD Million) by Type, and Applications (2018-2022)
8.4.1 Asia Pacific High-Performance Computing for Automotive Revenue (USD Million) by Country (2018-2022)
8.4.2 Asia Pacific High-Performance Computing for Automotive Revenue (USD Million) by Type (2018-2022)
8.4.3 Asia Pacific High-Performance Computing for Automotive Revenue (USD Million) by Applications (2018-2022)
8.5 South America High-Performance Computing for Automotive Revenue (USD Million), by Type, and Applications (2018-2022)
8.5.1 South America High-Performance Computing for Automotive Revenue (USD Million), by Country (2018-2022)
8.5.2 South America High-Performance Computing for Automotive Revenue (USD Million) by Type (2018-2022)
8.5.3 South America High-Performance Computing for Automotive Revenue (USD Million) by Applications (2018-2022)
8.6 Middle East and Africa High-Performance Computing for Automotive Revenue (USD Million), by Type, Technology, Application, Thickness (2018-2022)
8.6.1 Middle East and Africa High-Performance Computing for Automotive Revenue (USD Million) by Country (2018-2022)
8.6.2 Middle East and Africa High-Performance Computing for Automotive Revenue (USD Million) by Type (2018-2022)
8.6.3 Middle East and Africa High-Performance Computing for Automotive Revenue (USD Million) by Applications (2018-2022)
9 Company Profiles
10 Global High-Performance Computing for Automotive Market Revenue (USD Million), by Type, and Applications (2023-2030)
10.1 Global High-Performance Computing for Automotive Revenue (USD Million) and Market Share (%) by Type (2023-2030)
10.1.1 Global High-Performance Computing for Automotive Revenue (USD Million), and Market Share (%) by Type (2023-2030)
10.2 Global High-Performance Computing for Automotive Revenue (USD Million) and Market Share (%) by Applications (2023-2030)
10.2.1 Global High-Performance Computing for Automotive Revenue (USD Million), and Market Share (%) by Applications (2023-2030)
11 Global High-Performance Computing for Automotive Development Regional Status and Outlook Forecast
11.1 Global High-Performance Computing for Automotive Revenue (USD Million) By Regions (2023-2030)
11.2 North America High-Performance Computing for Automotive Revenue (USD Million) by Type, and Applications (2023-2030)
11.2.1 North America High-Performance Computing for Automotive Revenue (USD) Million by Country (2023-2030)
11.2.2 North America High-Performance Computing for Automotive Revenue (USD Million), by Type (2023-2030)
11.2.3 North America High-Performance Computing for Automotive Revenue (USD Million), Market Share (%) by Applications (2023-2030)
11.3 Europe High-Performance Computing for Automotive Revenue (USD Million), by Type, and Applications (2023-2030)
11.3.1 Europe High-Performance Computing for Automotive Revenue (USD Million), by Country (2023-2030)
11.3.2 Europe High-Performance Computing for Automotive Revenue (USD Million), by Type (2023-2030)
11.3.3 Europe High-Performance Computing for Automotive Revenue (USD Million), by Applications (2023-2030)
11.4 Asia Pacific High-Performance Computing for Automotive Revenue (USD Million) by Type, and Applications (2023-2030)
11.4.1 Asia Pacific High-Performance Computing for Automotive Revenue (USD Million), by Country (2023-2030)
11.4.2 Asia Pacific High-Performance Computing for Automotive Revenue (USD Million), by Type (2023-2030)
11.4.3 Asia Pacific High-Performance Computing for Automotive Revenue (USD Million), by Applications (2023-2030)
11.5 South America High-Performance Computing for Automotive Revenue (USD Million), by Type, and Applications (2023-2030)
11.5.1 South America High-Performance Computing for Automotive Revenue (USD Million), by Country (2023-2030)
11.5.2 South America High-Performance Computing for Automotive Revenue (USD Million), by Type (2023-2030)
11.5.3 South America High-Performance Computing for Automotive Revenue (USD Million), by Applications (2023-2030)
11.6 Middle East and Africa High-Performance Computing for Automotive Revenue (USD Million), by Type, and Applications (2023-2030)
11.6.1 Middle East and Africa High-Performance Computing for Automotive Revenue (USD Million), by Region (2023-2030)
11.6.2 Middle East and Africa High-Performance Computing for Automotive Revenue (USD Million), by Type (2023-2030)
11.6.3 Middle East and Africa High-Performance Computing for Automotive Revenue (USD Million), by Applications (2023-2030)
12 Methodology and Data Sources
12.1 Methodology/Research Approach
12.1.1 Research Programs/Design
12.1.2 Market Size Estimation
12.1.3 Market Breakdown and Data Triangulation
12.2 Data Sources
12.2.1 Secondary Sources
12.2.2 Primary Sources
12.3 Disclaimer
List Of Tables
Table 1 Market Segmentation Analysis
Table 2 Global High-Performance Computing for Automotive Market Companies with Areas Served
Table 3 Products Offerings Global High-Performance Computing for Automotive Market
Table 4 Low Growth Scenario Forecasts
Table 5 Reference Case Growth Scenario
Table 6 High Growth Case Scenario
Table 7 Global High-Performance Computing for Automotive Revenue (USD Million) And CAGR (%) By Type (2018-2030)
Table 8 Global High-Performance Computing for Automotive Revenue (USD Million) And CAGR (%) By Applications (2018-2030)
Table 9 Global High-Performance Computing for Automotive Revenue (USD Million) And CAGR (%) By Regions (2018-2030)
Table 10 Global High-Performance Computing for Automotive Revenue (USD Million) By Type (2018-2022)
Table 11 Global High-Performance Computing for Automotive Revenue Market Share (%) By Type (2018-2022)
Table 12 Global High-Performance Computing for Automotive Revenue (USD Million) By Applications (2018-2022)
Table 13 Global High-Performance Computing for Automotive Revenue Market Share (%) By Applications (2018-2022)
Table 14 Global High-Performance Computing for Automotive Market Revenue (USD Million) By Regions (2018-2022)
Table 15 Global High-Performance Computing for Automotive Market Share (%) By Regions (2018-2022)
Table 16 North America High-Performance Computing for Automotive Revenue (USD Million) By Country (2018-2022)
Table 17 North America High-Performance Computing for Automotive Revenue (USD Million) By Type (2018-2022)
Table 18 North America High-Performance Computing for Automotive Revenue (USD Million) By Applications (2018-2022)
Table 19 Europe High-Performance Computing for Automotive Revenue (USD Million) By Country (2018-2022)
Table 20 Europe High-Performance Computing for Automotive Revenue (USD Million) By Type (2018-2022)
Table 21 Europe High-Performance Computing for Automotive Revenue (USD Million) By Applications (2018-2022)
Table 22 Asia Pacific High-Performance Computing for Automotive Revenue (USD Million) By Country (2018-2022)
Table 23 Asia Pacific High-Performance Computing for Automotive Revenue (USD Million) By Type (2018-2022)
Table 24 Asia Pacific High-Performance Computing for Automotive Revenue (USD Million) By Applications (2018-2022)
Table 25 South America High-Performance Computing for Automotive Revenue (USD Million) By Country (2018-2022)
Table 26 South America High-Performance Computing for Automotive Revenue (USD Million) By Type (2018-2022)
Table 27 South America High-Performance Computing for Automotive Revenue (USD Million) By Applications (2018-2022)
Table 28 Middle East and Africa High-Performance Computing for Automotive Revenue (USD Million) By Region (2018-2022)
Table 29 Middle East and Africa High-Performance Computing for Automotive Revenue (USD Million) By Type (2018-2022)
Table 30 Middle East and Africa High-Performance Computing for Automotive Revenue (USD Million) By Applications (2018-2022)
Table 31 Financial Analysis
Table 32 Global High-Performance Computing for Automotive Revenue (USD Million) By Type (2023-2030)
Table 33 Global High-Performance Computing for Automotive Revenue Market Share (%) By Type (2023-2030)
Table 34 Global High-Performance Computing for Automotive Revenue (USD Million) By Applications (2023-2030)
Table 35 Global High-Performance Computing for Automotive Revenue Market Share (%) By Applications (2023-2030)
Table 36 Global High-Performance Computing for Automotive Market Revenue (USD Million), And Revenue (USD Million) By Regions (2023-2030)
Table 37 North America High-Performance Computing for Automotive Revenue (USD)By Country (2023-2030)
Table 38 North America High-Performance Computing for Automotive Revenue (USD Million) By Type (2023-2030)
Table 39 North America High-Performance Computing for Automotive Revenue (USD Million) By Applications (2023-2030)
Table 40 Europe High-Performance Computing for Automotive Revenue (USD Million) By Country (2023-2030)
Table 41 Europe High-Performance Computing for Automotive Revenue (USD Million) By Type (2023-2030)
Table 42 Europe High-Performance Computing for Automotive Revenue (USD Million) By Applications (2023-2030)
Table 43 Asia Pacific High-Performance Computing for Automotive Revenue (USD Million) By Country (2023-2030)
Table 44 Asia Pacific High-Performance Computing for Automotive Revenue (USD Million) By Type (2023-2030)
Table 45 Asia Pacific High-Performance Computing for Automotive Revenue (USD Million) By Applications (2023-2030)
Table 46 South America High-Performance Computing for Automotive Revenue (USD Million) By Country (2023-2030)
Table 47 South America High-Performance Computing for Automotive Revenue (USD Million) By Type (2023-2030)
Table 48 South America High-Performance Computing for Automotive Revenue (USD Million) By Applications (2023-2030)
Table 49 Middle East and Africa High-Performance Computing for Automotive Revenue (USD Million) By Region (2023-2030)
Table 50 Middle East and Africa High-Performance Computing for Automotive Revenue (USD Million) By Region (2023-2030)
Table 51 Middle East and Africa High-Performance Computing for Automotive Revenue (USD Million) By Type (2023-2030)
Table 52 Middle East and Africa High-Performance Computing for Automotive Revenue (USD Million) By Applications (2023-2030)
Table 53 Research Programs/Design for This Report
Table 54 Key Data Information from Secondary Sources
Table 55 Key Data Information from Primary Sources
List Of Figures
Figure 1 Market Scope
Figure 2 Porter’s Five Forces
Figure 3 Global High-Performance Computing for Automotive Revenue (USD Million) By Type (2018-2022)
Figure 4 Global High-Performance Computing for Automotive Revenue Market Share (%) By Type (2022)
Figure 5 Global High-Performance Computing for Automotive Revenue (USD Million) By Applications (2018-2022)
Figure 6 Global High-Performance Computing for Automotive Revenue Market Share (%) By Applications (2022)
Figure 7 Global High-Performance Computing for Automotive Market Revenue (USD Million) By Regions (2018-2022)
Figure 8 Global High-Performance Computing for Automotive Market Share (%) By Regions (2022)
Figure 9 North America High-Performance Computing for Automotive Revenue (USD Million) By Country (2018-2022)
Figure 10 North America High-Performance Computing for Automotive Revenue (USD Million) By Type (2018-2022)
Figure 11 North America High-Performance Computing for Automotive Revenue (USD Million) By Applications (2018-2022)
Figure 12 Europe High-Performance Computing for Automotive Revenue (USD Million) By Country (2018-2022)
Figure 13 Europe High-Performance Computing for Automotive Revenue (USD Million) By Type (2018-2022)
Figure 14 Europe High-Performance Computing for Automotive Revenue (USD Million) By Applications (2018-2022)
Figure 15 Asia Pacific High-Performance Computing for Automotive Revenue (USD Million) By Country (2018-2022)
Figure 16 Asia Pacific High-Performance Computing for Automotive Revenue (USD Million) By Type (2018-2022)
Figure 17 Asia Pacific High-Performance Computing for Automotive Revenue (USD Million) By Applications (2018-2022)
Figure 18 South America High-Performance Computing for Automotive Revenue (USD Million) By Country (2018-2022)
Figure 19 South America High-Performance Computing for Automotive Revenue (USD Million) By Type (2018-2022)
Figure 20 South America High-Performance Computing for Automotive Revenue (USD Million) By Applications (2018-2022)
Figure 21 Middle East and Africa High-Performance Computing for Automotive Revenue (USD Million) By Region (2018-2022)
Figure 22 Middle East and Africa High-Performance Computing for Automotive Revenue (USD Million) By Type (2018-2022)
Figure 23 Middle East and Africa High-Performance Computing for Automotive Revenue (USD Million) By Applications (2018-2022)
Figure 24 Global High-Performance Computing for Automotive Revenue (USD Million) By Type (2023-2030)
Figure 25 Global High-Performance Computing for Automotive Revenue Market Share (%) By Type (2030)
Figure 26 Global High-Performance Computing for Automotive Revenue (USD Million) By Applications (2023-2030)
Figure 27 Global High-Performance Computing for Automotive Revenue Market Share (%) By Applications (2030)
Figure 28 Global High-Performance Computing for Automotive Market Revenue (USD Million) By Regions (2023-2030)
Figure 29 North America High-Performance Computing for Automotive Revenue (USD Million) By Country (2023-2030)
Figure 30 North America High-Performance Computing for Automotive Revenue (USD Million) By Type (2023-2030)
Figure 31 North America High-Performance Computing for Automotive Revenue (USD Million) By Applications (2023-2030)
Figure 32 Europe High-Performance Computing for Automotive Revenue (USD Million) By Country (2023-2030)
Figure 33 Europe High-Performance Computing for Automotive Revenue (USD Million) By Type (2023-2030)
Figure 34 Europe High-Performance Computing for Automotive Revenue (USD Million) By Applications (2023-2030)
Figure 35 Asia Pacific High-Performance Computing for Automotive Revenue (USD Million) By Country (2023-2030)
Figure 36 Asia Pacific High-Performance Computing for Automotive Revenue (USD Million) By Type (2023-2030)
Figure 37 Asia Pacific High-Performance Computing for Automotive Revenue (USD Million) By Applications (2023-2030)
Figure 38 South America High-Performance Computing for Automotive Revenue (USD Million) By Country (2023-2030)
Figure 39 South America High-Performance Computing for Automotive Revenue (USD Million) By Type (2023-2030)
Figure 40 South America High-Performance Computing for Automotive Revenue (USD Million) By Applications (2023-2030)
Figure 41 Middle East and Africa High-Performance Computing for Automotive Revenue (USD Million) By Region (2023-2030)
Figure 42 Middle East and Africa High-Performance Computing for Automotive Revenue (USD Million) By Region (2023-2030)
Figure 43 Middle East and Africa High-Performance Computing for Automotive Revenue (USD Million) By Type (2023-2030)
Figure 44 Middle East and Africa High-Performance Computing for Automotive Revenue (USD Million) By Applications (2023-2030)
Figure 45 Bottom-Up and Top-Down Approaches For This Report
Figure 46 Data Triangulation
Market Segmentation
By Type
By Application
By Region