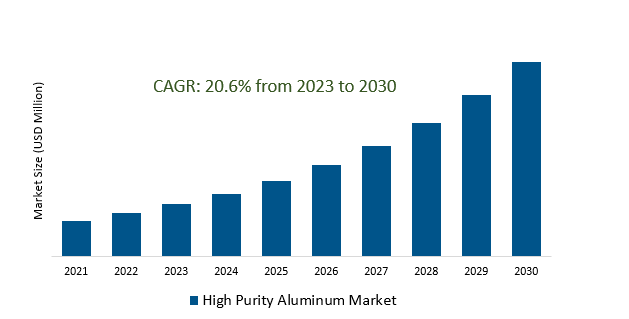
The High Purity Aluminum Market Size is estimated to register 20.65% growth over the forecast period from 2023 to 2030
High Purity Aluminum Market Overview
The growth in air travel and aerospace manufacturing is propelling the demand for high purity aluminum for aircraft manufacturing. As industries increasingly prioritize sustainable practices, recyclable nature and low environmental impact are contributing to the market demand in various applications. With the automotive industry's focus on lightweight materials to enhance fuel efficiency and reduce emissions, high purity aluminum is gaining traction for vehicle lightweighting applications. The growing demand for electronic devices, including smartphones, tablets, and computers are fueling the demand. Further, the medical industry is increasingly using HPA in applications such as medical implants and devices due to its biocompatibility, strength, and corrosion resistance. High electrical conductivity and durability are highly increasing the market in energy sector for power transmission lines and solar panels.
High Purity Aluminum Market Dynamics
Market Trends- Surging Demand in Electronics and Semiconductors Driving High Purity Aluminum Market.
The unique properties of high purity aluminum, particularly its exceptional electrical conductivity and resistance to corrosion are the prime factors.
HPA finds extensive application in manufacturing various electronic components owing to its capability to ensure reliable electrical performance, meeting the stringent quality standards required for sophisticated electronic applications.
Further, the rising adoption of electronic devices like smartphones, tablets, computers, and other gadgets are fueling the demand.
Market Driver- The automotive industry's focus on lightweighting drives the demand for high purity aluminum within the market.
Lightweight properties, coupled with its considerable strength are driving the manufacturers to adopt HPA in manufacturing lightweight automotive components to enhance fuel efficiency and reduce emissions.
Incorporation in the production of various vehicle parts, including body panels, engine components, and structural elements, aiming to reduce the overall weight of vehicles without compromising safety or performance are driving the market growth.
Further, automakers are continually striving to optimize vehicle performance and meet stringent regulatory standards to enhance the market growth.
Market Opportunity- Aerospace and Aviation Sector's Demand drives growth in High Purity Aluminum Market.
Extensive utilization in producing structural components, frames, and other critical parts of aircraft due to its lightweight and durable properties are the key factors.
The escalating demand for air travel catering to the stringent safety and performance requirements in aircraft construction, supporting the expanding aviation sector are fueling the market growth.
Further, Innovations in aircraft designs and reduced operational costs are contributing to its increased adoption in aerospace manufacturing.
Market Share Analysis- Semiconductors and Electronics will register the fastest growth.
The High Purity Aluminum Market is analyzed across Aeronautical Industry, Chemical Industry, Semiconductors and Electronics, 3d Printing, Others. Semiconductors and Electronics is poised to register the fastest growth. In the Semiconductor sector, high purity aluminum is extensively used for producing sapphire substrates used in LED (Light Emitting Diode) manufacturing. These substrates, made from high purity aluminum oxide (alumina), provide a base for LED chip production, offering exceptional thermal conductivity and electrical insulation properties vital for efficient LED performance. The Electronics industry also relies on high purity aluminum in various applications. It is used in the production of electronic capacitors, where aluminum with stringent purity levels is necessary to ensure reliability and stability in electronic devices. Additionally, high purity aluminum is employed in other electronic components and assemblies where its exceptional electrical properties are vital.
Market Share Analysis- Granules held a significant market share in 2023.
The High Purity Aluminum Market is analyzed across various forms including Pellets, Ingots, Granules & Others. Of these, Granules held a significant market share in 2023. Granules offer versatility and are favored for their adaptability across various industries and applications. Their distinct attributes, such as excellent flow characteristics, uniform composition, and ease of handling, make them preferred in specialized manufacturing processes. Industries like aerospace, automotive, electronics, and 3D printing utilize high purity aluminum granules due to their ability to meet precise purity and alloying requirements. These granules are often utilized in additive manufacturing or 3D printing applications, where the precise composition and flow properties are essential for producing intricate and high-quality parts. Moreover, in the aerospace and automotive sectors, high purity aluminum granules are utilized in casting and molding processes to create components with specific performance characteristics and dimensional accuracy.
High Purity Aluminum Market Segmentation
By Type
- High Purity Alumina Powder AHP200D
- High Purity Alumina Granule AHP300G
- High Purity Alumina Granule AHP300H
- High Purity Alumina Pellet AHP300B
By Purity
By End-User
- Aeronautical Industry
- Chemical Industry
- Semiconductors and Electronics
- 3d Printing
- Others
By Grade Type
By Form
By Region
- North America (United States, Canada, Mexico)
- Europe (Germany, France, United Kingdom, Spain, Italy, Others)
- Asia Pacific (China, India, Japan, South Korea, Australia, Others)
- Latin America (Brazil, Argentina, Others)
- Middle East and Africa (Saudi Arabia, UAE, Kuwait, Other Middle East, South Africa, Nigeria, Other Africa)
High Purity Aluminum Market Companies
- Orbite Technologies Inc. (Canada)
- Altech Chemicals Ltd. (Australia)
- Sumitomo Chemical Co., Ltd. (Japan)
- Baikowski SAS (France)
- Nippon Light Metal Holdings Company, Ltd. (Japan)
- Arconic(United States)
- JW Aluminium(United States)
- Alcoa (United States)
- Nature Alu (Canada)
- Kaiser Aluminum Corporation (United States)
*list not exhaustive
High Purity Aluminum Market Outlook 2023
1 Market Overview
1.1 Introduction to the High Purity Aluminum Market
1.2 Scope of the Study
1.3 Research Objective
1.3.1 Key Market Scope and Segments
1.3.2 Players Covered
1.3.3 Years Considered
2 Executive Summary
2.1 2023 High Purity Aluminum Industry- Market Statistics
3 Market Dynamics
3.1 Market Drivers
3.2 Market Challenges
3.3 Market Opportunities
3.4 Market Trends
4 Market Factor Analysis
4.1 Porter’s Five Forces
4.2 Market Entropy
4.2.1 Global High Purity Aluminum Market Companies with Area Served
4.2.2 Products Offerings Global High Purity Aluminum Market
5 COVID-19 Impact Analysis and Outlook Scenarios
5.1.1 Covid-19 Impact Analysis
5.1.2 post-COVID-19 Scenario- Low Growth Case
5.1.3 post-COVID-19 Scenario- Reference Growth Case
5.1.4 post-COVID-19 Scenario- Low Growth Case
6 Global High Purity Aluminum Market Trends
6.1 Global High Purity Aluminum Revenue (USD Million) and CAGR (%) by Type (2018-2030)
6.2 Global High Purity Aluminum Revenue (USD Million) and CAGR (%) by Applications (2018-2030)
6.3 Global High Purity Aluminum Revenue (USD Million) and CAGR (%) by regions (2018-2030)
7 Global High Purity Aluminum Market Revenue (USD Million) by Type, and Applications (2018-2022)
7.1 Global High Purity Aluminum Revenue (USD Million) by Type (2018-2022)
7.1.1 Global High Purity Aluminum Revenue (USD Million), Market Share (%) by Type (2018-2022)
7.2 Global High Purity Aluminum Revenue (USD Million) by Applications (2018-2022)
7.2.1 Global High Purity Aluminum Revenue (USD Million), Market Share (%) by Applications (2018-2022)
8 Global High Purity Aluminum Development Regional Status and Outlook
8.1 Global High Purity Aluminum Revenue (USD Million) By Regions (2018-2022)
8.2 North America High Purity Aluminum Revenue (USD Million) by Type, and Application (2018-2022)
8.2.1 North America High Purity Aluminum Revenue (USD Million) by Country (2018-2022)
8.2.2 North America High Purity Aluminum Revenue (USD Million) by Type (2018-2022)
8.2.3 North America High Purity Aluminum Revenue (USD Million) by Applications (2018-2022)
8.3 Europe High Purity Aluminum Revenue (USD Million), by Type, and Applications (USD Million) (2018-2022)
8.3.1 Europe High Purity Aluminum Revenue (USD Million), by Country (2018-2022)
8.3.2 Europe High Purity Aluminum Revenue (USD Million) by Type (2018-2022)
8.3.3 Europe High Purity Aluminum Revenue (USD Million) by Applications (2018-2022)
8.4 Asia Pacific High Purity Aluminum Revenue (USD Million), and Revenue (USD Million) by Type, and Applications (2018-2022)
8.4.1 Asia Pacific High Purity Aluminum Revenue (USD Million) by Country (2018-2022)
8.4.2 Asia Pacific High Purity Aluminum Revenue (USD Million) by Type (2018-2022)
8.4.3 Asia Pacific High Purity Aluminum Revenue (USD Million) by Applications (2018-2022)
8.5 South America High Purity Aluminum Revenue (USD Million), by Type, and Applications (2018-2022)
8.5.1 South America High Purity Aluminum Revenue (USD Million), by Country (2018-2022)
8.5.2 South America High Purity Aluminum Revenue (USD Million) by Type (2018-2022)
8.5.3 South America High Purity Aluminum Revenue (USD Million) by Applications (2018-2022)
8.6 Middle East and Africa High Purity Aluminum Revenue (USD Million), by Type, Technology, Application, Thickness (2018-2022)
8.6.1 Middle East and Africa High Purity Aluminum Revenue (USD Million) by Country (2018-2022)
8.6.2 Middle East and Africa High Purity Aluminum Revenue (USD Million) by Type (2018-2022)
8.6.3 Middle East and Africa High Purity Aluminum Revenue (USD Million) by Applications (2018-2022)
9 Company Profiles
10 Global High Purity Aluminum Market Revenue (USD Million), by Type, and Applications (2023-2030)
10.1 Global High Purity Aluminum Revenue (USD Million) and Market Share (%) by Type (2023-2030)
10.1.1 Global High Purity Aluminum Revenue (USD Million), and Market Share (%) by Type (2023-2030)
10.2 Global High Purity Aluminum Revenue (USD Million) and Market Share (%) by Applications (2023-2030)
10.2.1 Global High Purity Aluminum Revenue (USD Million), and Market Share (%) by Applications (2023-2030)
11 Global High Purity Aluminum Development Regional Status and Outlook Forecast
11.1 Global High Purity Aluminum Revenue (USD Million) By Regions (2023-2030)
11.2 North America High Purity Aluminum Revenue (USD Million) by Type, and Applications (2023-2030)
11.2.1 North America High Purity Aluminum Revenue (USD) Million by Country (2023-2030)
11.2.2 North America High Purity Aluminum Revenue (USD Million), by Type (2023-2030)
11.2.3 North America High Purity Aluminum Revenue (USD Million), Market Share (%) by Applications (2023-2030)
11.3 Europe High Purity Aluminum Revenue (USD Million), by Type, and Applications (2023-2030)
11.3.1 Europe High Purity Aluminum Revenue (USD Million), by Country (2023-2030)
11.3.2 Europe High Purity Aluminum Revenue (USD Million), by Type (2023-2030)
11.3.3 Europe High Purity Aluminum Revenue (USD Million), by Applications (2023-2030)
11.4 Asia Pacific High Purity Aluminum Revenue (USD Million) by Type, and Applications (2023-2030)
11.4.1 Asia Pacific High Purity Aluminum Revenue (USD Million), by Country (2023-2030)
11.4.2 Asia Pacific High Purity Aluminum Revenue (USD Million), by Type (2023-2030)
11.4.3 Asia Pacific High Purity Aluminum Revenue (USD Million), by Applications (2023-2030)
11.5 South America High Purity Aluminum Revenue (USD Million), by Type, and Applications (2023-2030)
11.5.1 South America High Purity Aluminum Revenue (USD Million), by Country (2023-2030)
11.5.2 South America High Purity Aluminum Revenue (USD Million), by Type (2023-2030)
11.5.3 South America High Purity Aluminum Revenue (USD Million), by Applications (2023-2030)
11.6 Middle East and Africa High Purity Aluminum Revenue (USD Million), by Type, and Applications (2023-2030)
11.6.1 Middle East and Africa High Purity Aluminum Revenue (USD Million), by region (2023-2030)
11.6.2 Middle East and Africa High Purity Aluminum Revenue (USD Million), by Type (2023-2030)
11.6.3 Middle East and Africa High Purity Aluminum Revenue (USD Million), by Applications (2023-2030)
12 Methodology and Data Sources
12.1 Methodology/Research Approach
12.1.1 Research Programs/Design
12.1.2 Market Size Estimation
12.1.3 Market Breakdown and Data Triangulation
12.2 Data Sources
12.2.1 Secondary Sources
12.2.2 Primary Sources
12.3 Disclaimer
List of Tables
Table 1 Market Segmentation Analysis
Table 2 Global High Purity Aluminum Market Companies with Areas Served
Table 3 Products Offerings Global High Purity Aluminum Market
Table 4 Low Growth Scenario Forecasts
Table 5 Reference Case Growth Scenario
Table 6 High Growth Case Scenario
Table 7 Global High Purity Aluminum Revenue (USD Million) And CAGR (%) By Type (2018-2030)
Table 8 Global High Purity Aluminum Revenue (USD Million) And CAGR (%) By Applications (2018-2030)
Table 9 Global High Purity Aluminum Revenue (USD Million) And CAGR (%) By Regions (2018-2030)
Table 10 Global High Purity Aluminum Revenue (USD Million) By Type (2018-2022)
Table 11 Global High Purity Aluminum Revenue Market Share (%) By Type (2018-2022)
Table 12 Global High Purity Aluminum Revenue (USD Million) By Applications (2018-2022)
Table 13 Global High Purity Aluminum Revenue Market Share (%) By Applications (2018-2022)
Table 14 Global High Purity Aluminum Market Revenue (USD Million) By Regions (2018-2022)
Table 15 Global High Purity Aluminum Market Share (%) By Regions (2018-2022)
Table 16 North America High Purity Aluminum Revenue (USD Million) By Country (2018-2022)
Table 17 North America High Purity Aluminum Revenue (USD Million) By Type (2018-2022)
Table 18 North America High Purity Aluminum Revenue (USD Million) By Applications (2018-2022)
Table 19 Europe High Purity Aluminum Revenue (USD Million) By Country (2018-2022)
Table 20 Europe High Purity Aluminum Revenue (USD Million) By Type (2018-2022)
Table 21 Europe High Purity Aluminum Revenue (USD Million) By Applications (2018-2022)
Table 22 Asia Pacific High Purity Aluminum Revenue (USD Million) By Country (2018-2022)
Table 23 Asia Pacific High Purity Aluminum Revenue (USD Million) By Type (2018-2022)
Table 24 Asia Pacific High Purity Aluminum Revenue (USD Million) By Applications (2018-2022)
Table 25 South America High Purity Aluminum Revenue (USD Million) By Country (2018-2022)
Table 26 South America High Purity Aluminum Revenue (USD Million) By Type (2018-2022)
Table 27 South America High Purity Aluminum Revenue (USD Million) By Applications (2018-2022)
Table 28 Middle East and Africa High Purity Aluminum Revenue (USD Million) By Region (2018-2022)
Table 29 Middle East and Africa High Purity Aluminum Revenue (USD Million) By Type (2018-2022)
Table 30 Middle East and Africa High Purity Aluminum Revenue (USD Million) By Applications (2018-2022)
Table 31 Financial Analysis
Table 32 Global High Purity Aluminum Revenue (USD Million) By Type (2023-2030)
Table 33 Global High Purity Aluminum Revenue Market Share (%) By Type (2023-2030)
Table 34 Global High Purity Aluminum Revenue (USD Million) By Applications (2023-2030)
Table 35 Global High Purity Aluminum Revenue Market Share (%) By Applications (2023-2030)
Table 36 Global High Purity Aluminum Market Revenue (USD Million), And Revenue (USD Million) By Regions (2023-2030)
Table 37 North America High Purity Aluminum Revenue (USD)By Country (2023-2030)
Table 38 North America High Purity Aluminum Revenue (USD Million) By Type (2023-2030)
Table 39 North America High Purity Aluminum Revenue (USD Million) By Applications (2023-2030)
Table 40 Europe High Purity Aluminum Revenue (USD Million) By Country (2023-2030)
Table 41 Europe High Purity Aluminum Revenue (USD Million) By Type (2023-2030)
Table 42 Europe High Purity Aluminum Revenue (USD Million) By Applications (2023-2030)
Table 43 Asia Pacific High Purity Aluminum Revenue (USD Million) By Country (2023-2030)
Table 44 Asia Pacific High Purity Aluminum Revenue (USD Million) By Type (2023-2030)
Table 45 Asia Pacific High Purity Aluminum Revenue (USD Million) By Applications (2023-2030)
Table 46 South America High Purity Aluminum Revenue (USD Million) By Country (2023-2030)
Table 47 South America High Purity Aluminum Revenue (USD Million) By Type (2023-2030)
Table 48 South America High Purity Aluminum Revenue (USD Million) By Applications (2023-2030)
Table 49 Middle East and Africa High Purity Aluminum Revenue (USD Million) By Region (2023-2030)
Table 50 Middle East and Africa High Purity Aluminum Revenue (USD Million) By Region (2023-2030)
Table 51 Middle East and Africa High Purity Aluminum Revenue (USD Million) By Type (2023-2030)
Table 52 Middle East and Africa High Purity Aluminum Revenue (USD Million) By Applications (2023-2030)
Table 53 Research Programs/Design for This Report
Table 54 Key Data Information from Secondary Sources
Table 55 Key Data Information from Primary Sources
List of Figures
Figure 1 Market Scope
Figure 2 Porter’s Five Forces
Figure 3 Global High Purity Aluminum Revenue (USD Million) By Type (2018-2022)
Figure 4 Global High Purity Aluminum Revenue Market Share (%) By Type (2022)
Figure 5 Global High Purity Aluminum Revenue (USD Million) By Applications (2018-2022)
Figure 6 Global High Purity Aluminum Revenue Market Share (%) By Applications (2022)
Figure 7 Global High Purity Aluminum Market Revenue (USD Million) By Regions (2018-2022)
Figure 8 Global High Purity Aluminum Market Share (%) By Regions (2022)
Figure 9 North America High Purity Aluminum Revenue (USD Million) By Country (2018-2022)
Figure 10 North America High Purity Aluminum Revenue (USD Million) By Type (2018-2022)
Figure 11 North America High Purity Aluminum Revenue (USD Million) By Applications (2018-2022)
Figure 12 Europe High Purity Aluminum Revenue (USD Million) By Country (2018-2022)
Figure 13 Europe High Purity Aluminum Revenue (USD Million) By Type (2018-2022)
Figure 14 Europe High Purity Aluminum Revenue (USD Million) By Applications (2018-2022)
Figure 15 Asia Pacific High Purity Aluminum Revenue (USD Million) By Country (2018-2022)
Figure 16 Asia Pacific High Purity Aluminum Revenue (USD Million) By Type (2018-2022)
Figure 17 Asia Pacific High Purity Aluminum Revenue (USD Million) By Applications (2018-2022)
Figure 18 South America High Purity Aluminum Revenue (USD Million) By Country (2018-2022)
Figure 19 South America High Purity Aluminum Revenue (USD Million) By Type (2018-2022)
Figure 20 South America High Purity Aluminum Revenue (USD Million) By Applications (2018-2022)
Figure 21 Middle East and Africa High Purity Aluminum Revenue (USD Million) By Region (2018-2022)
Figure 22 Middle East and Africa High Purity Aluminum Revenue (USD Million) By Type (2018-2022)
Figure 23 Middle East and Africa High Purity Aluminum Revenue (USD Million) By Applications (2018-2022)
Figure 24 Global High Purity Aluminum Revenue (USD Million) By Type (2023-2030)
Figure 25 Global High Purity Aluminum Revenue Market Share (%) By Type (2030)
Figure 26 Global High Purity Aluminum Revenue (USD Million) By Applications (2023-2030)
Figure 27 Global High Purity Aluminum Revenue Market Share (%) By Applications (2030)
Figure 28 Global High Purity Aluminum Market Revenue (USD Million) By Regions (2023-2030)
Figure 29 North America High Purity Aluminum Revenue (USD Million) By Country (2023-2030)
Figure 30 North America High Purity Aluminum Revenue (USD Million) By Type (2023-2030)
Figure 31 North America High Purity Aluminum Revenue (USD Million) By Applications (2023-2030)
Figure 32 Europe High Purity Aluminum Revenue (USD Million) By Country (2023-2030)
Figure 33 Europe High Purity Aluminum Revenue (USD Million) By Type (2023-2030)
Figure 34 Europe High Purity Aluminum Revenue (USD Million) By Applications (2023-2030)
Figure 35 Asia Pacific High Purity Aluminum Revenue (USD Million) By Country (2023-2030)
Figure 36 Asia Pacific High Purity Aluminum Revenue (USD Million) By Type (2023-2030)
Figure 37 Asia Pacific High Purity Aluminum Revenue (USD Million) By Applications (2023-2030)
Figure 38 South America High Purity Aluminum Revenue (USD Million) By Country (2023-2030)
Figure 39 South America High Purity Aluminum Revenue (USD Million) By Type (2023-2030)
Figure 40 South America High Purity Aluminum Revenue (USD Million) By Applications (2023-2030)
Figure 41 Middle East and Africa High Purity Aluminum Revenue (USD Million) By Region (2023-2030)
Figure 42 Middle East and Africa High Purity Aluminum Revenue (USD Million) By Region (2023-2030)
Figure 43 Middle East and Africa High Purity Aluminum Revenue (USD Million) By Type (2023-2030)
Figure 44 Middle East and Africa High Purity Aluminum Revenue (USD Million) By Applications (2023-2030)
Figure 45 Bottom-Up and Top-Down Approaches for This Report
Figure 46 Data Triangulation
