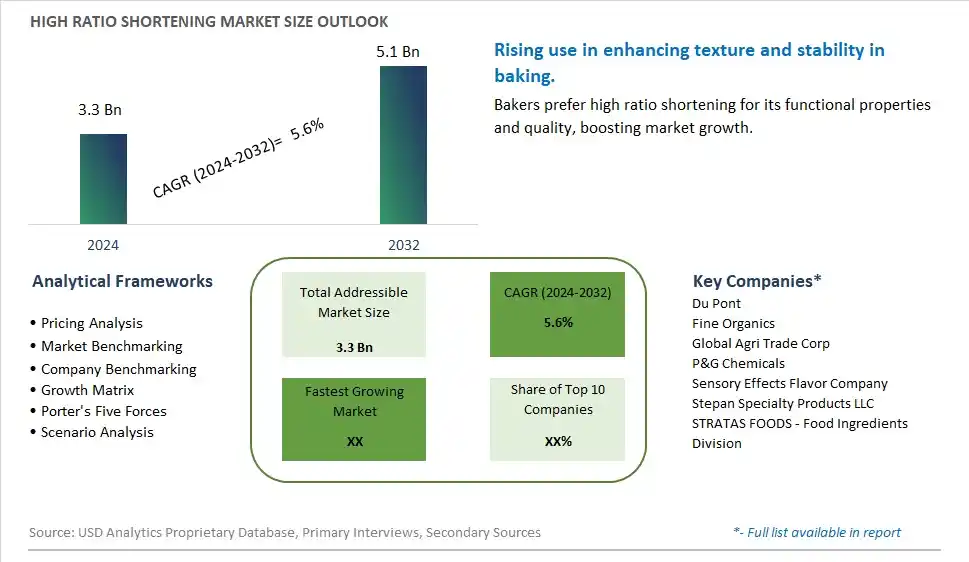
Global High Ratio Shortening Market Size is valued at $3.3 Billion in 2024 and is forecast to register a growth rate (CAGR) of 5.6% to reach $5.1 Billion by 2032.
The global High Ratio Shortening Market Comprehensive Study analyzes and forecasts the market size across 6 regions and 24 countries for diverse segments -By Form (Liquid, Powder), By Function (Emulsifying Agent, Texturizing Agent, Icing Agent, Others), By Source (Plant-Derived, Animal-Derived), By End-User (Food Industry, -Bakery Products, -Confectionary, -Dairy Products, -Desserts and Ice-creams, -Fat, Oil and Sweet Spreads, Food Service Industry, -Hotels, -Restaurants, -Café, Household), By Distribution Channel (Supermarkets/ Hypermarkets, Convenience Stores, Specialty Stores, Online Retail, Others)
An Introduction to High Ratio Shortening Market
The High Ratio Shortening market in 2024 is thriving, fueled by the rising demand for high-quality and functional baking fats. High ratio shortening, used in cakes, pastries, and frostings, provides superior aeration and stability. The market benefits from advancements in fat processing and formulation technologies, the growing trend of premium and artisanal baked goods, and the expansion of the global baking sector. Additionally, the increasing focus on clean label and trans-fat-free shortening is contributing to market growth.
High Ratio Shortening Competitive Landscape
The market report analyses the leading companies in the industry including Du Pont, Fine Organics, Global Agri Trade Corp, P&G Chemicals, Sensory Effects Flavor Company, Stepan Specialty Products LLC, STRATAS FOODS - Food Ingredients Division, and Others.
High Ratio Shortening Market Dynamics
High Ratio Shortening Market Trend: Shift Towards Trans-Fat-Free and Healthier Alternatives
The most prominent trend in the High Ratio Shortening Market is the shift towards trans-fat-free and healthier alternatives. With increasing health concerns related to trans fats, consumers are actively seeking shortening products that offer health benefits without compromising on quality and performance. High ratio shortening, known for its superior creaming and stability properties, is being reformulated to eliminate trans fats and include healthier ingredients. This trend is driving manufacturers to innovate and offer high ratio shortening products that cater to the health-conscious consumer Market
High Ratio Shortening Market Driver: Growing Demand in Bakery and Confectionery Industries
A key driver for the High Ratio Shortening Market is the growing demand in the bakery and confectionery industries. High ratio shortening is widely used in the production of cakes, pastries, icings, and other baked goods due to its excellent aeration and emulsifying properties. The increasing consumption of bakery and confectionery products globally is significantly boosting the demand for high ratio shortening as manufacturers seek to improve the texture, stability, and shelf life of their products. This growing demand is driving market growth and encouraging further innovation in high ratio shortening formulations.
High Ratio Shortening Market Opportunity: Expansion in Emerging Markets
One potential opportunity in the High Ratio Shortening Market lies in the expansion into emerging markets. Regions such as Asia-Pacific, Latin America, and Africa are experiencing rapid urbanization, rising disposable incomes, and changing dietary habits. As the consumption of bakery and confectionery products increases in these regions, there is a substantial opportunity for manufacturers to introduce high ratio shortening products. By focusing on these emerging markets, companies can tap into a large and growing consumer base, thereby driving market expansion and increasing their market share.
High Ratio Shortening Market Share Analysis: Liquid Form segment generated the highest revenue share in the industry
The largest segment in the High Ratio Shortening Market by form is the liquid form. Liquid high ratio shortenings are favored for their ease of use in various food applications, particularly in baking and confectionery. They are preferred for their ability to blend seamlessly into batters and doughs, ensuring consistent texture and improved moisture retention in baked goods. Liquid high ratio shortenings are commonly used in industrial baking settings, such as large-scale bakeries and food production facilities, where efficiency and uniformity are paramount. Their liquid state allows for precise measurement and dispensing, contributing to operational efficiency and reducing production time. Additionally, liquid shortenings offer versatility in applications ranging from cakes and pastries to icings and fillings, catering to diverse consumer preferences and baking needs.
High Ratio Shortening Market Share Analysis: Emulsifying Agent Function is the fastest growing segment over the forecast period to 2032
The fastest growing segment in the High Ratio Shortening Market by function is the emulsifying agent function. Emulsifying agents play a crucial role in stabilizing oil-water mixtures, thereby enhancing the texture, mouthfeel, and shelf stability of food products. High ratio shortenings that serve as emulsifying agents are increasingly sought after in the food industry for their ability to create stable emulsions, which are essential in applications such as salad dressings, sauces, and baked goods. These shortenings help maintain uniform consistency and prevent ingredient separation, ensuring product quality and consumer satisfaction. With rising consumer demand for products with improved texture and sensory attributes, the use of high ratio shortenings as emulsifying agents is projected to grow significantly. This growth is driven by advancements in food technology and the expanding scope of applications in both commercial and residential food preparation.
High Ratio Shortening Market Share Analysis: Plant-Derived segment generated the highest revenue share in the industry
The largest segment in the High Ratio Shortening Market by source is plant-derived shortening. Plant-derived high ratio shortenings are extensively used in the food industry due to their versatility, health benefits, and suitability for various dietary preferences, including vegan and vegetarian diets. These shortenings are derived from sources like palm, soybean, sunflower, or canola oil. They are valued for their neutral flavor profile, which allows them to be used in a wide range of food applications without imparting strong flavors. Plant-derived shortenings are popularly used in bakery products, confectionery, and other food preparations where the texture and mouthfeel are crucial factors. Their ability to mimic the functionality of traditional animal-derived shortenings while meeting the growing demand for plant-based alternatives makes them a preferred choice among manufacturers and consumers alike.
High Ratio Shortening Market Share Analysis: Food Service Industry is the fastest growing segment over the forecast period to 2032
The fastest growing segment in the High Ratio Shortening Market by end-user is the food service industry. This sector encompasses a wide range of establishments such as hotels, restaurants, cafes, and catering services that rely on high ratio shortenings for various culinary applications. In the food service industry, high ratio shortenings play a pivotal role in enhancing the texture, flavor, and appearance of baked goods, desserts, fried foods, and other culinary creations. They are preferred for their ability to withstand high temperatures during cooking and frying processes, ensuring consistent results and improved food presentation. As the food service sector expands globally, driven by increasing consumer preferences for dining out and convenience, the demand for high ratio shortenings is expected to rise significantly. This growth is fueled by the need for efficient and high-quality food preparation solutions that meet the expectations of discerning consumers and culinary professionals alike.
High Ratio Shortening Market Segmentation
By Form
Liquid
Powder
By Function
Emulsifying Agent
Texturizing Agent
Icing Agent
Others
By Source
Plant-Derived
Animal-Derived
By End-User
Food Industry
-Bakery Products
-Confectionary
-Dairy Products
-Desserts and Ice-creams
-Fat
Oil and Sweet Spreads
Food Service Industry
-Hotels
-Restaurants
-Café
Household
By Distribution Channel
Supermarkets/ Hypermarkets
Convenience Stores
Specialty Stores
Online Retail
Others
Countries Analyzed
North America (US, Canada, Mexico)
Europe (Germany, UK, France, Spain, Italy, Russia, Rest of Europe)
Asia Pacific (China, India, Japan, South Korea, Australia, South East Asia, Rest of Asia)
South America (Brazil, Argentina, Rest of South America)
Middle East and Africa (Saudi Arabia, UAE, Rest of Middle East, South Africa, Egypt, Rest of Africa)
High Ratio Shortening Companies Profiled in the Study
Du Pont
Fine Organics
Global Agri Trade Corp
P&G Chemicals
Sensory Effects Flavor Company
Stepan Specialty Products LLC
STRATAS FOODS - Food Ingredients Division
*- List Not Exhaustive
Chapter 1. TABLE OF CONTENTS
Chapter 2. Introduction to High Ratio Shortening Market
2.1. Market Overview
2.2. Key Statistics and Report Highlights
2.3. Scope of the Comprehensive Study
2.3.1. Market Definition
2.3.2 Countries and Regions Covered
2.3.3 Research Objective
2.3.4 Units, Currency, and Conversions
2.3.5 Industry Value Chain
2.4. Key Market Segments
2.5. Key Companies
2.6. Study Period
Chapter 3. Strategic Analysis Review
3.1. High Ratio Shortening Pricing Analysis and Forecast
3.2. Porter’s Five Forces
3.3. Market Ecosystem
3.4. SWOT Analysis
3.5. Regulatory Scenario
3.3. Effects of Inflation, Russia-Ukraine War, moderating economic growth, and other macroeconomic factors
Chapter 4. Competitive Landscape
4.1. Market Share Analysis
4.1.1. Global High Ratio Shortening Market Share by Company, 2023
4.1.2. Product Offerings of Leading High Ratio Shortening Companies
4.2. Market Entropy
4.2.1. New Product Launches in the Industry
4.2.2. Mergers, Acquisitions, Joint ventures, and Partnerships
4.3. Key Strategies and Best Practices
Chapter 5. Global Market Projections: Best, Reference, and Low Case Scenarios
5.1. Growth Analysis- Case Scenario Definitions
5.2. Low Growth Case Scenario Forecasts
5.3. Reference Growth Case Scenario Forecasts
5.4. High Growth Case Scenario Forecasts
Chapter 6. Market Dynamics
6.1. High Ratio Shortening Market Drivers
6.2. High Ratio Shortening Market Challenges
6.6. High Ratio Shortening Market Opportunities
6.4. High Ratio Shortening Market Trends
Chapter 7. Global High Ratio Shortening Market Outlook Trends
7.1. Global High Ratio Shortening Revenue (USD Million) and CAGR (%) by Type (2021-2032)
7.2. Global High Ratio Shortening Revenue (USD Million) and CAGR (%) by Application (2021-2032)
7.3. Global High Ratio Shortening Revenue (USD Million) and CAGR (%) by Product (2021-2032)
By Form
Liquid
Powder
By Function
Emulsifying Agent
Texturizing Agent
Icing Agent
Others
By Source
Plant-Derived
Animal-Derived
By End-User
Food Industry
-Bakery Products
-Confectionary
-Dairy Products
-Desserts and Ice-creams
-Fat
Oil and Sweet Spreads
Food Service Industry
-Hotels
-Restaurants
-Café
Household
By Distribution Channel
Supermarkets/ Hypermarkets
Convenience Stores
Specialty Stores
Online Retail
Others
Chapter 8. Global High Ratio Shortening Regional Analysis and Outlook
8.1. Global High Ratio Shortening Revenue (USD Million) By Regions (2021- 2032)
8.2. North America High Ratio Shortening Revenue (USD Million) by Country (2021-2032)
8.2.1. United States High Ratio Shortening Regional Analysis and Outlook
8.2.2. Canada High Ratio Shortening Regional Analysis and Outlook
8.2.3. Mexico High Ratio Shortening Regional Analysis and Outlook
8.3. Europe High Ratio Shortening Revenue (USD Million), by Country (2021-2032)
8.3.1. Germany High Ratio Shortening Regional Analysis and Outlook
8.3.2. France High Ratio Shortening Regional Analysis and Outlook
8.3.3. United Kingdom High Ratio Shortening Regional Analysis and Outlook
8.3.4. Spain High Ratio Shortening Regional Analysis and Outlook
8.3.5. Italy High Ratio Shortening Regional Analysis and Outlook
8.3.6. Russia High Ratio Shortening Regional Analysis and Outlook
8.3.7. Rest of Europe High Ratio Shortening Regional Analysis and Outlook
8.4. Asia Pacific High Ratio Shortening Revenue (USD Million) by Country (2021-2032)
8.4.1. China High Ratio Shortening Regional Analysis and Outlook
8.4.2. Japan High Ratio Shortening Regional Analysis and Outlook
8.4.3. India High Ratio Shortening Regional Analysis and Outlook
8.4.4. South Korea High Ratio Shortening Regional Analysis and Outlook
8.4.5. Australia High Ratio Shortening Regional Analysis and Outlook
8.4.6. South East Asia High Ratio Shortening Regional Analysis and Outlook
8.4.7. Rest of Asia Pacific High Ratio Shortening Regional Analysis and Outlook
8.5. South America High Ratio Shortening Revenue (USD Million), by Country (2021-2032)
8.5.1. Brazil High Ratio Shortening Regional Analysis and Outlook
8.5.2. Argentina High Ratio Shortening Regional Analysis and Outlook
8.5.3. Rest of South America High Ratio Shortening Regional Analysis and Outlook
8.6. Middle East and Africa High Ratio Shortening Revenue (USD Million) by Country (2021-2032)
8.6.1. Middle East High Ratio Shortening Regional Analysis and Outlook
8.6.2. Africa High Ratio Shortening Regional Analysis and Outlook
Chapter 9. North America High Ratio Shortening Analysis and Outlook
9.1. North America High Ratio Shortening Revenue (USD Million) by Segments (2021-2032)
9.1.1. North America High Ratio Shortening Revenue (USD Million) by Type (2021-2032)
9.1.2. North America High Ratio Shortening Revenue (USD Million) by Application (2021-2032)
9.1.3. North America High Ratio Shortening Revenue (USD Million) by Product (2021-2032)
By Form
Liquid
Powder
By Function
Emulsifying Agent
Texturizing Agent
Icing Agent
Others
By Source
Plant-Derived
Animal-Derived
By End-User
Food Industry
-Bakery Products
-Confectionary
-Dairy Products
-Desserts and Ice-creams
-Fat
Oil and Sweet Spreads
Food Service Industry
-Hotels
-Restaurants
-Café
Household
By Distribution Channel
Supermarkets/ Hypermarkets
Convenience Stores
Specialty Stores
Online Retail
Others
Chapter 10. Europe High Ratio Shortening Analysis and Outlook
10.1. Europe High Ratio Shortening Revenue (USD Million), by Segments (USD Million) (2021-2032)
10.1.1. Europe High Ratio Shortening Revenue (USD Million) by Type (2021-2032)
10.1.2. Europe High Ratio Shortening Revenue (USD Million) by Application (2021-2032)
10.1.3. Europe High Ratio Shortening Revenue (USD Million) by Product (2021-2032)
By Form
Liquid
Powder
By Function
Emulsifying Agent
Texturizing Agent
Icing Agent
Others
By Source
Plant-Derived
Animal-Derived
By End-User
Food Industry
-Bakery Products
-Confectionary
-Dairy Products
-Desserts and Ice-creams
-Fat
Oil and Sweet Spreads
Food Service Industry
-Hotels
-Restaurants
-Café
Household
By Distribution Channel
Supermarkets/ Hypermarkets
Convenience Stores
Specialty Stores
Online Retail
Others
Chapter 11. Asia Pacific High Ratio Shortening Analysis and Outlook
11.1. Asia Pacific High Ratio Shortening Revenue (USD Million), and Revenue (USD Million) by Segments (2021-2032)
11.1.1. Asia Pacific High Ratio Shortening Revenue (USD Million) by Type (2021-2032)
11.1.2. Asia Pacific High Ratio Shortening Revenue (USD Million) by Application (2021-2032)
11.1.3. Asia Pacific High Ratio Shortening Revenue (USD Million) by Product (2021-2032)
By Form
Liquid
Powder
By Function
Emulsifying Agent
Texturizing Agent
Icing Agent
Others
By Source
Plant-Derived
Animal-Derived
By End-User
Food Industry
-Bakery Products
-Confectionary
-Dairy Products
-Desserts and Ice-creams
-Fat
Oil and Sweet Spreads
Food Service Industry
-Hotels
-Restaurants
-Café
Household
By Distribution Channel
Supermarkets/ Hypermarkets
Convenience Stores
Specialty Stores
Online Retail
Others
Chapter 12. South America High Ratio Shortening Analysis and Outlook
12.1. South America High Ratio Shortening Revenue (USD Million), by Segments (2021-2032)
12.1.1. South America High Ratio Shortening Revenue (USD Million) by Type (2021-2032)
12.1.2. South America High Ratio Shortening Revenue (USD Million) by Application (2021-2032)
12.1.3. South America High Ratio Shortening Revenue (USD Million) by Product (2021-2032)
By Form
Liquid
Powder
By Function
Emulsifying Agent
Texturizing Agent
Icing Agent
Others
By Source
Plant-Derived
Animal-Derived
By End-User
Food Industry
-Bakery Products
-Confectionary
-Dairy Products
-Desserts and Ice-creams
-Fat
Oil and Sweet Spreads
Food Service Industry
-Hotels
-Restaurants
-Café
Household
By Distribution Channel
Supermarkets/ Hypermarkets
Convenience Stores
Specialty Stores
Online Retail
Others
Chapter 13. Middle East and Africa High Ratio Shortening Analysis and Outlook
13.1. Middle East and Africa High Ratio Shortening Revenue (USD Million), by Segments (2021-2032)
13.1.1. Middle East and Africa High Ratio Shortening Revenue (USD Million) by Type (2021-2032)
13.1.2. Middle East and Africa High Ratio Shortening Revenue (USD Million) by Application (2021-2032)
13.1.3. Middle East and Africa High Ratio Shortening Revenue (USD Million) by Product (2021-2032)
By Form
Liquid
Powder
By Function
Emulsifying Agent
Texturizing Agent
Icing Agent
Others
By Source
Plant-Derived
Animal-Derived
By End-User
Food Industry
-Bakery Products
-Confectionary
-Dairy Products
-Desserts and Ice-creams
-Fat
Oil and Sweet Spreads
Food Service Industry
-Hotels
-Restaurants
-Café
Household
By Distribution Channel
Supermarkets/ Hypermarkets
Convenience Stores
Specialty Stores
Online Retail
Others
Chapter 14. High Ratio Shortening Company Profiles
14.1 Business Overview
14.2 Product Profiles
14.3 SWOT Profiles
14.5 Recent Developments
14.6 Financial Profile
List of Companies
Du Pont
Fine Organics
Global Agri Trade Corp
P&G Chemicals
Sensory Effects Flavor Company
Stepan Specialty Products LLC
STRATAS FOODS - Food Ingredients Division
15. Methodology and Data Sources
15.1 Customization Offerings
15.2 Subscription Services
15.3 Related Reports
15.4 Publisher Expertise
LIST OF TABLES
Table 1 Market Segmentation Analysis
Table 2 Global High Ratio Shortening Market Share of Leading Companies, 2023
Table 3 Product Offerings of Leading Companies
Table 4 Low Growth Scenario Forecasts
Table 5 Reference Case Growth Scenario
Table 6 High Growth Case Scenario
Table 7 Global High Ratio Shortening Revenue (USD Million) And CAGR (%) By Type (2021-2032)
Table 8 Global High Ratio Shortening Revenue (USD Million) And CAGR (%) By Application (2021-2032)
Table 9 Global High Ratio Shortening Revenue (USD Million) And CAGR (%) By Product (2021-2032)
Table 10 Global High Ratio Shortening Market Revenue (USD Million) By Regions (2021-2032)
Table 11 Global High Ratio Shortening Market Share (%) By Regions (2021-2032)
Table 12 North America High Ratio Shortening Revenue (USD Million) By Country (2021-2032)
Table 13 Europe High Ratio Shortening Revenue (USD Million) By Country (2021-2032)
Table 14 Asia Pacific High Ratio Shortening Revenue (USD Million) By Country (2021-2032)
Table 15 South America High Ratio Shortening Revenue (USD Million) By Country (2021-2032)
Table 16 Middle East and Africa High Ratio Shortening Revenue (USD Million) By Region (2021-2032)
Table 17 North America High Ratio Shortening Revenue (USD Million) By Type (2021-2032)
Table 18 North America High Ratio Shortening Revenue (USD Million) By Application (2021-2032)
Table 19 North America High Ratio Shortening Revenue (USD Million) By Product (2021-2032)
Table 20 Europe High Ratio Shortening Revenue (USD Million) By Type (2021-2032)
Table 21 Europe High Ratio Shortening Revenue (USD Million) By Application (2021-2032)
Table 22 Europe High Ratio Shortening Revenue (USD Million) By Product (2021-2032)
Table 23 Asia Pacific High Ratio Shortening Revenue (USD Million) By Type (2021-2032)
Table 24 Asia Pacific High Ratio Shortening Revenue (USD Million) By Application (2021-2032)
Table 25 Asia Pacific High Ratio Shortening Revenue (USD Million) By Product (2021-2032)
Table 26 South America High Ratio Shortening Revenue (USD Million) By Type (2021-2032)
Table 27 South America High Ratio Shortening Revenue (USD Million) By Application (2021-2032)
Table 28 South America High Ratio Shortening Revenue (USD Million) By Product (2021-2032)
Table 29 Middle East and Africa High Ratio Shortening Revenue (USD Million) By Type (2021-2032)
Table 30 Middle East and Africa High Ratio Shortening Revenue (USD Million) By Application (2021-2032)
Table 31 Middle East and Africa High Ratio Shortening Revenue (USD Million) By Product (2021-2032)
LIST OF FIGURES
Figure 1. Market Scope
Figure 2. Pricing Forecasts Per Unit, 2023- 2032
Figure 3. Porter’s Five Forces
Figure 4. Global High Ratio Shortening Market Revenue (USD Million) By Regions (2021-2032)
Figure 5. Global High Ratio Shortening Market Share (%) By Regions (2023)
Figure 6. North America High Ratio Shortening Revenue (USD Million) By Country (2021-2032)
Figure 7. United States High Ratio Shortening Revenue (USD Million) By Country (2021-2032)
Figure 8. Canada High Ratio Shortening Revenue (USD Million) By Country (2021-2032)
Figure 9. Mexico High Ratio Shortening Revenue (USD Million) By Country (2021-2032)
Figure 10. Europe High Ratio Shortening Revenue (USD Million) By Country (2021-2032)
Figure 11. Germany High Ratio Shortening Revenue (USD Million) By Country (2021-2032)
Figure 12. France High Ratio Shortening Revenue (USD Million) By Country (2021-2032)
Figure 13. United Kingdom High Ratio Shortening Revenue (USD Million) By Country (2021-2032)
Figure 14. Spain High Ratio Shortening Revenue (USD Million) By Country (2021-2032)
Figure 15. Italy High Ratio Shortening Revenue (USD Million) By Country (2021-2032)
Figure 16. Russia High Ratio Shortening Revenue (USD Million) By Country (2021-2032)
Figure 17. Rest of Europe High Ratio Shortening Revenue (USD Million) By Country (2021-2032)
Figure 11. Asia Pacific High Ratio Shortening Revenue (USD Million) By Country (2021-2032)
Figure 12. China High Ratio Shortening Revenue (USD Million) By Country (2021-2032)
Figure 13. Japan High Ratio Shortening Revenue (USD Million) By Country (2021-2032)
Figure 14. India High Ratio Shortening Revenue (USD Million) By Country (2021-2032)
Figure 15. South Korea High Ratio Shortening Revenue (USD Million) By Country (2021-2032)
Figure 16. Australia High Ratio Shortening Revenue (USD Million) By Country (2021-2032)
Figure 17. South East Asia High Ratio Shortening Revenue (USD Million) By Country (2021-2032)
Figure 18. South America High Ratio Shortening Revenue (USD Million) By Country (2021-2032)
Figure 19. Brazil High Ratio Shortening Revenue (USD Million) By Country (2021-2032)
Figure 20. Argentina High Ratio Shortening Revenue (USD Million) By Country (2021-2032)
Figure 21. Rest of Asia Pacific High Ratio Shortening Revenue (USD Million) By Country (2021-2032)
Figure 22. Middle East and Africa High Ratio Shortening Revenue (USD Million) By Region (2021-2032)
Figure 23. Saudi Arabia High Ratio Shortening Revenue (USD Million) By Region (2021-2032)
Figure 24. The UAE High Ratio Shortening Revenue (USD Million) By Region (2021-2032)
Figure 25. Rest of Middle East High Ratio Shortening Revenue (USD Million) By Region (2021-2032)
Figure 26. South Africa High Ratio Shortening Revenue (USD Million) By Region (2021-2032)
Figure 27. Africa High Ratio Shortening Revenue (USD Million) By Region (2021-2032)
Figure 28. North America High Ratio Shortening Revenue (USD Million) By Type (2021-2032)
Figure 29. North America High Ratio Shortening Revenue (USD Million) By Application (2021-2032)
Figure 30. North America High Ratio Shortening Revenue (USD Million) By Product (2021-2032)
Figure 31. Europe High Ratio Shortening Revenue (USD Million) By Type (2021-2032)
Figure 32. Europe High Ratio Shortening Revenue (USD Million) By Application (2021-2032)
Figure 33. Europe High Ratio Shortening Revenue (USD Million) By Product (2021-2032)
Figure 34. Asia Pacific High Ratio Shortening Revenue (USD Million) By Type (2021-2032)
Figure 35. Asia Pacific High Ratio Shortening Revenue (USD Million) By Application (2021-2032)
Figure 36. Asia Pacific High Ratio Shortening Revenue (USD Million) By Product (2021-2032)
Figure 37. South America High Ratio Shortening Revenue (USD Million) By Type (2021-2032)
Figure 38. South America High Ratio Shortening Revenue (USD Million) By Application (2021-2032)
Figure 39. South America High Ratio Shortening Revenue (USD Million) By Product (2021-2032)
Figure 40. Middle East and Africa High Ratio Shortening Revenue (USD Million) By Type (2021-2032)
Figure 41. Middle East and Africa High Ratio Shortening Revenue (USD Million) By Application (2021-2032)
Figure 42. Middle East and Africa High Ratio Shortening Revenue (USD Million) By Product (2021-2032)
By Form
Liquid
Powder
By Function
Emulsifying Agent
Texturizing Agent
Icing Agent
Others
By Source
Plant-Derived
Animal-Derived
By End-User
Food Industry
-Bakery Products
-Confectionary
-Dairy Products
-Desserts and Ice-creams
-Fat
Oil and Sweet Spreads
Food Service Industry
-Hotels
-Restaurants
-Café
Household
By Distribution Channel
Supermarkets/ Hypermarkets
Convenience Stores
Specialty Stores
Online Retail
Others
Countries Analyzed
North America (US, Canada, Mexico)
Europe (Germany, UK, France, Spain, Italy, Russia, Rest of Europe)
Asia Pacific (China, India, Japan, South Korea, Australia, South East Asia, Rest of Asia)
South America (Brazil, Argentina, Rest of South America)
Middle East and Africa (Saudi Arabia, UAE, Rest of Middle East, South Africa, Egypt, Rest of Africa)
