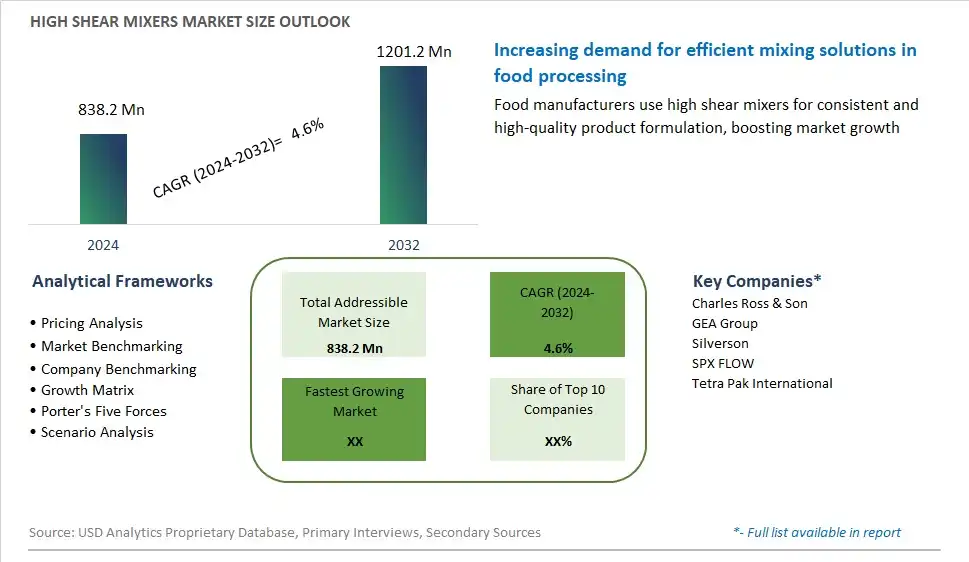
Global High Shear Mixers Market Size is valued at $838.2 Million in 2024 and is forecast to register a growth rate (CAGR) of 4.6% to reach $1201.2 Million by 2032.
The global High Shear Mixers Market Comprehensive Study analyzes and forecasts the market size across 6 regions and 24 countries for diverse segments -By Type (Batch High Shear Mixers, Inline High Shear Mixers, Multi-Stage High Shear Mixers), By Application (Liquid Products, Solid Products)
An Introduction to High Shear Mixers Market
In 2024, the market for high-shear mixers remains essential in various industries, including pharmaceuticals, food processing, cosmetics, and chemicals, where the homogeneous blending of ingredients is critical for product quality and consistency. High-shear mixers are versatile equipment used to mix, blend, emulsify, disperse, and homogenize a wide range of substances, including powders, granules, liquids, and semi-solids. With advancements in technology and engineering, manufacturers are developing high-shear mixers with enhanced efficiency, precision, and scalability to meet the evolving needs of diverse industries. Additionally, the integration of advanced features such as variable speed control, temperature monitoring, and automated process controls allows for greater flexibility and control over the mixing process, leading to improved productivity and product quality. As industries continue to innovate and optimize their manufacturing processes, the demand for high-shear mixers is expected to grow, driven by the need for cost-effective and reliable solutions that deliver consistent results while meeting stringent regulatory requirements and quality standards.
High Shear Mixers Competitive Landscape
The market report analyses the leading companies in the industry including Charles Ross & Son, GEA Group, Silverson, SPX FLOW, Tetra Pak International, and Others.
High Shear Mixers Market Dynamics
High Shear Mixers Market Trend: Increasing Demand for Customized Mixing Solutions
The market for high shear mixers is experiencing a prominent trend towards increasing demand for customized mixing solutions, driven by diverse and specialized manufacturing needs across various industries. As companies seek to optimize their production processes and achieve consistent product quality, there is a growing preference for high shear mixers that can be tailored to specific applications, formulations, and processing requirements. This trend is fueled by advancements in technology, automation, and materials science, enabling manufacturers to design and manufacture high shear mixers with enhanced performance, flexibility, and scalability to meet the evolving needs of their customers.
Market Driver: Expansion of Industries Requiring High Shear Mixing
A key driver propelling the market for high shear mixers is the expansion of industries requiring high shear mixing capabilities for a wide range of applications, including pharmaceuticals, chemicals, cosmetics, food and beverages, and biotechnology. As these industries experience growth and diversification, there is an increased demand for efficient and versatile mixing equipment to facilitate the production of various products, from pharmaceutical formulations and cosmetic creams to food emulsions and chemical suspensions. The need for high shear mixers is driven by factors such as increasing production volumes, stringent quality standards, and the development of innovative products requiring complex mixing processes, driving market growth and technological innovation in the high shear mixer industry.
Market Opportunity: Integration of Advanced Technologies and Automation
An opportunity exists for manufacturers of high shear mixers to capitalize on the growing demand for advanced technologies and automation solutions to enhance mixing efficiency, productivity, and process control. By integrating features such as programmable controls, real-time monitoring, predictive maintenance, and remote operation capabilities, manufacturers can offer high shear mixers that provide greater precision, consistency, and reliability in mixing operations. Moreover, leveraging Industry 4.0 concepts such as IoT connectivity, data analytics, and machine learning algorithms can enable predictive and proactive maintenance strategies, optimize process parameters, and improve overall equipment effectiveness. This opportunity allows manufacturers to differentiate their products in the market, meet the evolving needs of customers for digitalized production environments, and drive innovation in high shear mixing technology for a wide range of industries.
High Shear Mixers Market Share Analysis: Batch High Shear Mixers held the dominant market share in 2024
In the High Shear Mixers Market, the batch high shear mixers segment is the largest, propelled by their versatility, efficiency, and widespread industrial applications. Batch high shear mixers are extensively used across various industries, including food and beverage, pharmaceuticals, cosmetics, and chemicals, for the mixing, emulsifying, homogenizing, and dispersing of ingredients. Their ability to process large volumes of materials in a single batch, coupled with the flexibility to handle a wide range of viscosities and formulations, makes them indispensable in manufacturing processes. Further, batch high shear mixers offer precise control over processing parameters, resulting in consistent product quality and uniformity. Additionally, the modular design and ease of maintenance of batch high shear mixers contribute to their popularity among manufacturers seeking reliable and cost-effective mixing solutions. As industries continue to prioritize efficiency, productivity, and product quality, the batch high shear mixers segment maintains its dominance in the High Shear Mixers Market, poised for continued growth and market leadership.
High Shear Mixers Market Share Analysis: Liquid Products market is poised to register the fastest growth rae over the forecast period to 2032
In the High Shear Mixers Market, the liquid products segment is the fastest-growing, driven by the increasing demand for high shear mixing solutions in industries such as food and beverage, pharmaceuticals, and cosmetics. High shear mixers play a crucial role in the production of liquid products, including emulsions, suspensions, creams, gels, and beverages, by facilitating the efficient blending, homogenizing, emulsifying, and dispersing of ingredients. The growing popularity of liquid-based products, such as sauces, dressings, creams, lotions, and pharmaceutical formulations, fuels the demand for high shear mixers capable of achieving precise and uniform product consistency. Additionally, advancements in processing technologies and the emergence of new formulations and product categories further drive the adoption of high shear mixers in liquid product manufacturing. Further, the versatility of high shear mixers in handling a wide range of viscosities, temperatures, and shear rates enhances their suitability for liquid product applications, contributing to their rapid growth in the market. As industries continue to innovate and expand their liquid product portfolios to meet evolving consumer preferences, the liquid products segment in the High Shear Mixers Market experiences rapid growth, poised to reshape the industry landscape.
High Shear Mixers Market Segmentation
By Type
Batch High Shear Mixers
Inline High Shear Mixers
Multi-Stage High Shear Mixers
By Application
Liquid Products
Solid Products
Countries Analyzed
North America (US, Canada, Mexico)
Europe (Germany, UK, France, Spain, Italy, Russia, Rest of Europe)
Asia Pacific (China, India, Japan, South Korea, Australia, South East Asia, Rest of Asia)
South America (Brazil, Argentina, Rest of South America)
Middle East and Africa (Saudi Arabia, UAE, Rest of Middle East, South Africa, Egypt, Rest of Africa)
High Shear Mixers Companies Profiled in the Study
Charles Ross & Son
GEA Group
Silverson
SPX FLOW
Tetra Pak International
*- List Not Exhaustive
Chapter 1. TABLE OF CONTENTS
Chapter 2. Introduction to High Shear Mixers Market
2.1. Market Overview
2.2. Key Statistics and Report Highlights
2.3. Scope of the Comprehensive Study
2.3.1. Market Definition
2.3.2 Countries and Regions Covered
2.3.3 Research Objective
2.3.4 Units, Currency, and Conversions
2.3.5 Industry Value Chain
2.4. Key Market Segments
2.5. Key Companies
2.6. Study Period
Chapter 3. Strategic Analysis Review
3.1. High Shear Mixers Pricing Analysis and Forecast
3.2. Porter’s Five Forces
3.3. Market Ecosystem
3.4. SWOT Analysis
3.5. Regulatory Scenario
3.3. Effects of Inflation, Russia-Ukraine War, moderating economic growth, and other macroeconomic factors
Chapter 4. Competitive Landscape
4.1. Market Share Analysis
4.1.1. Global High Shear Mixers Market Share by Company, 2023
4.1.2. Product Offerings of Leading High Shear Mixers Companies
4.2. Market Entropy
4.2.1. New Product Launches in the Industry
4.2.2. Mergers, Acquisitions, Joint ventures, and Partnerships
4.3. Key Strategies and Best Practices
Chapter 5. Global Market Projections: Best, Reference, and Low Case Scenarios
5.1. Growth Analysis- Case Scenario Definitions
5.2. Low Growth Case Scenario Forecasts
5.3. Reference Growth Case Scenario Forecasts
5.4. High Growth Case Scenario Forecasts
Chapter 6. Market Dynamics
6.1. High Shear Mixers Market Drivers
6.2. High Shear Mixers Market Challenges
6.6. High Shear Mixers Market Opportunities
6.4. High Shear Mixers Market Trends
Chapter 7. Global High Shear Mixers Market Outlook Trends
7.1. Global High Shear Mixers Revenue (USD Million) and CAGR (%) by Type (2021-2032)
7.2. Global High Shear Mixers Revenue (USD Million) and CAGR (%) by Application (2021-2032)
7.3. Global High Shear Mixers Revenue (USD Million) and CAGR (%) by Product (2021-2032)
By Type
Batch High Shear Mixers
Inline High Shear Mixers
Multi-Stage High Shear Mixers
By Application
Liquid Products
Solid Products
Chapter 8. Global High Shear Mixers Regional Analysis and Outlook
8.1. Global High Shear Mixers Revenue (USD Million) By Regions (2021- 2032)
8.2. North America High Shear Mixers Revenue (USD Million) by Country (2021-2032)
8.2.1. United States High Shear Mixers Regional Analysis and Outlook
8.2.2. Canada High Shear Mixers Regional Analysis and Outlook
8.2.3. Mexico High Shear Mixers Regional Analysis and Outlook
8.3. Europe High Shear Mixers Revenue (USD Million), by Country (2021-2032)
8.3.1. Germany High Shear Mixers Regional Analysis and Outlook
8.3.2. France High Shear Mixers Regional Analysis and Outlook
8.3.3. United Kingdom High Shear Mixers Regional Analysis and Outlook
8.3.4. Spain High Shear Mixers Regional Analysis and Outlook
8.3.5. Italy High Shear Mixers Regional Analysis and Outlook
8.3.6. Russia High Shear Mixers Regional Analysis and Outlook
8.3.7. Rest of Europe High Shear Mixers Regional Analysis and Outlook
8.4. Asia Pacific High Shear Mixers Revenue (USD Million) by Country (2021-2032)
8.4.1. China High Shear Mixers Regional Analysis and Outlook
8.4.2. Japan High Shear Mixers Regional Analysis and Outlook
8.4.3. India High Shear Mixers Regional Analysis and Outlook
8.4.4. South Korea High Shear Mixers Regional Analysis and Outlook
8.4.5. Australia High Shear Mixers Regional Analysis and Outlook
8.4.6. South East Asia High Shear Mixers Regional Analysis and Outlook
8.4.7. Rest of Asia Pacific High Shear Mixers Regional Analysis and Outlook
8.5. South America High Shear Mixers Revenue (USD Million), by Country (2021-2032)
8.5.1. Brazil High Shear Mixers Regional Analysis and Outlook
8.5.2. Argentina High Shear Mixers Regional Analysis and Outlook
8.5.3. Rest of South America High Shear Mixers Regional Analysis and Outlook
8.6. Middle East and Africa High Shear Mixers Revenue (USD Million) by Country (2021-2032)
8.6.1. Middle East High Shear Mixers Regional Analysis and Outlook
8.6.2. Africa High Shear Mixers Regional Analysis and Outlook
Chapter 9. North America High Shear Mixers Analysis and Outlook
9.1. North America High Shear Mixers Revenue (USD Million) by Segments (2021-2032)
9.1.1. North America High Shear Mixers Revenue (USD Million) by Type (2021-2032)
9.1.2. North America High Shear Mixers Revenue (USD Million) by Application (2021-2032)
9.1.3. North America High Shear Mixers Revenue (USD Million) by Product (2021-2032)
By Type
Batch High Shear Mixers
Inline High Shear Mixers
Multi-Stage High Shear Mixers
By Application
Liquid Products
Solid Products
Chapter 10. Europe High Shear Mixers Analysis and Outlook
10.1. Europe High Shear Mixers Revenue (USD Million), by Segments (USD Million) (2021-2032)
10.1.1. Europe High Shear Mixers Revenue (USD Million) by Type (2021-2032)
10.1.2. Europe High Shear Mixers Revenue (USD Million) by Application (2021-2032)
10.1.3. Europe High Shear Mixers Revenue (USD Million) by Product (2021-2032)
By Type
Batch High Shear Mixers
Inline High Shear Mixers
Multi-Stage High Shear Mixers
By Application
Liquid Products
Solid Products
Chapter 11. Asia Pacific High Shear Mixers Analysis and Outlook
11.1. Asia Pacific High Shear Mixers Revenue (USD Million), and Revenue (USD Million) by Segments (2021-2032)
11.1.1. Asia Pacific High Shear Mixers Revenue (USD Million) by Type (2021-2032)
11.1.2. Asia Pacific High Shear Mixers Revenue (USD Million) by Application (2021-2032)
11.1.3. Asia Pacific High Shear Mixers Revenue (USD Million) by Product (2021-2032)
By Type
Batch High Shear Mixers
Inline High Shear Mixers
Multi-Stage High Shear Mixers
By Application
Liquid Products
Solid Products
Chapter 12. South America High Shear Mixers Analysis and Outlook
12.1. South America High Shear Mixers Revenue (USD Million), by Segments (2021-2032)
12.1.1. South America High Shear Mixers Revenue (USD Million) by Type (2021-2032)
12.1.2. South America High Shear Mixers Revenue (USD Million) by Application (2021-2032)
12.1.3. South America High Shear Mixers Revenue (USD Million) by Product (2021-2032)
By Type
Batch High Shear Mixers
Inline High Shear Mixers
Multi-Stage High Shear Mixers
By Application
Liquid Products
Solid Products
Chapter 13. Middle East and Africa High Shear Mixers Analysis and Outlook
13.1. Middle East and Africa High Shear Mixers Revenue (USD Million), by Segments (2021-2032)
13.1.1. Middle East and Africa High Shear Mixers Revenue (USD Million) by Type (2021-2032)
13.1.2. Middle East and Africa High Shear Mixers Revenue (USD Million) by Application (2021-2032)
13.1.3. Middle East and Africa High Shear Mixers Revenue (USD Million) by Product (2021-2032)
By Type
Batch High Shear Mixers
Inline High Shear Mixers
Multi-Stage High Shear Mixers
By Application
Liquid Products
Solid Products
Chapter 14. High Shear Mixers Company Profiles
14.1 Business Overview
14.2 Product Profiles
14.3 SWOT Profiles
14.5 Recent Developments
14.6 Financial Profile
List of Companies
Charles Ross & Son
GEA Group
Silverson
SPX FLOW
Tetra Pak International
15. Methodology and Data Sources
15.1 Customization Offerings
15.2 Subscription Services
15.3 Related Reports
15.4 Publisher Expertise
LIST OF TABLES
Table 1 Market Segmentation Analysis
Table 2 Global High Shear Mixers Market Share of Leading Companies, 2023
Table 3 Product Offerings of Leading Companies
Table 4 Low Growth Scenario Forecasts
Table 5 Reference Case Growth Scenario
Table 6 High Growth Case Scenario
Table 7 Global High Shear Mixers Revenue (USD Million) And CAGR (%) By Type (2021-2032)
Table 8 Global High Shear Mixers Revenue (USD Million) And CAGR (%) By Application (2021-2032)
Table 9 Global High Shear Mixers Revenue (USD Million) And CAGR (%) By Product (2021-2032)
Table 10 Global High Shear Mixers Market Revenue (USD Million) By Regions (2021-2032)
Table 11 Global High Shear Mixers Market Share (%) By Regions (2021-2032)
Table 12 North America High Shear Mixers Revenue (USD Million) By Country (2021-2032)
Table 13 Europe High Shear Mixers Revenue (USD Million) By Country (2021-2032)
Table 14 Asia Pacific High Shear Mixers Revenue (USD Million) By Country (2021-2032)
Table 15 South America High Shear Mixers Revenue (USD Million) By Country (2021-2032)
Table 16 Middle East and Africa High Shear Mixers Revenue (USD Million) By Region (2021-2032)
Table 17 North America High Shear Mixers Revenue (USD Million) By Type (2021-2032)
Table 18 North America High Shear Mixers Revenue (USD Million) By Application (2021-2032)
Table 19 North America High Shear Mixers Revenue (USD Million) By Product (2021-2032)
Table 20 Europe High Shear Mixers Revenue (USD Million) By Type (2021-2032)
Table 21 Europe High Shear Mixers Revenue (USD Million) By Application (2021-2032)
Table 22 Europe High Shear Mixers Revenue (USD Million) By Product (2021-2032)
Table 23 Asia Pacific High Shear Mixers Revenue (USD Million) By Type (2021-2032)
Table 24 Asia Pacific High Shear Mixers Revenue (USD Million) By Application (2021-2032)
Table 25 Asia Pacific High Shear Mixers Revenue (USD Million) By Product (2021-2032)
Table 26 South America High Shear Mixers Revenue (USD Million) By Type (2021-2032)
Table 27 South America High Shear Mixers Revenue (USD Million) By Application (2021-2032)
Table 28 South America High Shear Mixers Revenue (USD Million) By Product (2021-2032)
Table 29 Middle East and Africa High Shear Mixers Revenue (USD Million) By Type (2021-2032)
Table 30 Middle East and Africa High Shear Mixers Revenue (USD Million) By Application (2021-2032)
Table 31 Middle East and Africa High Shear Mixers Revenue (USD Million) By Product (2021-2032)
LIST OF FIGURES
Figure 1. Market Scope
Figure 2. Pricing Forecasts Per Unit, 2023- 2032
Figure 3. Porter’s Five Forces
Figure 4. Global High Shear Mixers Market Revenue (USD Million) By Regions (2021-2032)
Figure 5. Global High Shear Mixers Market Share (%) By Regions (2023)
Figure 6. North America High Shear Mixers Revenue (USD Million) By Country (2021-2032)
Figure 7. United States High Shear Mixers Revenue (USD Million) By Country (2021-2032)
Figure 8. Canada High Shear Mixers Revenue (USD Million) By Country (2021-2032)
Figure 9. Mexico High Shear Mixers Revenue (USD Million) By Country (2021-2032)
Figure 10. Europe High Shear Mixers Revenue (USD Million) By Country (2021-2032)
Figure 11. Germany High Shear Mixers Revenue (USD Million) By Country (2021-2032)
Figure 12. France High Shear Mixers Revenue (USD Million) By Country (2021-2032)
Figure 13. United Kingdom High Shear Mixers Revenue (USD Million) By Country (2021-2032)
Figure 14. Spain High Shear Mixers Revenue (USD Million) By Country (2021-2032)
Figure 15. Italy High Shear Mixers Revenue (USD Million) By Country (2021-2032)
Figure 16. Russia High Shear Mixers Revenue (USD Million) By Country (2021-2032)
Figure 17. Rest of Europe High Shear Mixers Revenue (USD Million) By Country (2021-2032)
Figure 11. Asia Pacific High Shear Mixers Revenue (USD Million) By Country (2021-2032)
Figure 12. China High Shear Mixers Revenue (USD Million) By Country (2021-2032)
Figure 13. Japan High Shear Mixers Revenue (USD Million) By Country (2021-2032)
Figure 14. India High Shear Mixers Revenue (USD Million) By Country (2021-2032)
Figure 15. South Korea High Shear Mixers Revenue (USD Million) By Country (2021-2032)
Figure 16. Australia High Shear Mixers Revenue (USD Million) By Country (2021-2032)
Figure 17. South East Asia High Shear Mixers Revenue (USD Million) By Country (2021-2032)
Figure 18. South America High Shear Mixers Revenue (USD Million) By Country (2021-2032)
Figure 19. Brazil High Shear Mixers Revenue (USD Million) By Country (2021-2032)
Figure 20. Argentina High Shear Mixers Revenue (USD Million) By Country (2021-2032)
Figure 21. Rest of Asia Pacific High Shear Mixers Revenue (USD Million) By Country (2021-2032)
Figure 22. Middle East and Africa High Shear Mixers Revenue (USD Million) By Region (2021-2032)
Figure 23. Saudi Arabia High Shear Mixers Revenue (USD Million) By Region (2021-2032)
Figure 24. The UAE High Shear Mixers Revenue (USD Million) By Region (2021-2032)
Figure 25. Rest of Middle East High Shear Mixers Revenue (USD Million) By Region (2021-2032)
Figure 26. South Africa High Shear Mixers Revenue (USD Million) By Region (2021-2032)
Figure 27. Africa High Shear Mixers Revenue (USD Million) By Region (2021-2032)
Figure 28. North America High Shear Mixers Revenue (USD Million) By Type (2021-2032)
Figure 29. North America High Shear Mixers Revenue (USD Million) By Application (2021-2032)
Figure 30. North America High Shear Mixers Revenue (USD Million) By Product (2021-2032)
Figure 31. Europe High Shear Mixers Revenue (USD Million) By Type (2021-2032)
Figure 32. Europe High Shear Mixers Revenue (USD Million) By Application (2021-2032)
Figure 33. Europe High Shear Mixers Revenue (USD Million) By Product (2021-2032)
Figure 34. Asia Pacific High Shear Mixers Revenue (USD Million) By Type (2021-2032)
Figure 35. Asia Pacific High Shear Mixers Revenue (USD Million) By Application (2021-2032)
Figure 36. Asia Pacific High Shear Mixers Revenue (USD Million) By Product (2021-2032)
Figure 37. South America High Shear Mixers Revenue (USD Million) By Type (2021-2032)
Figure 38. South America High Shear Mixers Revenue (USD Million) By Application (2021-2032)
Figure 39. South America High Shear Mixers Revenue (USD Million) By Product (2021-2032)
Figure 40. Middle East and Africa High Shear Mixers Revenue (USD Million) By Type (2021-2032)
Figure 41. Middle East and Africa High Shear Mixers Revenue (USD Million) By Application (2021-2032)
Figure 42. Middle East and Africa High Shear Mixers Revenue (USD Million) By Product (2021-2032)
By Type
Batch High Shear Mixers
Inline High Shear Mixers
Multi-Stage High Shear Mixers
By Application
Liquid Products
Solid Products
Countries Analyzed
North America (US, Canada, Mexico)
Europe (Germany, UK, France, Spain, Italy, Russia, Rest of Europe)
Asia Pacific (China, India, Japan, South Korea, Australia, South East Asia, Rest of Asia)
South America (Brazil, Argentina, Rest of South America)
Middle East and Africa (Saudi Arabia, UAE, Rest of Middle East, South Africa, Egypt, Rest of Africa)
