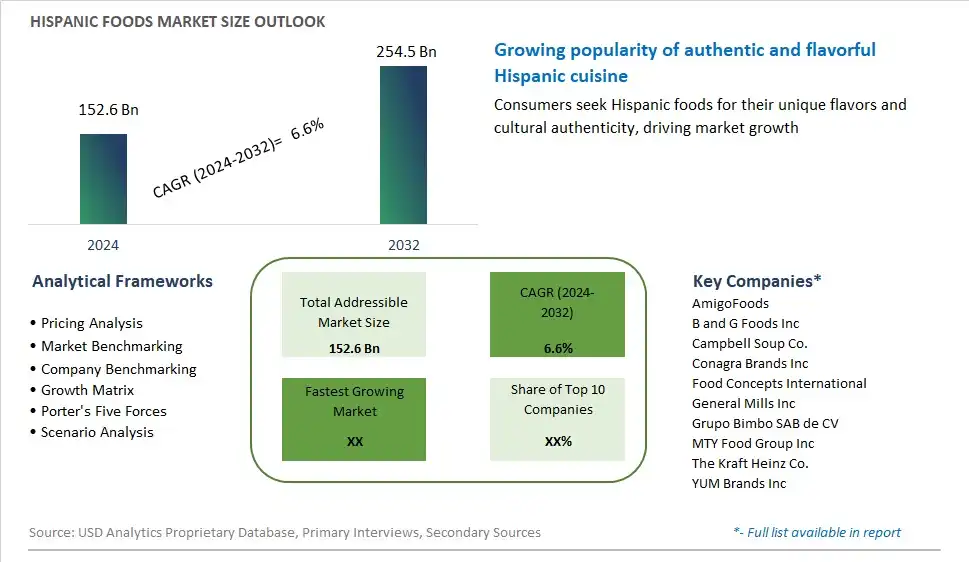
Global Hispanic Foods Market Size is valued at $152.6 Billion in 2024 and is forecast to register a growth rate (CAGR) of 6.6% to reach $254.5 Billion by 2032.
The global Hispanic Foods Market Comprehensive Study analyzes and forecasts the market size across 6 regions and 24 countries for diverse segments -By Type (Tacos, Burritos, Enchiladas, Tortillas, Others)
An Introduction to Hispanic Foods Market
In 2024, the market for Hispanic foods continues to expand as consumers embrace the diverse culinary traditions, flavors, and ingredients of Hispanic cuisine from countries such as Mexico, Spain, Cuba, and Colombia. Hispanic foods are characterized by bold and vibrant flavors, including spices, herbs, chilies, and traditional cooking techniques that create unique and savory dishes. With a growing Hispanic population and increasing cultural diversity, Hispanic foods have gained popularity and mainstream appeal among consumers of all backgrounds seeking authentic and flavorful dining experiences. Moreover, the rise of globalization, travel, and social media has facilitated greater exposure to Hispanic cuisine, sparking interest and curiosity among food enthusiasts and home cooks. As a result, retailers, restaurants, and food manufacturers are expanding their product offerings to include a wide range of Hispanic foods, including tortillas, tacos, salsas, mole sauces, empanadas, and paellas, catering to diverse tastes and preferences. With a focus on authenticity, quality, and innovation, the market for Hispanic foods is poised for continued growth, offering opportunities for culinary exploration, cross-cultural exchange, and the celebration of Latin American heritage and cuisine.
Hispanic Foods Competitive Landscape
The market report analyses the leading companies in the industry including AmigoFoods, B and G Foods Inc, Campbell Soup Co., Conagra Brands Inc, Food Concepts International, General Mills Inc, Grupo Bimbo SAB de CV, MTY Food Group Inc, The Kraft Heinz Co. , YUM Brands Inc, and Others.
Hispanic Foods Market Dynamics
Hispanic Foods Market Trend: Increasing Diversity and Popularity of Hispanic Cuisine
The market for Hispanic foods is experiencing a prominent trend towards increasing diversity and popularity of Hispanic cuisine, driven by demographic shifts, cultural influences, and changing consumer preferences. As Hispanic populations continue to grow and multiculturalism becomes more prevalent, there is a rising demand for authentic Hispanic foods and flavors among consumers of all backgrounds. This trend is fueled by a desire for culinary exploration, nostalgia for traditional dishes, and the influence of Hispanic culture on mainstream food trends. As a result, Hispanic foods such as tacos, enchiladas, empanadas, and ceviche are becoming more widely available and celebrated, both in restaurants and in retail outlets, reflecting the rich culinary heritage and vibrant flavors of Hispanic cuisine.
Market Driver: Increasing Ethnic Diversity and Immigration
A key driver propelling the market for Hispanic foods is the increasing ethnic diversity and immigration trends, particularly in regions with large Hispanic populations such as the United States, Europe, and Latin America. As immigrant communities preserve and share their culinary traditions with the broader society, there is a growing appreciation for Hispanic foods and ingredients among mainstream consumers. Additionally, the influence of Hispanic culture on popular culture, including music, television, and social media, further contributes to the visibility and appeal of Hispanic foods, driving market growth and expansion. This demographic shift creates opportunities for food manufacturers, retailers, and restaurateurs to cater to diverse consumer preferences and capitalize on the growing demand for Hispanic foods and flavors.
Market Opportunity: Innovation and Fusion in Hispanic Cuisine
An opportunity exists for the Hispanic foods market to innovate and evolve by embracing fusion cuisine and incorporating modern culinary techniques and ingredients while staying true to traditional Hispanic flavors and cooking methods. By combining Hispanic ingredients and cooking styles with global influences, chefs and food entrepreneurs can create innovative dishes and products that appeal to a wider audience and reflect the multicultural landscape of contemporary cuisine. Moreover, leveraging technology and social media platforms can help promote Hispanic foods to new demographics and facilitate cultural exchange and appreciation. This opportunity allows the Hispanic foods market to remain dynamic and relevant in an increasingly diverse and interconnected culinary landscape, fostering creativity, entrepreneurship, and culinary exploration.
Hispanic Foods Market Share Analysis: Tortillas held the dominant market share in 2024
In the Hispanic Foods Market, the tortillas segment is the largest, driven by its versatility, widespread consumption, and integral role in Hispanic cuisine. Tortillas, flatbreads made from corn or wheat flour, serve as a staple food item in Hispanic diets, forming the foundation of many traditional dishes. They are a fundamental component of popular Mexican and Latin American cuisines, serving as the base for tacos, burritos, enchiladas, quesadillas, and more. Their adaptability allows for a wide variety of fillings, from meats and vegetables to cheeses and sauces, catering to diverse flavor preferences. Additionally, tortillas offer convenience and portability, making them a convenient option for meals on the go or for entertaining. Furthermore, the growing popularity of Hispanic cuisine globally has propelled the demand for tortillas as consumers embrace the flavors and textures of authentic Latin American dishes. As a result of their ubiquity, versatility, and cultural significance, the tortillas segment maintains its dominance in the Hispanic Foods Market, poised for continued growth and market leadership.
Hispanic Foods Market Segmentation
By Type
Tacos
Burritos
Enchiladas
Tortillas
Others
Countries Analyzed
North America (US, Canada, Mexico)
Europe (Germany, UK, France, Spain, Italy, Russia, Rest of Europe)
Asia Pacific (China, India, Japan, South Korea, Australia, South East Asia, Rest of Asia)
South America (Brazil, Argentina, Rest of South America)
Middle East and Africa (Saudi Arabia, UAE, Rest of Middle East, South Africa, Egypt, Rest of Africa)
Hispanic Foods Companies Profiled in the Study
AmigoFoods
B and G Foods Inc
Campbell Soup Co.
Conagra Brands Inc
Food Concepts International
General Mills Inc
Grupo Bimbo SAB de CV
MTY Food Group Inc
The Kraft Heinz Co.
YUM Brands Inc
*- List Not Exhaustive
Chapter 1. TABLE OF CONTENTS
Chapter 2. Introduction to Hispanic Foods Market
2.1. Market Overview
2.2. Key Statistics and Report Highlights
2.3. Scope of the Comprehensive Study
2.3.1. Market Definition
2.3.2 Countries and Regions Covered
2.3.3 Research Objective
2.3.4 Units, Currency, and Conversions
2.3.5 Industry Value Chain
2.4. Key Market Segments
2.5. Key Companies
2.6. Study Period
Chapter 3. Strategic Analysis Review
3.1. Hispanic Foods Pricing Analysis and Forecast
3.2. Porter’s Five Forces
3.3. Market Ecosystem
3.4. SWOT Analysis
3.5. Regulatory Scenario
3.3. Effects of Inflation, Russia-Ukraine War, moderating economic growth, and other macroeconomic factors
Chapter 4. Competitive Landscape
4.1. Market Share Analysis
4.1.1. Global Hispanic Foods Market Share by Company, 2023
4.1.2. Product Offerings of Leading Hispanic Foods Companies
4.2. Market Entropy
4.2.1. New Product Launches in the Industry
4.2.2. Mergers, Acquisitions, Joint ventures, and Partnerships
4.3. Key Strategies and Best Practices
Chapter 5. Global Market Projections: Best, Reference, and Low Case Scenarios
5.1. Growth Analysis- Case Scenario Definitions
5.2. Low Growth Case Scenario Forecasts
5.3. Reference Growth Case Scenario Forecasts
5.4. High Growth Case Scenario Forecasts
Chapter 6. Market Dynamics
6.1. Hispanic Foods Market Drivers
6.2. Hispanic Foods Market Challenges
6.6. Hispanic Foods Market Opportunities
6.4. Hispanic Foods Market Trends
Chapter 7. Global Hispanic Foods Market Outlook Trends
7.1. Global Hispanic Foods Revenue (USD Million) and CAGR (%) by Type (2021-2032)
7.2. Global Hispanic Foods Revenue (USD Million) and CAGR (%) by Application (2021-2032)
7.3. Global Hispanic Foods Revenue (USD Million) and CAGR (%) by Product (2021-2032)
By Type
Tacos
Burritos
Enchiladas
Tortillas
Others
Chapter 8. Global Hispanic Foods Regional Analysis and Outlook
8.1. Global Hispanic Foods Revenue (USD Million) By Regions (2021- 2032)
8.2. North America Hispanic Foods Revenue (USD Million) by Country (2021-2032)
8.2.1. United States Hispanic Foods Regional Analysis and Outlook
8.2.2. Canada Hispanic Foods Regional Analysis and Outlook
8.2.3. Mexico Hispanic Foods Regional Analysis and Outlook
8.3. Europe Hispanic Foods Revenue (USD Million), by Country (2021-2032)
8.3.1. Germany Hispanic Foods Regional Analysis and Outlook
8.3.2. France Hispanic Foods Regional Analysis and Outlook
8.3.3. United Kingdom Hispanic Foods Regional Analysis and Outlook
8.3.4. Spain Hispanic Foods Regional Analysis and Outlook
8.3.5. Italy Hispanic Foods Regional Analysis and Outlook
8.3.6. Russia Hispanic Foods Regional Analysis and Outlook
8.3.7. Rest of Europe Hispanic Foods Regional Analysis and Outlook
8.4. Asia Pacific Hispanic Foods Revenue (USD Million) by Country (2021-2032)
8.4.1. China Hispanic Foods Regional Analysis and Outlook
8.4.2. Japan Hispanic Foods Regional Analysis and Outlook
8.4.3. India Hispanic Foods Regional Analysis and Outlook
8.4.4. South Korea Hispanic Foods Regional Analysis and Outlook
8.4.5. Australia Hispanic Foods Regional Analysis and Outlook
8.4.6. South East Asia Hispanic Foods Regional Analysis and Outlook
8.4.7. Rest of Asia Pacific Hispanic Foods Regional Analysis and Outlook
8.5. South America Hispanic Foods Revenue (USD Million), by Country (2021-2032)
8.5.1. Brazil Hispanic Foods Regional Analysis and Outlook
8.5.2. Argentina Hispanic Foods Regional Analysis and Outlook
8.5.3. Rest of South America Hispanic Foods Regional Analysis and Outlook
8.6. Middle East and Africa Hispanic Foods Revenue (USD Million) by Country (2021-2032)
8.6.1. Middle East Hispanic Foods Regional Analysis and Outlook
8.6.2. Africa Hispanic Foods Regional Analysis and Outlook
Chapter 9. North America Hispanic Foods Analysis and Outlook
9.1. North America Hispanic Foods Revenue (USD Million) by Segments (2021-2032)
9.1.1. North America Hispanic Foods Revenue (USD Million) by Type (2021-2032)
9.1.2. North America Hispanic Foods Revenue (USD Million) by Application (2021-2032)
9.1.3. North America Hispanic Foods Revenue (USD Million) by Product (2021-2032)
By Type
Tacos
Burritos
Enchiladas
Tortillas
Others
Chapter 10. Europe Hispanic Foods Analysis and Outlook
10.1. Europe Hispanic Foods Revenue (USD Million), by Segments (USD Million) (2021-2032)
10.1.1. Europe Hispanic Foods Revenue (USD Million) by Type (2021-2032)
10.1.2. Europe Hispanic Foods Revenue (USD Million) by Application (2021-2032)
10.1.3. Europe Hispanic Foods Revenue (USD Million) by Product (2021-2032)
By Type
Tacos
Burritos
Enchiladas
Tortillas
Others
Chapter 11. Asia Pacific Hispanic Foods Analysis and Outlook
11.1. Asia Pacific Hispanic Foods Revenue (USD Million), and Revenue (USD Million) by Segments (2021-2032)
11.1.1. Asia Pacific Hispanic Foods Revenue (USD Million) by Type (2021-2032)
11.1.2. Asia Pacific Hispanic Foods Revenue (USD Million) by Application (2021-2032)
11.1.3. Asia Pacific Hispanic Foods Revenue (USD Million) by Product (2021-2032)
By Type
Tacos
Burritos
Enchiladas
Tortillas
Others
Chapter 12. South America Hispanic Foods Analysis and Outlook
12.1. South America Hispanic Foods Revenue (USD Million), by Segments (2021-2032)
12.1.1. South America Hispanic Foods Revenue (USD Million) by Type (2021-2032)
12.1.2. South America Hispanic Foods Revenue (USD Million) by Application (2021-2032)
12.1.3. South America Hispanic Foods Revenue (USD Million) by Product (2021-2032)
By Type
Tacos
Burritos
Enchiladas
Tortillas
Others
Chapter 13. Middle East and Africa Hispanic Foods Analysis and Outlook
13.1. Middle East and Africa Hispanic Foods Revenue (USD Million), by Segments (2021-2032)
13.1.1. Middle East and Africa Hispanic Foods Revenue (USD Million) by Type (2021-2032)
13.1.2. Middle East and Africa Hispanic Foods Revenue (USD Million) by Application (2021-2032)
13.1.3. Middle East and Africa Hispanic Foods Revenue (USD Million) by Product (2021-2032)
By Type
Tacos
Burritos
Enchiladas
Tortillas
Others
Chapter 14. Hispanic Foods Company Profiles
14.1 Business Overview
14.2 Product Profiles
14.3 SWOT Profiles
14.5 Recent Developments
14.6 Financial Profile
List of Companies
AmigoFoods
B and G Foods Inc
Campbell Soup Co.
Conagra Brands Inc
Food Concepts International
General Mills Inc
Grupo Bimbo SAB de CV
MTY Food Group Inc
The Kraft Heinz Co.
YUM Brands Inc
15. Methodology and Data Sources
15.1 Customization Offerings
15.2 Subscription Services
15.3 Related Reports
15.4 Publisher Expertise
LIST OF TABLES
Table 1 Market Segmentation Analysis
Table 2 Global Hispanic Foods Market Share of Leading Companies, 2023
Table 3 Product Offerings of Leading Companies
Table 4 Low Growth Scenario Forecasts
Table 5 Reference Case Growth Scenario
Table 6 High Growth Case Scenario
Table 7 Global Hispanic Foods Revenue (USD Million) And CAGR (%) By Type (2021-2032)
Table 8 Global Hispanic Foods Revenue (USD Million) And CAGR (%) By Application (2021-2032)
Table 9 Global Hispanic Foods Revenue (USD Million) And CAGR (%) By Product (2021-2032)
Table 10 Global Hispanic Foods Market Revenue (USD Million) By Regions (2021-2032)
Table 11 Global Hispanic Foods Market Share (%) By Regions (2021-2032)
Table 12 North America Hispanic Foods Revenue (USD Million) By Country (2021-2032)
Table 13 Europe Hispanic Foods Revenue (USD Million) By Country (2021-2032)
Table 14 Asia Pacific Hispanic Foods Revenue (USD Million) By Country (2021-2032)
Table 15 South America Hispanic Foods Revenue (USD Million) By Country (2021-2032)
Table 16 Middle East and Africa Hispanic Foods Revenue (USD Million) By Region (2021-2032)
Table 17 North America Hispanic Foods Revenue (USD Million) By Type (2021-2032)
Table 18 North America Hispanic Foods Revenue (USD Million) By Application (2021-2032)
Table 19 North America Hispanic Foods Revenue (USD Million) By Product (2021-2032)
Table 20 Europe Hispanic Foods Revenue (USD Million) By Type (2021-2032)
Table 21 Europe Hispanic Foods Revenue (USD Million) By Application (2021-2032)
Table 22 Europe Hispanic Foods Revenue (USD Million) By Product (2021-2032)
Table 23 Asia Pacific Hispanic Foods Revenue (USD Million) By Type (2021-2032)
Table 24 Asia Pacific Hispanic Foods Revenue (USD Million) By Application (2021-2032)
Table 25 Asia Pacific Hispanic Foods Revenue (USD Million) By Product (2021-2032)
Table 26 South America Hispanic Foods Revenue (USD Million) By Type (2021-2032)
Table 27 South America Hispanic Foods Revenue (USD Million) By Application (2021-2032)
Table 28 South America Hispanic Foods Revenue (USD Million) By Product (2021-2032)
Table 29 Middle East and Africa Hispanic Foods Revenue (USD Million) By Type (2021-2032)
Table 30 Middle East and Africa Hispanic Foods Revenue (USD Million) By Application (2021-2032)
Table 31 Middle East and Africa Hispanic Foods Revenue (USD Million) By Product (2021-2032)
LIST OF FIGURES
Figure 1. Market Scope
Figure 2. Pricing Forecasts Per Unit, 2023- 2032
Figure 3. Porter’s Five Forces
Figure 4. Global Hispanic Foods Market Revenue (USD Million) By Regions (2021-2032)
Figure 5. Global Hispanic Foods Market Share (%) By Regions (2023)
Figure 6. North America Hispanic Foods Revenue (USD Million) By Country (2021-2032)
Figure 7. United States Hispanic Foods Revenue (USD Million) By Country (2021-2032)
Figure 8. Canada Hispanic Foods Revenue (USD Million) By Country (2021-2032)
Figure 9. Mexico Hispanic Foods Revenue (USD Million) By Country (2021-2032)
Figure 10. Europe Hispanic Foods Revenue (USD Million) By Country (2021-2032)
Figure 11. Germany Hispanic Foods Revenue (USD Million) By Country (2021-2032)
Figure 12. France Hispanic Foods Revenue (USD Million) By Country (2021-2032)
Figure 13. United Kingdom Hispanic Foods Revenue (USD Million) By Country (2021-2032)
Figure 14. Spain Hispanic Foods Revenue (USD Million) By Country (2021-2032)
Figure 15. Italy Hispanic Foods Revenue (USD Million) By Country (2021-2032)
Figure 16. Russia Hispanic Foods Revenue (USD Million) By Country (2021-2032)
Figure 17. Rest of Europe Hispanic Foods Revenue (USD Million) By Country (2021-2032)
Figure 11. Asia Pacific Hispanic Foods Revenue (USD Million) By Country (2021-2032)
Figure 12. China Hispanic Foods Revenue (USD Million) By Country (2021-2032)
Figure 13. Japan Hispanic Foods Revenue (USD Million) By Country (2021-2032)
Figure 14. India Hispanic Foods Revenue (USD Million) By Country (2021-2032)
Figure 15. South Korea Hispanic Foods Revenue (USD Million) By Country (2021-2032)
Figure 16. Australia Hispanic Foods Revenue (USD Million) By Country (2021-2032)
Figure 17. South East Asia Hispanic Foods Revenue (USD Million) By Country (2021-2032)
Figure 18. South America Hispanic Foods Revenue (USD Million) By Country (2021-2032)
Figure 19. Brazil Hispanic Foods Revenue (USD Million) By Country (2021-2032)
Figure 20. Argentina Hispanic Foods Revenue (USD Million) By Country (2021-2032)
Figure 21. Rest of Asia Pacific Hispanic Foods Revenue (USD Million) By Country (2021-2032)
Figure 22. Middle East and Africa Hispanic Foods Revenue (USD Million) By Region (2021-2032)
Figure 23. Saudi Arabia Hispanic Foods Revenue (USD Million) By Region (2021-2032)
Figure 24. The UAE Hispanic Foods Revenue (USD Million) By Region (2021-2032)
Figure 25. Rest of Middle East Hispanic Foods Revenue (USD Million) By Region (2021-2032)
Figure 26. South Africa Hispanic Foods Revenue (USD Million) By Region (2021-2032)
Figure 27. Africa Hispanic Foods Revenue (USD Million) By Region (2021-2032)
Figure 28. North America Hispanic Foods Revenue (USD Million) By Type (2021-2032)
Figure 29. North America Hispanic Foods Revenue (USD Million) By Application (2021-2032)
Figure 30. North America Hispanic Foods Revenue (USD Million) By Product (2021-2032)
Figure 31. Europe Hispanic Foods Revenue (USD Million) By Type (2021-2032)
Figure 32. Europe Hispanic Foods Revenue (USD Million) By Application (2021-2032)
Figure 33. Europe Hispanic Foods Revenue (USD Million) By Product (2021-2032)
Figure 34. Asia Pacific Hispanic Foods Revenue (USD Million) By Type (2021-2032)
Figure 35. Asia Pacific Hispanic Foods Revenue (USD Million) By Application (2021-2032)
Figure 36. Asia Pacific Hispanic Foods Revenue (USD Million) By Product (2021-2032)
Figure 37. South America Hispanic Foods Revenue (USD Million) By Type (2021-2032)
Figure 38. South America Hispanic Foods Revenue (USD Million) By Application (2021-2032)
Figure 39. South America Hispanic Foods Revenue (USD Million) By Product (2021-2032)
Figure 40. Middle East and Africa Hispanic Foods Revenue (USD Million) By Type (2021-2032)
Figure 41. Middle East and Africa Hispanic Foods Revenue (USD Million) By Application (2021-2032)
Figure 42. Middle East and Africa Hispanic Foods Revenue (USD Million) By Product (2021-2032)
By Type
Tacos
Burritos
Enchiladas
Tortillas
Others
Countries Analyzed
North America (US, Canada, Mexico)
Europe (Germany, UK, France, Spain, Italy, Russia, Rest of Europe)
Asia Pacific (China, India, Japan, South Korea, Australia, South East Asia, Rest of Asia)
South America (Brazil, Argentina, Rest of South America)
Middle East and Africa (Saudi Arabia, UAE, Rest of Middle East, South Africa, Egypt, Rest of Africa)
