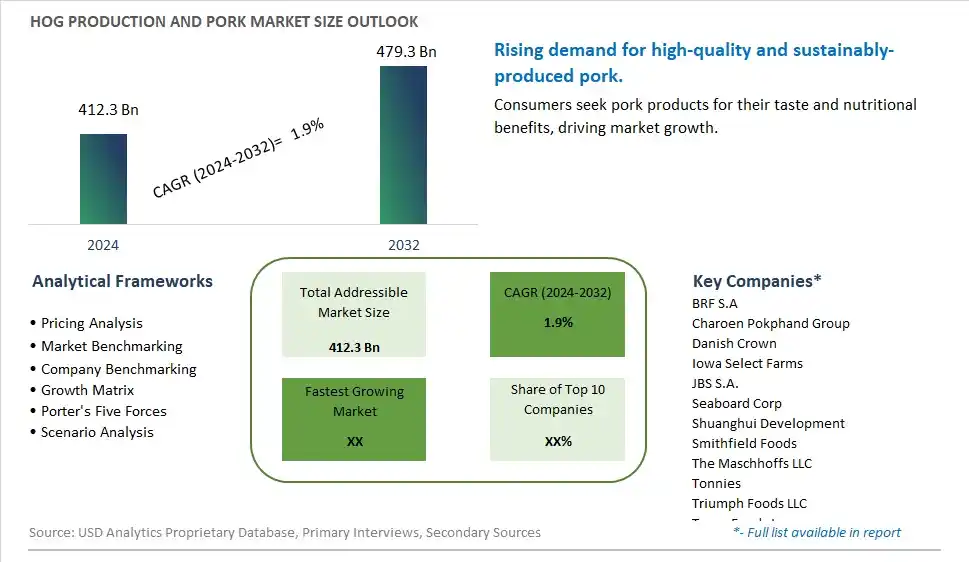
Global Hog Production and Pork Market Size is valued at $412.3 Billion in 2024 and is forecast to register a growth rate (CAGR) of 1.9% to reach $479.3 Billion by 2032.
The global Hog Production and Pork Market Comprehensive Study analyzes and forecasts the market size across 6 regions and 24 countries for diverse segments -By Form (Raw, Frozen, Processed), By Application (Direct, Hypermarkets/Supermarkets, Convenience Stores, Specialty Stores, Online Retailing, Others)
An Introduction to Hog Production and Pork Market
The hog production and pork market in 2024 is experiencing significant advancements driven by technological innovations and sustainable practices. With increasing consumer demand for high-quality, ethically produced meat, farmers are adopting precision farming techniques, enhanced breeding programs, and improved animal welfare standards. Market trends indicate a surge in organic and free-range pork products, catering to health-conscious and environmentally aware consumers. Additionally, the integration of blockchain technology ensures traceability and transparency in the supply chain, enhancing consumer trust and compliance with stringent regulatory standards.
Hog Production and Pork Competitive Landscape
The market report analyses the leading companies in the industry including BRF S.A, Charoen Pokphand Group, Danish Crown, Iowa Select Farms, JBS S.A., Seaboard Corp, Shuanghui Development, Smithfield Foods, The Maschhoffs LLC, Tonnies, Triumph Foods LLC, Tyson Foods Inc, Vion Food Group Ltd, Wan Chau International Ltd, WH Group, Yurun Group, and Others.
Hog Production and Pork Market Dynamics
Hog Production and Pork Market Trend: Increasing Demand for Organic and Antibiotic-Free Pork
The most prominent trend in the Hog Production and Pork Market is the increasing demand for organic and antibiotic-free pork. As consumers become more concerned about food safety, animal welfare, and environmental sustainability, there is a growing preference for pork products that are produced without the use of antibiotics and synthetic chemicals. This trend is driving producers to adopt organic farming practices and focus on raising hogs in more natural and humane conditions. The demand for organic and antibiotic-free pork is expected to continue rising as consumers prioritize health and sustainability in their food choices.
Hog Production and Pork Market Driver: Rising Global Meat Consumption
A key driver for the Hog Production and Pork Market is the rising global meat consumption. As populations grow and incomes increase, particularly in developing regions, the demand for meat, including pork, is on the rise. Pork is a popular source of protein in many cultures, and its consumption is expected to continue growing. This rising demand for pork is driving the expansion of hog production facilities and the adoption of more efficient farming practices to meet the increasing global appetite for pork products.
Hog Production and Pork Market Opportunity: Adoption of Advanced Farming Technologies
One potential opportunity in the Hog Production and Pork Market lies in the adoption of advanced farming technologies. Innovations such as precision farming, automation, and data analytics can help producers improve efficiency, reduce costs, and enhance the overall quality of pork products. By investing in these advanced technologies, hog producers can optimize their operations, improve animal health and welfare, and increase production capacity. This can create significant growth opportunities in the market and help producers meet the growing demand for high-quality pork.
Hog Production and Pork Market Share Analysis: Frozen Pork segment generated the highest revenue share in the industry
The largest segment in the Hog Production and Pork Market by form is frozen pork. Frozen pork products are widely consumed and traded globally due to their longer shelf life, convenience in storage and distribution, and ability to maintain quality over extended periods. Frozen pork includes various cuts and processed forms that cater to diverse culinary preferences and cooking methods. This segment's dominance is driven by factors such as increased international trade, growing demand for preserved meat products in food service industries, and preferences for frozen meat due to its availability year-round regardless of seasonal fluctuations in fresh pork supply.
Hog Production and Pork Market Share Analysis: Online Retailing is the fastest growing segment over the forecast period to 2032
The fastest growing segment in the Hog Production and Pork Market by application is online retailing. The rise of online shopping platforms has revolutionized how consumers purchase pork products, offering convenience, variety, and often competitive pricing compared to traditional retail outlets. Online retailing of pork products appeals to a broad demographic, including busy urban consumers, who prefer the ease of ordering pork cuts or processed pork products from their homes or workplaces. This trend is further accelerated by advancements in e-commerce technologies, secure payment gateways, and efficient logistics networks that ensure timely delivery of frozen or processed pork to customers' doorsteps. As online retailing continues to expand globally, the hog production and pork market is increasingly leveraging digital platforms to enhance customer engagement, provide personalized shopping experiences, and tap into emerging markets beyond geographical boundaries.
Hog Production and Pork Market Segmentation
By Form
Raw
Frozen
Processed
By Application
Direct
Hypermarkets/Supermarkets
Convenience Stores
Specialty Stores
Online Retailing
Others
Countries Analyzed
North America (US, Canada, Mexico)
Europe (Germany, UK, France, Spain, Italy, Russia, Rest of Europe)
Asia Pacific (China, India, Japan, South Korea, Australia, South East Asia, Rest of Asia)
South America (Brazil, Argentina, Rest of South America)
Middle East and Africa (Saudi Arabia, UAE, Rest of Middle East, South Africa, Egypt, Rest of Africa)
Hog Production and Pork Companies Profiled in the Study
BRF S.A
Charoen Pokphand Group
Danish Crown
Iowa Select Farms
JBS S.A.
Seaboard Corp
Shuanghui Development
Smithfield Foods
The Maschhoffs LLC
Tonnies
Triumph Foods LLC
Tyson Foods Inc
Vion Food Group Ltd
Wan Chau International Ltd
WH Group
Yurun Group
*- List Not Exhaustive
Chapter 1. TABLE OF CONTENTS
Chapter 2. Introduction to Hog Production and Pork Market
2.1. Market Overview
2.2. Key Statistics and Report Highlights
2.3. Scope of the Comprehensive Study
2.3.1. Market Definition
2.3.2 Countries and Regions Covered
2.3.3 Research Objective
2.3.4 Units, Currency, and Conversions
2.3.5 Industry Value Chain
2.4. Key Market Segments
2.5. Key Companies
2.6. Study Period
Chapter 3. Strategic Analysis Review
3.1. Hog Production and Pork Pricing Analysis and Forecast
3.2. Porter’s Five Forces
3.3. Market Ecosystem
3.4. SWOT Analysis
3.5. Regulatory Scenario
3.3. Effects of Inflation, Russia-Ukraine War, moderating economic growth, and other macroeconomic factors
Chapter 4. Competitive Landscape
4.1. Market Share Analysis
4.1.1. Global Hog Production and Pork Market Share by Company, 2023
4.1.2. Product Offerings of Leading Hog Production and Pork Companies
4.2. Market Entropy
4.2.1. New Product Launches in the Industry
4.2.2. Mergers, Acquisitions, Joint ventures, and Partnerships
4.3. Key Strategies and Best Practices
Chapter 5. Global Market Projections: Best, Reference, and Low Case Scenarios
5.1. Growth Analysis- Case Scenario Definitions
5.2. Low Growth Case Scenario Forecasts
5.3. Reference Growth Case Scenario Forecasts
5.4. High Growth Case Scenario Forecasts
Chapter 6. Market Dynamics
6.1. Hog Production and Pork Market Drivers
6.2. Hog Production and Pork Market Challenges
6.6. Hog Production and Pork Market Opportunities
6.4. Hog Production and Pork Market Trends
Chapter 7. Global Hog Production and Pork Market Outlook Trends
7.1. Global Hog Production and Pork Revenue (USD Million) and CAGR (%) by Type (2021-2032)
7.2. Global Hog Production and Pork Revenue (USD Million) and CAGR (%) by Application (2021-2032)
7.3. Global Hog Production and Pork Revenue (USD Million) and CAGR (%) by Product (2021-2032)
By Form
Raw
Frozen
Processed
By Application
Direct
Hypermarkets/Supermarkets
Convenience Stores
Specialty Stores
Online Retailing
Others
Chapter 8. Global Hog Production and Pork Regional Analysis and Outlook
8.1. Global Hog Production and Pork Revenue (USD Million) By Regions (2021- 2032)
8.2. North America Hog Production and Pork Revenue (USD Million) by Country (2021-2032)
8.2.1. United States Hog Production and Pork Regional Analysis and Outlook
8.2.2. Canada Hog Production and Pork Regional Analysis and Outlook
8.2.3. Mexico Hog Production and Pork Regional Analysis and Outlook
8.3. Europe Hog Production and Pork Revenue (USD Million), by Country (2021-2032)
8.3.1. Germany Hog Production and Pork Regional Analysis and Outlook
8.3.2. France Hog Production and Pork Regional Analysis and Outlook
8.3.3. United Kingdom Hog Production and Pork Regional Analysis and Outlook
8.3.4. Spain Hog Production and Pork Regional Analysis and Outlook
8.3.5. Italy Hog Production and Pork Regional Analysis and Outlook
8.3.6. Russia Hog Production and Pork Regional Analysis and Outlook
8.3.7. Rest of Europe Hog Production and Pork Regional Analysis and Outlook
8.4. Asia Pacific Hog Production and Pork Revenue (USD Million) by Country (2021-2032)
8.4.1. China Hog Production and Pork Regional Analysis and Outlook
8.4.2. Japan Hog Production and Pork Regional Analysis and Outlook
8.4.3. India Hog Production and Pork Regional Analysis and Outlook
8.4.4. South Korea Hog Production and Pork Regional Analysis and Outlook
8.4.5. Australia Hog Production and Pork Regional Analysis and Outlook
8.4.6. South East Asia Hog Production and Pork Regional Analysis and Outlook
8.4.7. Rest of Asia Pacific Hog Production and Pork Regional Analysis and Outlook
8.5. South America Hog Production and Pork Revenue (USD Million), by Country (2021-2032)
8.5.1. Brazil Hog Production and Pork Regional Analysis and Outlook
8.5.2. Argentina Hog Production and Pork Regional Analysis and Outlook
8.5.3. Rest of South America Hog Production and Pork Regional Analysis and Outlook
8.6. Middle East and Africa Hog Production and Pork Revenue (USD Million) by Country (2021-2032)
8.6.1. Middle East Hog Production and Pork Regional Analysis and Outlook
8.6.2. Africa Hog Production and Pork Regional Analysis and Outlook
Chapter 9. North America Hog Production and Pork Analysis and Outlook
9.1. North America Hog Production and Pork Revenue (USD Million) by Segments (2021-2032)
9.1.1. North America Hog Production and Pork Revenue (USD Million) by Type (2021-2032)
9.1.2. North America Hog Production and Pork Revenue (USD Million) by Application (2021-2032)
9.1.3. North America Hog Production and Pork Revenue (USD Million) by Product (2021-2032)
By Form
Raw
Frozen
Processed
By Application
Direct
Hypermarkets/Supermarkets
Convenience Stores
Specialty Stores
Online Retailing
Others
Chapter 10. Europe Hog Production and Pork Analysis and Outlook
10.1. Europe Hog Production and Pork Revenue (USD Million), by Segments (USD Million) (2021-2032)
10.1.1. Europe Hog Production and Pork Revenue (USD Million) by Type (2021-2032)
10.1.2. Europe Hog Production and Pork Revenue (USD Million) by Application (2021-2032)
10.1.3. Europe Hog Production and Pork Revenue (USD Million) by Product (2021-2032)
By Form
Raw
Frozen
Processed
By Application
Direct
Hypermarkets/Supermarkets
Convenience Stores
Specialty Stores
Online Retailing
Others
Chapter 11. Asia Pacific Hog Production and Pork Analysis and Outlook
11.1. Asia Pacific Hog Production and Pork Revenue (USD Million), and Revenue (USD Million) by Segments (2021-2032)
11.1.1. Asia Pacific Hog Production and Pork Revenue (USD Million) by Type (2021-2032)
11.1.2. Asia Pacific Hog Production and Pork Revenue (USD Million) by Application (2021-2032)
11.1.3. Asia Pacific Hog Production and Pork Revenue (USD Million) by Product (2021-2032)
By Form
Raw
Frozen
Processed
By Application
Direct
Hypermarkets/Supermarkets
Convenience Stores
Specialty Stores
Online Retailing
Others
Chapter 12. South America Hog Production and Pork Analysis and Outlook
12.1. South America Hog Production and Pork Revenue (USD Million), by Segments (2021-2032)
12.1.1. South America Hog Production and Pork Revenue (USD Million) by Type (2021-2032)
12.1.2. South America Hog Production and Pork Revenue (USD Million) by Application (2021-2032)
12.1.3. South America Hog Production and Pork Revenue (USD Million) by Product (2021-2032)
By Form
Raw
Frozen
Processed
By Application
Direct
Hypermarkets/Supermarkets
Convenience Stores
Specialty Stores
Online Retailing
Others
Chapter 13. Middle East and Africa Hog Production and Pork Analysis and Outlook
13.1. Middle East and Africa Hog Production and Pork Revenue (USD Million), by Segments (2021-2032)
13.1.1. Middle East and Africa Hog Production and Pork Revenue (USD Million) by Type (2021-2032)
13.1.2. Middle East and Africa Hog Production and Pork Revenue (USD Million) by Application (2021-2032)
13.1.3. Middle East and Africa Hog Production and Pork Revenue (USD Million) by Product (2021-2032)
By Form
Raw
Frozen
Processed
By Application
Direct
Hypermarkets/Supermarkets
Convenience Stores
Specialty Stores
Online Retailing
Others
Chapter 14. Hog Production and Pork Company Profiles
14.1 Business Overview
14.2 Product Profiles
14.3 SWOT Profiles
14.5 Recent Developments
14.6 Financial Profile
List of Companies
BRF S.A
Charoen Pokphand Group
Danish Crown
Iowa Select Farms
JBS S.A.
Seaboard Corp
Shuanghui Development
Smithfield Foods
The Maschhoffs LLC
Tonnies
Triumph Foods LLC
Tyson Foods Inc
Vion Food Group Ltd
Wan Chau International Ltd
WH Group
Yurun Group
15. Methodology and Data Sources
15.1 Customization Offerings
15.2 Subscription Services
15.3 Related Reports
15.4 Publisher Expertise
LIST OF TABLES
Table 1 Market Segmentation Analysis
Table 2 Global Hog Production and Pork Market Share of Leading Companies, 2023
Table 3 Product Offerings of Leading Companies
Table 4 Low Growth Scenario Forecasts
Table 5 Reference Case Growth Scenario
Table 6 High Growth Case Scenario
Table 7 Global Hog Production and Pork Revenue (USD Million) And CAGR (%) By Type (2021-2032)
Table 8 Global Hog Production and Pork Revenue (USD Million) And CAGR (%) By Application (2021-2032)
Table 9 Global Hog Production and Pork Revenue (USD Million) And CAGR (%) By Product (2021-2032)
Table 10 Global Hog Production and Pork Market Revenue (USD Million) By Regions (2021-2032)
Table 11 Global Hog Production and Pork Market Share (%) By Regions (2021-2032)
Table 12 North America Hog Production and Pork Revenue (USD Million) By Country (2021-2032)
Table 13 Europe Hog Production and Pork Revenue (USD Million) By Country (2021-2032)
Table 14 Asia Pacific Hog Production and Pork Revenue (USD Million) By Country (2021-2032)
Table 15 South America Hog Production and Pork Revenue (USD Million) By Country (2021-2032)
Table 16 Middle East and Africa Hog Production and Pork Revenue (USD Million) By Region (2021-2032)
Table 17 North America Hog Production and Pork Revenue (USD Million) By Type (2021-2032)
Table 18 North America Hog Production and Pork Revenue (USD Million) By Application (2021-2032)
Table 19 North America Hog Production and Pork Revenue (USD Million) By Product (2021-2032)
Table 20 Europe Hog Production and Pork Revenue (USD Million) By Type (2021-2032)
Table 21 Europe Hog Production and Pork Revenue (USD Million) By Application (2021-2032)
Table 22 Europe Hog Production and Pork Revenue (USD Million) By Product (2021-2032)
Table 23 Asia Pacific Hog Production and Pork Revenue (USD Million) By Type (2021-2032)
Table 24 Asia Pacific Hog Production and Pork Revenue (USD Million) By Application (2021-2032)
Table 25 Asia Pacific Hog Production and Pork Revenue (USD Million) By Product (2021-2032)
Table 26 South America Hog Production and Pork Revenue (USD Million) By Type (2021-2032)
Table 27 South America Hog Production and Pork Revenue (USD Million) By Application (2021-2032)
Table 28 South America Hog Production and Pork Revenue (USD Million) By Product (2021-2032)
Table 29 Middle East and Africa Hog Production and Pork Revenue (USD Million) By Type (2021-2032)
Table 30 Middle East and Africa Hog Production and Pork Revenue (USD Million) By Application (2021-2032)
Table 31 Middle East and Africa Hog Production and Pork Revenue (USD Million) By Product (2021-2032)
LIST OF FIGURES
Figure 1. Market Scope
Figure 2. Pricing Forecasts Per Unit, 2023- 2032
Figure 3. Porter’s Five Forces
Figure 4. Global Hog Production and Pork Market Revenue (USD Million) By Regions (2021-2032)
Figure 5. Global Hog Production and Pork Market Share (%) By Regions (2023)
Figure 6. North America Hog Production and Pork Revenue (USD Million) By Country (2021-2032)
Figure 7. United States Hog Production and Pork Revenue (USD Million) By Country (2021-2032)
Figure 8. Canada Hog Production and Pork Revenue (USD Million) By Country (2021-2032)
Figure 9. Mexico Hog Production and Pork Revenue (USD Million) By Country (2021-2032)
Figure 10. Europe Hog Production and Pork Revenue (USD Million) By Country (2021-2032)
Figure 11. Germany Hog Production and Pork Revenue (USD Million) By Country (2021-2032)
Figure 12. France Hog Production and Pork Revenue (USD Million) By Country (2021-2032)
Figure 13. United Kingdom Hog Production and Pork Revenue (USD Million) By Country (2021-2032)
Figure 14. Spain Hog Production and Pork Revenue (USD Million) By Country (2021-2032)
Figure 15. Italy Hog Production and Pork Revenue (USD Million) By Country (2021-2032)
Figure 16. Russia Hog Production and Pork Revenue (USD Million) By Country (2021-2032)
Figure 17. Rest of Europe Hog Production and Pork Revenue (USD Million) By Country (2021-2032)
Figure 11. Asia Pacific Hog Production and Pork Revenue (USD Million) By Country (2021-2032)
Figure 12. China Hog Production and Pork Revenue (USD Million) By Country (2021-2032)
Figure 13. Japan Hog Production and Pork Revenue (USD Million) By Country (2021-2032)
Figure 14. India Hog Production and Pork Revenue (USD Million) By Country (2021-2032)
Figure 15. South Korea Hog Production and Pork Revenue (USD Million) By Country (2021-2032)
Figure 16. Australia Hog Production and Pork Revenue (USD Million) By Country (2021-2032)
Figure 17. South East Asia Hog Production and Pork Revenue (USD Million) By Country (2021-2032)
Figure 18. South America Hog Production and Pork Revenue (USD Million) By Country (2021-2032)
Figure 19. Brazil Hog Production and Pork Revenue (USD Million) By Country (2021-2032)
Figure 20. Argentina Hog Production and Pork Revenue (USD Million) By Country (2021-2032)
Figure 21. Rest of Asia Pacific Hog Production and Pork Revenue (USD Million) By Country (2021-2032)
Figure 22. Middle East and Africa Hog Production and Pork Revenue (USD Million) By Region (2021-2032)
Figure 23. Saudi Arabia Hog Production and Pork Revenue (USD Million) By Region (2021-2032)
Figure 24. The UAE Hog Production and Pork Revenue (USD Million) By Region (2021-2032)
Figure 25. Rest of Middle East Hog Production and Pork Revenue (USD Million) By Region (2021-2032)
Figure 26. South Africa Hog Production and Pork Revenue (USD Million) By Region (2021-2032)
Figure 27. Africa Hog Production and Pork Revenue (USD Million) By Region (2021-2032)
Figure 28. North America Hog Production and Pork Revenue (USD Million) By Type (2021-2032)
Figure 29. North America Hog Production and Pork Revenue (USD Million) By Application (2021-2032)
Figure 30. North America Hog Production and Pork Revenue (USD Million) By Product (2021-2032)
Figure 31. Europe Hog Production and Pork Revenue (USD Million) By Type (2021-2032)
Figure 32. Europe Hog Production and Pork Revenue (USD Million) By Application (2021-2032)
Figure 33. Europe Hog Production and Pork Revenue (USD Million) By Product (2021-2032)
Figure 34. Asia Pacific Hog Production and Pork Revenue (USD Million) By Type (2021-2032)
Figure 35. Asia Pacific Hog Production and Pork Revenue (USD Million) By Application (2021-2032)
Figure 36. Asia Pacific Hog Production and Pork Revenue (USD Million) By Product (2021-2032)
Figure 37. South America Hog Production and Pork Revenue (USD Million) By Type (2021-2032)
Figure 38. South America Hog Production and Pork Revenue (USD Million) By Application (2021-2032)
Figure 39. South America Hog Production and Pork Revenue (USD Million) By Product (2021-2032)
Figure 40. Middle East and Africa Hog Production and Pork Revenue (USD Million) By Type (2021-2032)
Figure 41. Middle East and Africa Hog Production and Pork Revenue (USD Million) By Application (2021-2032)
Figure 42. Middle East and Africa Hog Production and Pork Revenue (USD Million) By Product (2021-2032)
By Form
Raw
Frozen
Processed
By Application
Direct
Hypermarkets/Supermarkets
Convenience Stores
Specialty Stores
Online Retailing
Others
Countries Analyzed
North America (US, Canada, Mexico)
Europe (Germany, UK, France, Spain, Italy, Russia, Rest of Europe)
Asia Pacific (China, India, Japan, South Korea, Australia, South East Asia, Rest of Asia)
South America (Brazil, Argentina, Rest of South America)
Middle East and Africa (Saudi Arabia, UAE, Rest of Middle East, South Africa, Egypt, Rest of Africa)
