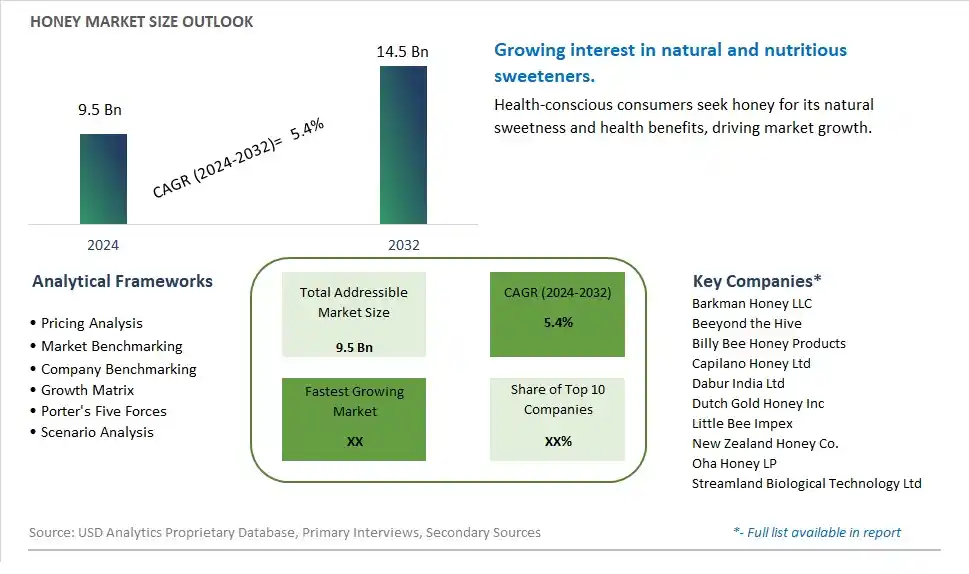
Global Honey Market Size is valued at $9.5 Billion in 2024 and is forecast to register a growth rate (CAGR) of 5.4% to reach $14.5 Billion by 2032.
The global Honey Market Comprehensive Study analyzes and forecasts the market size across 6 regions and 24 countries for diverse segments -By Processing (Organic, Conventional), By Distribution Channel (Hypermarkets/Supermarkets, Convenience Stores, Online Retailers, Others)
An Introduction to Honey Market
The honey market in 2024 reflects a dynamic landscape driven by a confluence of factors, including shifting consumer preferences, environmental concerns, and technological advancements. With increasing awareness about the health benefits of honey as a natural sweetener and its diverse culinary applications, demand continues to rise globally. Moreover, the growing popularity of organic and raw honey variants signifies a broader trend towards sustainable and wholesome food choices. In response to this demand, beekeeping practices are evolving, with an emphasis on ethical and eco-friendly honey production methods. Additionally, advancements in packaging and distribution ensure the availability of high-quality honey products to consumers worldwide, further fueling market growth.
Honey Competitive Landscape
The market report analyses the leading companies in the industry including Barkman Honey LLC, Beeyond the Hive, Billy Bee Honey Products, Capilano Honey Ltd, Dabur India Ltd, Dutch Gold Honey Inc, Little Bee Impex, New Zealand Honey Co., Oha Honey LP, Streamland Biological Technology Ltd, and Others.
Honey Market Dynamics
Honey Market Trend: Growing Demand for Natural and Healthy Sweeteners
One prominent trend in the honey market is the increasing demand for natural and healthy sweeteners. As consumers become more health-conscious and seek alternatives to refined sugars and artificial sweeteners, there is a rising interest in natural sweeteners like honey. Honey is perceived as a healthier option due to its natural origins, nutritional benefits, and unique flavor profiles. This trend is driven by a growing awareness of the potential health risks associated with excessive sugar consumption, leading consumers to opt for natural alternatives like honey in their diets. Moreover, the rising popularity of clean-label products and clean eating trends further fuels the demand for honey as a natural sweetening ingredient in various food and beverage applications.
Market Driver: Health and Wellness Awareness
A key driver for the honey market is the increasing awareness of health and wellness among consumers. Honey is recognized for its various health benefits, including its antioxidant properties, antibacterial qualities, and potential immune-boosting effects. As consumers seek ways to enhance their overall well-being and incorporate nutritious ingredients into their diets, honey emerges as a popular choice due to its natural composition and perceived health benefits. Additionally, the versatility of honey as a natural sweetener, functional ingredient, and remedy for various ailments drives its demand across diverse demographic groups and culinary preferences.
Market Opportunity: Diversification and Innovation in Product Offerings
An opportunity for the honey market lies in diversification and innovation in product offerings. While traditional honey varieties like clover and wildflower remain popular, there is potential for manufacturers and beekeepers to expand their product portfolios by introducing specialty and artisanal honey varieties. This includes monofloral honeys sourced from specific floral sources, such as lavender, eucalyptus, or acacia, which offer unique flavors and aromas. Moreover, there is an opportunity to develop value-added honey products, such as infused honeys, creamed honeys, and honey-based spreads, to cater to evolving consumer preferences and culinary trends. By leveraging innovative processing techniques, packaging designs, and marketing strategies, businesses can differentiate their honey products in the market and capitalize on the growing demand for premium and specialty honey offerings.
Honey Market Share Analysis: Conventional Processing Segment held the dominant market share in 2024
Within the Honey market, the Conventional Processing segment is the largest category, commanding a significant share due to its widespread availability, affordability, and familiarity among consumers. Conventional honey processing involves standard methods such as filtering, heating, and pasteurization to improve clarity, remove impurities, and extend shelf life. This processing method results in honey with consistent flavor, texture, and appearance, appealing to a broad spectrum of consumers. Further, conventional honey is readily accessible in supermarkets, grocery stores, and other retail outlets, making it the preferred choice for everyday consumption and culinary applications. While organic honey is gaining traction among health-conscious consumers seeking natural and sustainably sourced products, the Conventional Processing segment continues to dominate the Honey market due to its established presence and affordability, presenting significant opportunities for manufacturers to cater to the diverse needs and preferences of consumers worldwide.
Honey Market Share Analysis: Online Retailers Segment market is poised to register the fastest growth rae over the forecast period to 2032
Among the distribution channels in the Honey market, the Online Retailers segment is the fastest-growing category, driven by the increasing preference for e-commerce platforms and the convenience of online shopping. With the proliferation of online retailers and marketplaces, consumers have greater access to a wide variety of honey products from different brands and regions. The ease of browsing, comparing prices, and reading reviews online appeals to busy consumers seeking convenience and transparency in their purchasing decisions. Additionally, the COVID-19 pandemic has accelerated the shift towards online shopping, as consumers prioritize safety and avoid crowded stores. The Online Retailers segment offers a convenient way for consumers to purchase honey products from the comfort of their homes, contributing to its rapid growth in the market. As online shopping continues to gain momentum, the Online Retailers segment presents significant opportunities for honey producers and retailers to expand their digital presence and reach a broader audience base.
Honey Market Segmentation
By Processing
Organic
Conventional
By Distribution Channel
Hypermarkets/Supermarkets
Convenience Stores
Online Retailers
Others
Countries Analyzed
North America (US, Canada, Mexico)
Europe (Germany, UK, France, Spain, Italy, Russia, Rest of Europe)
Asia Pacific (China, India, Japan, South Korea, Australia, South East Asia, Rest of Asia)
South America (Brazil, Argentina, Rest of South America)
Middle East and Africa (Saudi Arabia, UAE, Rest of Middle East, South Africa, Egypt, Rest of Africa)
Honey Companies Profiled in the Study
Barkman Honey LLC
Beeyond the Hive
Billy Bee Honey Products
Capilano Honey Ltd
Dabur India Ltd
Dutch Gold Honey Inc
Little Bee Impex
New Zealand Honey Co.
Oha Honey LP
Streamland Biological Technology Ltd
*- List Not Exhaustive
Chapter 1. TABLE OF CONTENTS
Chapter 2. Introduction to Honey Market
2.1. Market Overview
2.2. Key Statistics and Report Highlights
2.3. Scope of the Comprehensive Study
2.3.1. Market Definition
2.3.2 Countries and Regions Covered
2.3.3 Research Objective
2.3.4 Units, Currency, and Conversions
2.3.5 Industry Value Chain
2.4. Key Market Segments
2.5. Key Companies
2.6. Study Period
Chapter 3. Strategic Analysis Review
3.1. Honey Pricing Analysis and Forecast
3.2. Porter’s Five Forces
3.3. Market Ecosystem
3.4. SWOT Analysis
3.5. Regulatory Scenario
3.3. Effects of Inflation, Russia-Ukraine War, moderating economic growth, and other macroeconomic factors
Chapter 4. Competitive Landscape
4.1. Market Share Analysis
4.1.1. Global Honey Market Share by Company, 2023
4.1.2. Product Offerings of Leading Honey Companies
4.2. Market Entropy
4.2.1. New Product Launches in the Industry
4.2.2. Mergers, Acquisitions, Joint ventures, and Partnerships
4.3. Key Strategies and Best Practices
Chapter 5. Global Market Projections: Best, Reference, and Low Case Scenarios
5.1. Growth Analysis- Case Scenario Definitions
5.2. Low Growth Case Scenario Forecasts
5.3. Reference Growth Case Scenario Forecasts
5.4. High Growth Case Scenario Forecasts
Chapter 6. Market Dynamics
6.1. Honey Market Drivers
6.2. Honey Market Challenges
6.6. Honey Market Opportunities
6.4. Honey Market Trends
Chapter 7. Global Honey Market Outlook Trends
7.1. Global Honey Revenue (USD Million) and CAGR (%) by Type (2021-2032)
7.2. Global Honey Revenue (USD Million) and CAGR (%) by Application (2021-2032)
7.3. Global Honey Revenue (USD Million) and CAGR (%) by Product (2021-2032)
By Processing
Organic
Conventional
By Distribution Channel
Hypermarkets/Supermarkets
Convenience Stores
Online Retailers
Others
Chapter 8. Global Honey Regional Analysis and Outlook
8.1. Global Honey Revenue (USD Million) By Regions (2021- 2032)
8.2. North America Honey Revenue (USD Million) by Country (2021-2032)
8.2.1. United States Honey Regional Analysis and Outlook
8.2.2. Canada Honey Regional Analysis and Outlook
8.2.3. Mexico Honey Regional Analysis and Outlook
8.3. Europe Honey Revenue (USD Million), by Country (2021-2032)
8.3.1. Germany Honey Regional Analysis and Outlook
8.3.2. France Honey Regional Analysis and Outlook
8.3.3. United Kingdom Honey Regional Analysis and Outlook
8.3.4. Spain Honey Regional Analysis and Outlook
8.3.5. Italy Honey Regional Analysis and Outlook
8.3.6. Russia Honey Regional Analysis and Outlook
8.3.7. Rest of Europe Honey Regional Analysis and Outlook
8.4. Asia Pacific Honey Revenue (USD Million) by Country (2021-2032)
8.4.1. China Honey Regional Analysis and Outlook
8.4.2. Japan Honey Regional Analysis and Outlook
8.4.3. India Honey Regional Analysis and Outlook
8.4.4. South Korea Honey Regional Analysis and Outlook
8.4.5. Australia Honey Regional Analysis and Outlook
8.4.6. South East Asia Honey Regional Analysis and Outlook
8.4.7. Rest of Asia Pacific Honey Regional Analysis and Outlook
8.5. South America Honey Revenue (USD Million), by Country (2021-2032)
8.5.1. Brazil Honey Regional Analysis and Outlook
8.5.2. Argentina Honey Regional Analysis and Outlook
8.5.3. Rest of South America Honey Regional Analysis and Outlook
8.6. Middle East and Africa Honey Revenue (USD Million) by Country (2021-2032)
8.6.1. Middle East Honey Regional Analysis and Outlook
8.6.2. Africa Honey Regional Analysis and Outlook
Chapter 9. North America Honey Analysis and Outlook
9.1. North America Honey Revenue (USD Million) by Segments (2021-2032)
9.1.1. North America Honey Revenue (USD Million) by Type (2021-2032)
9.1.2. North America Honey Revenue (USD Million) by Application (2021-2032)
9.1.3. North America Honey Revenue (USD Million) by Product (2021-2032)
By Processing
Organic
Conventional
By Distribution Channel
Hypermarkets/Supermarkets
Convenience Stores
Online Retailers
Others
Chapter 10. Europe Honey Analysis and Outlook
10.1. Europe Honey Revenue (USD Million), by Segments (USD Million) (2021-2032)
10.1.1. Europe Honey Revenue (USD Million) by Type (2021-2032)
10.1.2. Europe Honey Revenue (USD Million) by Application (2021-2032)
10.1.3. Europe Honey Revenue (USD Million) by Product (2021-2032)
By Processing
Organic
Conventional
By Distribution Channel
Hypermarkets/Supermarkets
Convenience Stores
Online Retailers
Others
Chapter 11. Asia Pacific Honey Analysis and Outlook
11.1. Asia Pacific Honey Revenue (USD Million), and Revenue (USD Million) by Segments (2021-2032)
11.1.1. Asia Pacific Honey Revenue (USD Million) by Type (2021-2032)
11.1.2. Asia Pacific Honey Revenue (USD Million) by Application (2021-2032)
11.1.3. Asia Pacific Honey Revenue (USD Million) by Product (2021-2032)
By Processing
Organic
Conventional
By Distribution Channel
Hypermarkets/Supermarkets
Convenience Stores
Online Retailers
Others
Chapter 12. South America Honey Analysis and Outlook
12.1. South America Honey Revenue (USD Million), by Segments (2021-2032)
12.1.1. South America Honey Revenue (USD Million) by Type (2021-2032)
12.1.2. South America Honey Revenue (USD Million) by Application (2021-2032)
12.1.3. South America Honey Revenue (USD Million) by Product (2021-2032)
By Processing
Organic
Conventional
By Distribution Channel
Hypermarkets/Supermarkets
Convenience Stores
Online Retailers
Others
Chapter 13. Middle East and Africa Honey Analysis and Outlook
13.1. Middle East and Africa Honey Revenue (USD Million), by Segments (2021-2032)
13.1.1. Middle East and Africa Honey Revenue (USD Million) by Type (2021-2032)
13.1.2. Middle East and Africa Honey Revenue (USD Million) by Application (2021-2032)
13.1.3. Middle East and Africa Honey Revenue (USD Million) by Product (2021-2032)
By Processing
Organic
Conventional
By Distribution Channel
Hypermarkets/Supermarkets
Convenience Stores
Online Retailers
Others
Chapter 14. Honey Company Profiles
14.1 Business Overview
14.2 Product Profiles
14.3 SWOT Profiles
14.5 Recent Developments
14.6 Financial Profile
List of Companies
Barkman Honey LLC
Beeyond the Hive
Billy Bee Honey Products
Capilano Honey Ltd
Dabur India Ltd
Dutch Gold Honey Inc
Little Bee Impex
New Zealand Honey Co.
Oha Honey LP
Streamland Biological Technology Ltd
15. Methodology and Data Sources
15.1 Customization Offerings
15.2 Subscription Services
15.3 Related Reports
15.4 Publisher Expertise
LIST OF TABLES
Table 1 Market Segmentation Analysis
Table 2 Global Honey Market Share of Leading Companies, 2023
Table 3 Product Offerings of Leading Companies
Table 4 Low Growth Scenario Forecasts
Table 5 Reference Case Growth Scenario
Table 6 High Growth Case Scenario
Table 7 Global Honey Revenue (USD Million) And CAGR (%) By Type (2021-2032)
Table 8 Global Honey Revenue (USD Million) And CAGR (%) By Application (2021-2032)
Table 9 Global Honey Revenue (USD Million) And CAGR (%) By Product (2021-2032)
Table 10 Global Honey Market Revenue (USD Million) By Regions (2021-2032)
Table 11 Global Honey Market Share (%) By Regions (2021-2032)
Table 12 North America Honey Revenue (USD Million) By Country (2021-2032)
Table 13 Europe Honey Revenue (USD Million) By Country (2021-2032)
Table 14 Asia Pacific Honey Revenue (USD Million) By Country (2021-2032)
Table 15 South America Honey Revenue (USD Million) By Country (2021-2032)
Table 16 Middle East and Africa Honey Revenue (USD Million) By Region (2021-2032)
Table 17 North America Honey Revenue (USD Million) By Type (2021-2032)
Table 18 North America Honey Revenue (USD Million) By Application (2021-2032)
Table 19 North America Honey Revenue (USD Million) By Product (2021-2032)
Table 20 Europe Honey Revenue (USD Million) By Type (2021-2032)
Table 21 Europe Honey Revenue (USD Million) By Application (2021-2032)
Table 22 Europe Honey Revenue (USD Million) By Product (2021-2032)
Table 23 Asia Pacific Honey Revenue (USD Million) By Type (2021-2032)
Table 24 Asia Pacific Honey Revenue (USD Million) By Application (2021-2032)
Table 25 Asia Pacific Honey Revenue (USD Million) By Product (2021-2032)
Table 26 South America Honey Revenue (USD Million) By Type (2021-2032)
Table 27 South America Honey Revenue (USD Million) By Application (2021-2032)
Table 28 South America Honey Revenue (USD Million) By Product (2021-2032)
Table 29 Middle East and Africa Honey Revenue (USD Million) By Type (2021-2032)
Table 30 Middle East and Africa Honey Revenue (USD Million) By Application (2021-2032)
Table 31 Middle East and Africa Honey Revenue (USD Million) By Product (2021-2032)
LIST OF FIGURES
Figure 1. Market Scope
Figure 2. Pricing Forecasts Per Unit, 2023- 2032
Figure 3. Porter’s Five Forces
Figure 4. Global Honey Market Revenue (USD Million) By Regions (2021-2032)
Figure 5. Global Honey Market Share (%) By Regions (2023)
Figure 6. North America Honey Revenue (USD Million) By Country (2021-2032)
Figure 7. United States Honey Revenue (USD Million) By Country (2021-2032)
Figure 8. Canada Honey Revenue (USD Million) By Country (2021-2032)
Figure 9. Mexico Honey Revenue (USD Million) By Country (2021-2032)
Figure 10. Europe Honey Revenue (USD Million) By Country (2021-2032)
Figure 11. Germany Honey Revenue (USD Million) By Country (2021-2032)
Figure 12. France Honey Revenue (USD Million) By Country (2021-2032)
Figure 13. United Kingdom Honey Revenue (USD Million) By Country (2021-2032)
Figure 14. Spain Honey Revenue (USD Million) By Country (2021-2032)
Figure 15. Italy Honey Revenue (USD Million) By Country (2021-2032)
Figure 16. Russia Honey Revenue (USD Million) By Country (2021-2032)
Figure 17. Rest of Europe Honey Revenue (USD Million) By Country (2021-2032)
Figure 11. Asia Pacific Honey Revenue (USD Million) By Country (2021-2032)
Figure 12. China Honey Revenue (USD Million) By Country (2021-2032)
Figure 13. Japan Honey Revenue (USD Million) By Country (2021-2032)
Figure 14. India Honey Revenue (USD Million) By Country (2021-2032)
Figure 15. South Korea Honey Revenue (USD Million) By Country (2021-2032)
Figure 16. Australia Honey Revenue (USD Million) By Country (2021-2032)
Figure 17. South East Asia Honey Revenue (USD Million) By Country (2021-2032)
Figure 18. South America Honey Revenue (USD Million) By Country (2021-2032)
Figure 19. Brazil Honey Revenue (USD Million) By Country (2021-2032)
Figure 20. Argentina Honey Revenue (USD Million) By Country (2021-2032)
Figure 21. Rest of Asia Pacific Honey Revenue (USD Million) By Country (2021-2032)
Figure 22. Middle East and Africa Honey Revenue (USD Million) By Region (2021-2032)
Figure 23. Saudi Arabia Honey Revenue (USD Million) By Region (2021-2032)
Figure 24. The UAE Honey Revenue (USD Million) By Region (2021-2032)
Figure 25. Rest of Middle East Honey Revenue (USD Million) By Region (2021-2032)
Figure 26. South Africa Honey Revenue (USD Million) By Region (2021-2032)
Figure 27. Africa Honey Revenue (USD Million) By Region (2021-2032)
Figure 28. North America Honey Revenue (USD Million) By Type (2021-2032)
Figure 29. North America Honey Revenue (USD Million) By Application (2021-2032)
Figure 30. North America Honey Revenue (USD Million) By Product (2021-2032)
Figure 31. Europe Honey Revenue (USD Million) By Type (2021-2032)
Figure 32. Europe Honey Revenue (USD Million) By Application (2021-2032)
Figure 33. Europe Honey Revenue (USD Million) By Product (2021-2032)
Figure 34. Asia Pacific Honey Revenue (USD Million) By Type (2021-2032)
Figure 35. Asia Pacific Honey Revenue (USD Million) By Application (2021-2032)
Figure 36. Asia Pacific Honey Revenue (USD Million) By Product (2021-2032)
Figure 37. South America Honey Revenue (USD Million) By Type (2021-2032)
Figure 38. South America Honey Revenue (USD Million) By Application (2021-2032)
Figure 39. South America Honey Revenue (USD Million) By Product (2021-2032)
Figure 40. Middle East and Africa Honey Revenue (USD Million) By Type (2021-2032)
Figure 41. Middle East and Africa Honey Revenue (USD Million) By Application (2021-2032)
Figure 42. Middle East and Africa Honey Revenue (USD Million) By Product (2021-2032)
By Processing
Organic
Conventional
By Distribution Channel
Hypermarkets/Supermarkets
Convenience Stores
Online Retailers
Others
Countries Analyzed
North America (US, Canada, Mexico)
Europe (Germany, UK, France, Spain, Italy, Russia, Rest of Europe)
Asia Pacific (China, India, Japan, South Korea, Australia, South East Asia, Rest of Asia)
South America (Brazil, Argentina, Rest of South America)
Middle East and Africa (Saudi Arabia, UAE, Rest of Middle East, South Africa, Egypt, Rest of Africa)
