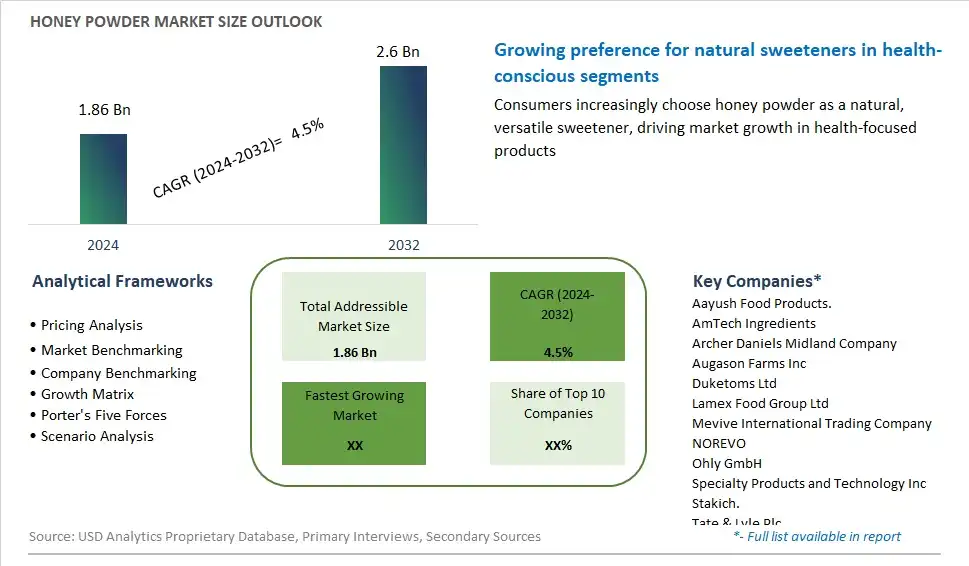
Global Honey Powder Market Size is valued at $1.86 Billion in 2024 and is forecast to register a growth rate (CAGR) of 4.5% to reach $2.6 Billion by 2032.
The global Honey Powder Market Comprehensive Study analyzes and forecasts the market size across 6 regions and 24 countries for diverse segments -By Application (Bakery Products, Dairy Products, Beauty Products, Others), By Type (Granulated Honey, Powdered Honey), By Distribution Channel (Offline Stores, Online Stores)
An Introduction to Honey Powder Market
In 2024, the honey powders market is expanding, driven by the demand for natural sweeteners and versatile ingredients. Honey powder, made by dehydrating natural honey, offers the convenience and extended shelf life of a dry product while retaining the flavor and nutritional benefits of honey. The market is characterized by innovations in drying and processing techniques, which enhance the quality and purity of honey powder. The trend towards clean label and minimally processed foods is influencing the market, as consumers seek natural alternatives to refined sugars. Honey powder is gaining popularity in a wide range of applications, including baking, beverages, and culinary uses, where it provides a natural sweetener with the added benefits of antioxidants and antimicrobial properties. Additionally, the rise of health-conscious consumers and the demand for functional ingredients are driving interest in honey powder. The market is poised for continued growth, supported by consumer preferences for natural and versatile sweeteners.
Honey Powder Competitive Landscape
The market report analyses the leading companies in the industry including Aayush Food Products., AmTech Ingredients, Archer Daniels Midland Company, Augason Farms Inc, Duketoms Ltd, Lamex Food Group Ltd, Mevive International Trading Company, NOREVO, Ohly GmbH, Specialty Products and Technology Inc, Stakich., Tate & Lyle Plc, Woodland Foods, and Others.
Honey Powder Market Dynamics
Honey Powders Market Trend: Demand for Convenient and Shelf-Stable Sweeteners
A significant trend in the market for honey powders is the growing demand for convenient and shelf-stable sweeteners. As consumers become more health-conscious and seek alternatives to refined sugars and artificial sweeteners, there is a rising interest in natural sweetening options like honey. Honey powders offer the same sweet taste and nutritional benefits of traditional honey but in a convenient powdered form. This trend is driven by the desire for healthier ingredients and the need for convenient solutions in food and beverage manufacturing.
Market Driver: Increased Use in Food and Beverage Applications
A key driver of the honey powders market is the increased use of honey powders in food and beverage applications. Honey powders are versatile ingredients that can be used in a wide range of products, including baked goods, beverages, sauces, dressings, and snacks. Their powdered form makes them easier to incorporate into recipes and allows for better control of sweetness levels. As food manufacturers seek natural and clean label ingredients to meet consumer demand for healthier options, honey powders present an attractive solution due to their natural origin and versatility.
Market Opportunity: Expansion into Health and Wellness Segments
An opportunity in the honey powders market lies in the expansion into health and wellness segments. With the growing focus on health and wellness, there is a demand for functional food and beverage products that offer additional benefits beyond basic nutrition. Honey powders, with their natural sweetness and potential health-promoting properties, can be positioned as functional ingredients in products targeting specific health concerns such as immune support, digestive health, and energy enhancement. By leveraging the inherent nutritional qualities of honey and promoting its health benefits, manufacturers can capitalize on the opportunity to cater to the needs of health-conscious consumers and differentiate their products in the market.
Honey Powders Market Share Analysis: Bakery Products Application Segment held the dominant market share in 2024
Within the Honey Powders market, the Bakery Products application segment is the largest category, commanding a significant share due to the widespread use of honey powders as a natural sweetener and flavor enhancer in bakery goods. Honey powders offer a convenient and versatile alternative to liquid honey, providing bakers with greater control over sweetness levels and improved shelf stability in baked goods. Their powdered form makes them easy to incorporate into dry ingredients, doughs, and batters, resulting in consistent flavor profiles and desirable textures in baked products such as bread, cakes, cookies, and pastries. Further, the natural and wholesome image of honey powders aligns with the growing consumer preference for clean-label ingredients and healthier bakery options. With the rising demand for premium baked goods and the increasing popularity of natural sweeteners, the Bakery Products application segment continues to lead the Honey Powders market, presenting significant opportunities for manufacturers to innovate and expand their product offerings to meet the evolving needs of bakery professionals and consumers alike.
Honey Powders Market Share Analysis: Powdered Honey Segment market is poised to register the fastest growth rae over the forecast period to 2032
Among the segments in the Honey Powders market, the Powdered Honey segment is the fastest-growing category, driven by its versatility, convenience, and growing applications across various industries. Powdered honey offers the same natural sweetness and flavor as traditional liquid honey but in a powdered form, making it easier to handle, transport, and incorporate into a wide range of products. Its fine texture allows for better dispersion and uniform mixing in dry ingredients, beverages, and food formulations, including bakery products, dairy products, beverages, and beauty products. Further, powdered honey has a longer shelf life and better stability compared to liquid honey, making it an attractive option for manufacturers seeking extended product shelf life and improved flavor retention. With the rising demand for natural sweeteners and the increasing adoption of honey powders in food and beverage formulations, the Powdered Honey segment experiences exponential growth in the market, presenting significant opportunities for manufacturers to capitalize on the growing trend and expand their product offerings to cater to diverse consumer preferences and industry needs.
Honey Powders Market Share Analysis: Offline Stores Segment held the dominant market share in 2024
Within the Honey Powders market, the Offline Stores segment is the largest category, commanding a significant share due to its established presence in traditional retail channels such as supermarkets, specialty stores, and health food stores. Offline stores offer consumers the convenience of immediate product availability, allowing them to browse, compare, and purchase honey powders in person. Additionally, offline retailers often provide personalized assistance and product recommendations, enhancing the overall shopping experience. While online shopping continues to grow, offline stores remain popular among consumers seeking a tactile shopping experience and prefer to inspect products before making a purchase. Further, offline stores serve as key distribution points for honey powder manufacturers, enabling them to reach a wider audience and establish brand visibility. With their extensive reach and consumer trust, the Offline Stores segment continues to lead the Honey Powders market, presenting significant opportunities for manufacturers to collaborate with retailers and strengthen their market presence.
Honey Powder Market Segmentation
By Application
Bakery Products
Dairy Products
Beauty Products
Others
By Type
Granulated Honey
Powdered Honey
By Distribution Channel
Offline Stores
Online Stores
Countries Analyzed
North America (US, Canada, Mexico)
Europe (Germany, UK, France, Spain, Italy, Russia, Rest of Europe)
Asia Pacific (China, India, Japan, South Korea, Australia, South East Asia, Rest of Asia)
South America (Brazil, Argentina, Rest of South America)
Middle East and Africa (Saudi Arabia, UAE, Rest of Middle East, South Africa, Egypt, Rest of Africa)
Honey Powder Companies Profiled in the Study
Aayush Food Products.
AmTech Ingredients
Archer Daniels Midland Company
Augason Farms Inc
Duketoms Ltd
Lamex Food Group Ltd
Mevive International Trading Company
NOREVO
Ohly GmbH
Specialty Products and Technology Inc
Stakich.
Tate & Lyle Plc
Woodland Foods
*- List Not Exhaustive
Chapter 1. TABLE OF CONTENTS
Chapter 2. Introduction to Honey Powder Market
2.1. Market Overview
2.2. Key Statistics and Report Highlights
2.3. Scope of the Comprehensive Study
2.3.1. Market Definition
2.3.2 Countries and Regions Covered
2.3.3 Research Objective
2.3.4 Units, Currency, and Conversions
2.3.5 Industry Value Chain
2.4. Key Market Segments
2.5. Key Companies
2.6. Study Period
Chapter 3. Strategic Analysis Review
3.1. Honey Powder Pricing Analysis and Forecast
3.2. Porter’s Five Forces
3.3. Market Ecosystem
3.4. SWOT Analysis
3.5. Regulatory Scenario
3.3. Effects of Inflation, Russia-Ukraine War, moderating economic growth, and other macroeconomic factors
Chapter 4. Competitive Landscape
4.1. Market Share Analysis
4.1.1. Global Honey Powder Market Share by Company, 2023
4.1.2. Product Offerings of Leading Honey Powder Companies
4.2. Market Entropy
4.2.1. New Product Launches in the Industry
4.2.2. Mergers, Acquisitions, Joint ventures, and Partnerships
4.3. Key Strategies and Best Practices
Chapter 5. Global Market Projections: Best, Reference, and Low Case Scenarios
5.1. Growth Analysis- Case Scenario Definitions
5.2. Low Growth Case Scenario Forecasts
5.3. Reference Growth Case Scenario Forecasts
5.4. High Growth Case Scenario Forecasts
Chapter 6. Market Dynamics
6.1. Honey Powder Market Drivers
6.2. Honey Powder Market Challenges
6.6. Honey Powder Market Opportunities
6.4. Honey Powder Market Trends
Chapter 7. Global Honey Powder Market Outlook Trends
7.1. Global Honey Powder Revenue (USD Million) and CAGR (%) by Type (2021-2032)
7.2. Global Honey Powder Revenue (USD Million) and CAGR (%) by Application (2021-2032)
7.3. Global Honey Powder Revenue (USD Million) and CAGR (%) by Product (2021-2032)
By Application
Bakery Products
Dairy Products
Beauty Products
Others
By Type
Granulated Honey
Powdered Honey
By Distribution Channel
Offline Stores
Online Stores
Chapter 8. Global Honey Powder Regional Analysis and Outlook
8.1. Global Honey Powder Revenue (USD Million) By Regions (2021- 2032)
8.2. North America Honey Powder Revenue (USD Million) by Country (2021-2032)
8.2.1. United States Honey Powder Regional Analysis and Outlook
8.2.2. Canada Honey Powder Regional Analysis and Outlook
8.2.3. Mexico Honey Powder Regional Analysis and Outlook
8.3. Europe Honey Powder Revenue (USD Million), by Country (2021-2032)
8.3.1. Germany Honey Powder Regional Analysis and Outlook
8.3.2. France Honey Powder Regional Analysis and Outlook
8.3.3. United Kingdom Honey Powder Regional Analysis and Outlook
8.3.4. Spain Honey Powder Regional Analysis and Outlook
8.3.5. Italy Honey Powder Regional Analysis and Outlook
8.3.6. Russia Honey Powder Regional Analysis and Outlook
8.3.7. Rest of Europe Honey Powder Regional Analysis and Outlook
8.4. Asia Pacific Honey Powder Revenue (USD Million) by Country (2021-2032)
8.4.1. China Honey Powder Regional Analysis and Outlook
8.4.2. Japan Honey Powder Regional Analysis and Outlook
8.4.3. India Honey Powder Regional Analysis and Outlook
8.4.4. South Korea Honey Powder Regional Analysis and Outlook
8.4.5. Australia Honey Powder Regional Analysis and Outlook
8.4.6. South East Asia Honey Powder Regional Analysis and Outlook
8.4.7. Rest of Asia Pacific Honey Powder Regional Analysis and Outlook
8.5. South America Honey Powder Revenue (USD Million), by Country (2021-2032)
8.5.1. Brazil Honey Powder Regional Analysis and Outlook
8.5.2. Argentina Honey Powder Regional Analysis and Outlook
8.5.3. Rest of South America Honey Powder Regional Analysis and Outlook
8.6. Middle East and Africa Honey Powder Revenue (USD Million) by Country (2021-2032)
8.6.1. Middle East Honey Powder Regional Analysis and Outlook
8.6.2. Africa Honey Powder Regional Analysis and Outlook
Chapter 9. North America Honey Powder Analysis and Outlook
9.1. North America Honey Powder Revenue (USD Million) by Segments (2021-2032)
9.1.1. North America Honey Powder Revenue (USD Million) by Type (2021-2032)
9.1.2. North America Honey Powder Revenue (USD Million) by Application (2021-2032)
9.1.3. North America Honey Powder Revenue (USD Million) by Product (2021-2032)
By Application
Bakery Products
Dairy Products
Beauty Products
Others
By Type
Granulated Honey
Powdered Honey
By Distribution Channel
Offline Stores
Online Stores
Chapter 10. Europe Honey Powder Analysis and Outlook
10.1. Europe Honey Powder Revenue (USD Million), by Segments (USD Million) (2021-2032)
10.1.1. Europe Honey Powder Revenue (USD Million) by Type (2021-2032)
10.1.2. Europe Honey Powder Revenue (USD Million) by Application (2021-2032)
10.1.3. Europe Honey Powder Revenue (USD Million) by Product (2021-2032)
By Application
Bakery Products
Dairy Products
Beauty Products
Others
By Type
Granulated Honey
Powdered Honey
By Distribution Channel
Offline Stores
Online Stores
Chapter 11. Asia Pacific Honey Powder Analysis and Outlook
11.1. Asia Pacific Honey Powder Revenue (USD Million), and Revenue (USD Million) by Segments (2021-2032)
11.1.1. Asia Pacific Honey Powder Revenue (USD Million) by Type (2021-2032)
11.1.2. Asia Pacific Honey Powder Revenue (USD Million) by Application (2021-2032)
11.1.3. Asia Pacific Honey Powder Revenue (USD Million) by Product (2021-2032)
By Application
Bakery Products
Dairy Products
Beauty Products
Others
By Type
Granulated Honey
Powdered Honey
By Distribution Channel
Offline Stores
Online Stores
Chapter 12. South America Honey Powder Analysis and Outlook
12.1. South America Honey Powder Revenue (USD Million), by Segments (2021-2032)
12.1.1. South America Honey Powder Revenue (USD Million) by Type (2021-2032)
12.1.2. South America Honey Powder Revenue (USD Million) by Application (2021-2032)
12.1.3. South America Honey Powder Revenue (USD Million) by Product (2021-2032)
By Application
Bakery Products
Dairy Products
Beauty Products
Others
By Type
Granulated Honey
Powdered Honey
By Distribution Channel
Offline Stores
Online Stores
Chapter 13. Middle East and Africa Honey Powder Analysis and Outlook
13.1. Middle East and Africa Honey Powder Revenue (USD Million), by Segments (2021-2032)
13.1.1. Middle East and Africa Honey Powder Revenue (USD Million) by Type (2021-2032)
13.1.2. Middle East and Africa Honey Powder Revenue (USD Million) by Application (2021-2032)
13.1.3. Middle East and Africa Honey Powder Revenue (USD Million) by Product (2021-2032)
By Application
Bakery Products
Dairy Products
Beauty Products
Others
By Type
Granulated Honey
Powdered Honey
By Distribution Channel
Offline Stores
Online Stores
Chapter 14. Honey Powder Company Profiles
14.1 Business Overview
14.2 Product Profiles
14.3 SWOT Profiles
14.5 Recent Developments
14.6 Financial Profile
List of Companies
Aayush Food Products.
AmTech Ingredients
Archer Daniels Midland Company
Augason Farms Inc
Duketoms Ltd
Lamex Food Group Ltd
Mevive International Trading Company
NOREVO
Ohly GmbH
Specialty Products and Technology Inc
Stakich.
Tate & Lyle Plc
Woodland Foods
15. Methodology and Data Sources
15.1 Customization Offerings
15.2 Subscription Services
15.3 Related Reports
15.4 Publisher Expertise
LIST OF TABLES
Table 1 Market Segmentation Analysis
Table 2 Global Honey Powder Market Share of Leading Companies, 2023
Table 3 Product Offerings of Leading Companies
Table 4 Low Growth Scenario Forecasts
Table 5 Reference Case Growth Scenario
Table 6 High Growth Case Scenario
Table 7 Global Honey Powder Revenue (USD Million) And CAGR (%) By Type (2021-2032)
Table 8 Global Honey Powder Revenue (USD Million) And CAGR (%) By Application (2021-2032)
Table 9 Global Honey Powder Revenue (USD Million) And CAGR (%) By Product (2021-2032)
Table 10 Global Honey Powder Market Revenue (USD Million) By Regions (2021-2032)
Table 11 Global Honey Powder Market Share (%) By Regions (2021-2032)
Table 12 North America Honey Powder Revenue (USD Million) By Country (2021-2032)
Table 13 Europe Honey Powder Revenue (USD Million) By Country (2021-2032)
Table 14 Asia Pacific Honey Powder Revenue (USD Million) By Country (2021-2032)
Table 15 South America Honey Powder Revenue (USD Million) By Country (2021-2032)
Table 16 Middle East and Africa Honey Powder Revenue (USD Million) By Region (2021-2032)
Table 17 North America Honey Powder Revenue (USD Million) By Type (2021-2032)
Table 18 North America Honey Powder Revenue (USD Million) By Application (2021-2032)
Table 19 North America Honey Powder Revenue (USD Million) By Product (2021-2032)
Table 20 Europe Honey Powder Revenue (USD Million) By Type (2021-2032)
Table 21 Europe Honey Powder Revenue (USD Million) By Application (2021-2032)
Table 22 Europe Honey Powder Revenue (USD Million) By Product (2021-2032)
Table 23 Asia Pacific Honey Powder Revenue (USD Million) By Type (2021-2032)
Table 24 Asia Pacific Honey Powder Revenue (USD Million) By Application (2021-2032)
Table 25 Asia Pacific Honey Powder Revenue (USD Million) By Product (2021-2032)
Table 26 South America Honey Powder Revenue (USD Million) By Type (2021-2032)
Table 27 South America Honey Powder Revenue (USD Million) By Application (2021-2032)
Table 28 South America Honey Powder Revenue (USD Million) By Product (2021-2032)
Table 29 Middle East and Africa Honey Powder Revenue (USD Million) By Type (2021-2032)
Table 30 Middle East and Africa Honey Powder Revenue (USD Million) By Application (2021-2032)
Table 31 Middle East and Africa Honey Powder Revenue (USD Million) By Product (2021-2032)
LIST OF FIGURES
Figure 1. Market Scope
Figure 2. Pricing Forecasts Per Unit, 2023- 2032
Figure 3. Porter’s Five Forces
Figure 4. Global Honey Powder Market Revenue (USD Million) By Regions (2021-2032)
Figure 5. Global Honey Powder Market Share (%) By Regions (2023)
Figure 6. North America Honey Powder Revenue (USD Million) By Country (2021-2032)
Figure 7. United States Honey Powder Revenue (USD Million) By Country (2021-2032)
Figure 8. Canada Honey Powder Revenue (USD Million) By Country (2021-2032)
Figure 9. Mexico Honey Powder Revenue (USD Million) By Country (2021-2032)
Figure 10. Europe Honey Powder Revenue (USD Million) By Country (2021-2032)
Figure 11. Germany Honey Powder Revenue (USD Million) By Country (2021-2032)
Figure 12. France Honey Powder Revenue (USD Million) By Country (2021-2032)
Figure 13. United Kingdom Honey Powder Revenue (USD Million) By Country (2021-2032)
Figure 14. Spain Honey Powder Revenue (USD Million) By Country (2021-2032)
Figure 15. Italy Honey Powder Revenue (USD Million) By Country (2021-2032)
Figure 16. Russia Honey Powder Revenue (USD Million) By Country (2021-2032)
Figure 17. Rest of Europe Honey Powder Revenue (USD Million) By Country (2021-2032)
Figure 11. Asia Pacific Honey Powder Revenue (USD Million) By Country (2021-2032)
Figure 12. China Honey Powder Revenue (USD Million) By Country (2021-2032)
Figure 13. Japan Honey Powder Revenue (USD Million) By Country (2021-2032)
Figure 14. India Honey Powder Revenue (USD Million) By Country (2021-2032)
Figure 15. South Korea Honey Powder Revenue (USD Million) By Country (2021-2032)
Figure 16. Australia Honey Powder Revenue (USD Million) By Country (2021-2032)
Figure 17. South East Asia Honey Powder Revenue (USD Million) By Country (2021-2032)
Figure 18. South America Honey Powder Revenue (USD Million) By Country (2021-2032)
Figure 19. Brazil Honey Powder Revenue (USD Million) By Country (2021-2032)
Figure 20. Argentina Honey Powder Revenue (USD Million) By Country (2021-2032)
Figure 21. Rest of Asia Pacific Honey Powder Revenue (USD Million) By Country (2021-2032)
Figure 22. Middle East and Africa Honey Powder Revenue (USD Million) By Region (2021-2032)
Figure 23. Saudi Arabia Honey Powder Revenue (USD Million) By Region (2021-2032)
Figure 24. The UAE Honey Powder Revenue (USD Million) By Region (2021-2032)
Figure 25. Rest of Middle East Honey Powder Revenue (USD Million) By Region (2021-2032)
Figure 26. South Africa Honey Powder Revenue (USD Million) By Region (2021-2032)
Figure 27. Africa Honey Powder Revenue (USD Million) By Region (2021-2032)
Figure 28. North America Honey Powder Revenue (USD Million) By Type (2021-2032)
Figure 29. North America Honey Powder Revenue (USD Million) By Application (2021-2032)
Figure 30. North America Honey Powder Revenue (USD Million) By Product (2021-2032)
Figure 31. Europe Honey Powder Revenue (USD Million) By Type (2021-2032)
Figure 32. Europe Honey Powder Revenue (USD Million) By Application (2021-2032)
Figure 33. Europe Honey Powder Revenue (USD Million) By Product (2021-2032)
Figure 34. Asia Pacific Honey Powder Revenue (USD Million) By Type (2021-2032)
Figure 35. Asia Pacific Honey Powder Revenue (USD Million) By Application (2021-2032)
Figure 36. Asia Pacific Honey Powder Revenue (USD Million) By Product (2021-2032)
Figure 37. South America Honey Powder Revenue (USD Million) By Type (2021-2032)
Figure 38. South America Honey Powder Revenue (USD Million) By Application (2021-2032)
Figure 39. South America Honey Powder Revenue (USD Million) By Product (2021-2032)
Figure 40. Middle East and Africa Honey Powder Revenue (USD Million) By Type (2021-2032)
Figure 41. Middle East and Africa Honey Powder Revenue (USD Million) By Application (2021-2032)
Figure 42. Middle East and Africa Honey Powder Revenue (USD Million) By Product (2021-2032)
By Application
Bakery Products
Dairy Products
Beauty Products
Others
By Type
Granulated Honey
Powdered Honey
By Distribution Channel
Offline Stores
Online Stores
Countries Analyzed
North America (US, Canada, Mexico)
Europe (Germany, UK, France, Spain, Italy, Russia, Rest of Europe)
Asia Pacific (China, India, Japan, South Korea, Australia, South East Asia, Rest of Asia)
South America (Brazil, Argentina, Rest of South America)
Middle East and Africa (Saudi Arabia, UAE, Rest of Middle East, South Africa, Egypt, Rest of Africa)
