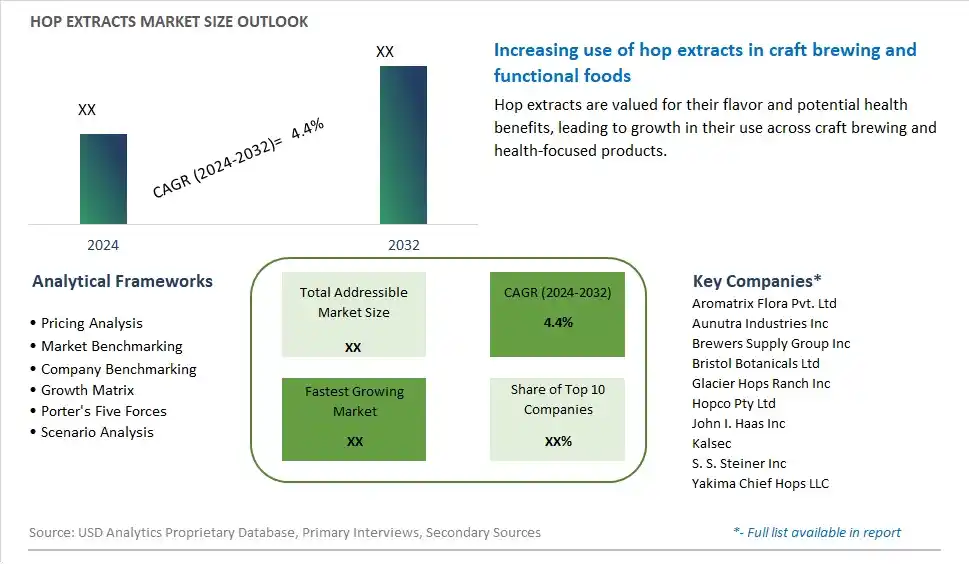
Global Hop Extracts Market Size is valued at $1.8 Billion in 2024 and is forecast to register a growth rate (CAGR) of 4.6% to reach $2.6 Billion by 2032.
The global Hop Extracts Market Comprehensive Study analyzes and forecasts the market size across 6 regions and 24 countries for diverse segments -By Type (Organic, Conventional), By Application (Bittering Agents, Aroma Agents, Dual Purposes)
An Introduction to Hop Extracts Market
The hops extract market in 2024 is expanding rapidly, fueled by its diverse applications in the brewing, pharmaceutical, and cosmetic industries. Hops extracts, known for their bittering, flavoring, and preservative properties, are essential in craft beer production, offering consistency and enhanced flavor profiles. In the pharmaceutical sector, hops extracts are gaining traction for their potential health benefits, including anti-inflammatory and antioxidant properties. Additionally, the cosmetic industry is leveraging hops extracts for their skin-soothing and anti-aging properties, further driving market growth.
Hops Extract Competitive Landscape
The market report analyses the leading companies in the industry including Aromatrix Flora, Aunutra Industries, Bristol Botanicals, BSG Hops, Crosby Hop Farm, Glacier Hops Ranch, Hopco Pty, Indena, John I. Haas, Kalsec, New Zealand Hops, S. S. Steiner, Willamette Valley Hops, Yakima Chief Hops, and Others.
Hops Extract Market Dynamics
Hops Extract Market Trend: Increasing Use in Health and Wellness Products
The most prominent trend in the Hops Extract Market is the increasing use of hops extracts in health and wellness products. Hops extracts, known for their antioxidant and anti-inflammatory properties, are being incorporated into dietary supplements, herbal teas, and functional foods aimed at promoting relaxation, improving sleep quality, and reducing stress. This trend is driven by the growing consumer interest in natural and plant-based ingredients for health benefits. As awareness about the therapeutic properties of hops extracts spreads, their application in the wellness sector continues to expand.
Hops Extract Market Driver: Rising Demand for Craft Beer
A key driver for the Hops Extract Market is the rising demand for craft beer. The craft beer industry relies heavily on hops extracts to create unique flavors and aromas that differentiate their products from mainstream beers. As the craft beer movement grows, with more breweries experimenting with diverse hop varieties, the demand for high-quality hops extracts is increasing. This trend is not only prevalent in North America and Europe but also gaining traction in other regions, contributing significantly to market growth.
Hops Extract Market Opportunity: Expansion in Non-Alcoholic Beverages
One potential opportunity in the Hops Extract Market lies in the expansion into non-alcoholic beverages. With the growing trend towards healthy living and the rise of the sober curious movement, there is an increasing demand for non-alcoholic drinks that offer complex flavors and health benefits. Hops extracts can be used to create non-alcoholic beers, sparkling waters, and wellness drinks, providing a sophisticated taste profile while leveraging their natural health properties. This opportunity can help manufacturers diversify their product lines and reach a broader consumer base.
Hop Extracts Market Share Analysis- Largest Segment by Type
The Conventional segment is the largest in the Hop Extracts Market by type. This dominance is driven by the widespread use of conventional hop extracts in the brewing industry to impart bitterness, flavor, and aroma to beer. Conventional hop extracts are favored for their consistency, cost-effectiveness, and availability, making them a popular choice among large-scale brewers and craft breweries alike. The continuous innovation in hop extract formulations, including the development of new hop varieties and extraction methods, enhances their appeal. Additionally, the growing trend of craft brewing and the increasing demand for hoppy and flavorful beers support the significant market share of the conventional segment. The extensive availability of conventional hop extracts in brewing supply stores and online platforms further boosts their accessibility to a broad consumer base. The strong consumer preference for high-quality and consistent hop extracts reinforces the dominant position of the conventional segment in the market.
Hop Extracts Market Share Analysis- Fastest Growing Segment by Application
The Aroma Agents segment is poised to grow the fastest in the Hop Extracts Market by application over the next five years. This rapid growth is driven by the increasing demand for aromatic hops in the brewing industry to create distinctive and flavorful beers. Aroma hop extracts are used to impart unique and complex aromas to beer, enhancing its sensory appeal and overall drinking experience. The continuous innovation in hop breeding and extraction techniques, which produce hop extracts with enhanced aromatic profiles, supports the fast growth of this segment. Additionally, the growing trend of craft brewing and the increasing popularity of hop-forward beer styles, such as IPAs, drive the demand for aroma hop extracts. The influence of beer enthusiasts and the rising interest in sensory-driven brewing practices further contribute to the rapid growth of the aroma agents segment.
Hops Extract Market Segmentation
By Type
Organic
Conventional
By Application
Bittering Agents
Aroma Agents
Dual Purposes
Countries Analyzed
North America (US, Canada, Mexico)
Europe (Germany, UK, France, Spain, Italy, Russia, Rest of Europe)
Asia Pacific (China, India, Japan, South Korea, Australia, South East Asia, Rest of Asia)
South America (Brazil, Argentina, Rest of South America)
Middle East and Africa (Saudi Arabia, UAE, Rest of Middle East, South Africa, Egypt, Rest of Africa)
Hops Extract Companies Profiled in the Study
Aromatrix Flora
Aunutra Industries
Bristol Botanicals
BSG Hops
Crosby Hop Farm
Glacier Hops Ranch
Hopco Pty
Indena
John I. Haas
Kalsec
New Zealand Hops
S. S. Steiner
Willamette Valley Hops
Yakima Chief Hops
*- List Not Exhaustive
Chapter 1. TABLE OF CONTENTS
Chapter 2. Introduction to Hops Extract Market
2.1. Market Overview
2.2. Key Statistics and Report Highlights
2.3. Scope of the Comprehensive Study
2.3.1. Market Definition
2.3.2 Countries and Regions Covered
2.3.3 Research Objective
2.3.4 Units, Currency, and Conversions
2.3.5 Industry Value Chain
2.4. Key Market Segments
2.5. Key Companies
2.6. Study Period
Chapter 3. Strategic Analysis Review
3.1. Hops Extract Pricing Analysis and Forecast
3.2. Porter’s Five Forces
3.3. Market Ecosystem
3.4. SWOT Analysis
3.5. Regulatory Scenario
3.3. Effects of Inflation, Russia-Ukraine War, moderating economic growth, and other macroeconomic factors
Chapter 4. Competitive Landscape
4.1. Market Share Analysis
4.1.1. Global Hops Extract Market Share by Company, 2023
4.1.2. Product Offerings of Leading Hops Extract Companies
4.2. Market Entropy
4.2.1. New Product Launches in the Industry
4.2.2. Mergers, Acquisitions, Joint ventures, and Partnerships
4.3. Key Strategies and Best Practices
Chapter 5. Global Market Projections: Best, Reference, and Low Case Scenarios
5.1. Growth Analysis- Case Scenario Definitions
5.2. Low Growth Case Scenario Forecasts
5.3. Reference Growth Case Scenario Forecasts
5.4. High Growth Case Scenario Forecasts
Chapter 6. Market Dynamics
6.1. Hops Extract Market Drivers
6.2. Hops Extract Market Challenges
6.6. Hops Extract Market Opportunities
6.4. Hops Extract Market Trends
Chapter 7. Global Hops Extract Market Outlook Trends
7.1. Global Hops Extract Revenue (USD Million) and CAGR (%) by Type (2021-2032)
7.2. Global Hops Extract Revenue (USD Million) and CAGR (%) by Application (2021-2032)
7.3. Global Hops Extract Revenue (USD Million) and CAGR (%) by Product (2021-2032)
By Type
Organic
Conventional
By Application
Bittering Agents
Aroma Agents
Dual Purposes
Chapter 8. Global Hops Extract Regional Analysis and Outlook
8.1. Global Hops Extract Revenue (USD Million) By Regions (2021- 2032)
8.2. North America Hops Extract Revenue (USD Million) by Country (2021-2032)
8.2.1. United States Hops Extract Regional Analysis and Outlook
8.2.2. Canada Hops Extract Regional Analysis and Outlook
8.2.3. Mexico Hops Extract Regional Analysis and Outlook
8.3. Europe Hops Extract Revenue (USD Million), by Country (2021-2032)
8.3.1. Germany Hops Extract Regional Analysis and Outlook
8.3.2. France Hops Extract Regional Analysis and Outlook
8.3.3. United Kingdom Hops Extract Regional Analysis and Outlook
8.3.4. Spain Hops Extract Regional Analysis and Outlook
8.3.5. Italy Hops Extract Regional Analysis and Outlook
8.3.6. Russia Hops Extract Regional Analysis and Outlook
8.3.7. Rest of Europe Hops Extract Regional Analysis and Outlook
8.4. Asia Pacific Hops Extract Revenue (USD Million) by Country (2021-2032)
8.4.1. China Hops Extract Regional Analysis and Outlook
8.4.2. Japan Hops Extract Regional Analysis and Outlook
8.4.3. India Hops Extract Regional Analysis and Outlook
8.4.4. South Korea Hops Extract Regional Analysis and Outlook
8.4.5. Australia Hops Extract Regional Analysis and Outlook
8.4.6. South East Asia Hops Extract Regional Analysis and Outlook
8.4.7. Rest of Asia Pacific Hops Extract Regional Analysis and Outlook
8.5. South America Hops Extract Revenue (USD Million), by Country (2021-2032)
8.5.1. Brazil Hops Extract Regional Analysis and Outlook
8.5.2. Argentina Hops Extract Regional Analysis and Outlook
8.5.3. Rest of South America Hops Extract Regional Analysis and Outlook
8.6. Middle East and Africa Hops Extract Revenue (USD Million) by Country (2021-2032)
8.6.1. Middle East Hops Extract Regional Analysis and Outlook
8.6.2. Africa Hops Extract Regional Analysis and Outlook
Chapter 9. North America Hops Extract Analysis and Outlook
9.1. North America Hops Extract Revenue (USD Million) by Segments (2021-2032)
9.1.1. North America Hops Extract Revenue (USD Million) by Type (2021-2032)
9.1.2. North America Hops Extract Revenue (USD Million) by Application (2021-2032)
9.1.3. North America Hops Extract Revenue (USD Million) by Product (2021-2032)
By Type
Organic
Conventional
By Application
Bittering Agents
Aroma Agents
Dual Purposes
Chapter 10. Europe Hops Extract Analysis and Outlook
10.1. Europe Hops Extract Revenue (USD Million), by Segments (USD Million) (2021-2032)
10.1.1. Europe Hops Extract Revenue (USD Million) by Type (2021-2032)
10.1.2. Europe Hops Extract Revenue (USD Million) by Application (2021-2032)
10.1.3. Europe Hops Extract Revenue (USD Million) by Product (2021-2032)
By Type
Organic
Conventional
By Application
Bittering Agents
Aroma Agents
Dual Purposes
Chapter 11. Asia Pacific Hops Extract Analysis and Outlook
11.1. Asia Pacific Hops Extract Revenue (USD Million), and Revenue (USD Million) by Segments (2021-2032)
11.1.1. Asia Pacific Hops Extract Revenue (USD Million) by Type (2021-2032)
11.1.2. Asia Pacific Hops Extract Revenue (USD Million) by Application (2021-2032)
11.1.3. Asia Pacific Hops Extract Revenue (USD Million) by Product (2021-2032)
By Type
Organic
Conventional
By Application
Bittering Agents
Aroma Agents
Dual Purposes
Chapter 12. South America Hops Extract Analysis and Outlook
12.1. South America Hops Extract Revenue (USD Million), by Segments (2021-2032)
12.1.1. South America Hops Extract Revenue (USD Million) by Type (2021-2032)
12.1.2. South America Hops Extract Revenue (USD Million) by Application (2021-2032)
12.1.3. South America Hops Extract Revenue (USD Million) by Product (2021-2032)
By Type
Organic
Conventional
By Application
Bittering Agents
Aroma Agents
Dual Purposes
Chapter 13. Middle East and Africa Hops Extract Analysis and Outlook
13.1. Middle East and Africa Hops Extract Revenue (USD Million), by Segments (2021-2032)
13.1.1. Middle East and Africa Hops Extract Revenue (USD Million) by Type (2021-2032)
13.1.2. Middle East and Africa Hops Extract Revenue (USD Million) by Application (2021-2032)
13.1.3. Middle East and Africa Hops Extract Revenue (USD Million) by Product (2021-2032)
By Type
Organic
Conventional
By Application
Bittering Agents
Aroma Agents
Dual Purposes
Chapter 14. Hops Extract Company Profiles
14.1 Business Overview
14.2 Product Profiles
14.3 SWOT Profiles
14.5 Recent Developments
14.6 Financial Profile
List of Companies
Aromatrix Flora
Aunutra Industries
Bristol Botanicals
BSG Hops
Crosby Hop Farm
Glacier Hops Ranch
Hopco Pty
Indena
John I. Haas
Kalsec
New Zealand Hops
S. S. Steiner
Willamette Valley Hops
Yakima Chief Hops
15. Methodology and Data Sources
15.1 Customization Offerings
15.2 Subscription Services
15.3 Related Reports
15.4 Publisher Expertise
LIST OF TABLES
Table 1 Market Segmentation Analysis
Table 2 Global Hops Extract Market Share of Leading Companies, 2023
Table 3 Product Offerings of Leading Companies
Table 4 Low Growth Scenario Forecasts
Table 5 Reference Case Growth Scenario
Table 6 High Growth Case Scenario
Table 7 Global Hops Extract Revenue (USD Million) And CAGR (%) By Type (2021-2032)
Table 8 Global Hops Extract Revenue (USD Million) And CAGR (%) By Application (2021-2032)
Table 9 Global Hops Extract Revenue (USD Million) And CAGR (%) By Product (2021-2032)
Table 10 Global Hops Extract Market Revenue (USD Million) By Regions (2021-2032)
Table 11 Global Hops Extract Market Share (%) By Regions (2021-2032)
Table 12 North America Hops Extract Revenue (USD Million) By Country (2021-2032)
Table 13 Europe Hops Extract Revenue (USD Million) By Country (2021-2032)
Table 14 Asia Pacific Hops Extract Revenue (USD Million) By Country (2021-2032)
Table 15 South America Hops Extract Revenue (USD Million) By Country (2021-2032)
Table 16 Middle East and Africa Hops Extract Revenue (USD Million) By Region (2021-2032)
Table 17 North America Hops Extract Revenue (USD Million) By Type (2021-2032)
Table 18 North America Hops Extract Revenue (USD Million) By Application (2021-2032)
Table 19 North America Hops Extract Revenue (USD Million) By Product (2021-2032)
Table 20 Europe Hops Extract Revenue (USD Million) By Type (2021-2032)
Table 21 Europe Hops Extract Revenue (USD Million) By Application (2021-2032)
Table 22 Europe Hops Extract Revenue (USD Million) By Product (2021-2032)
Table 23 Asia Pacific Hops Extract Revenue (USD Million) By Type (2021-2032)
Table 24 Asia Pacific Hops Extract Revenue (USD Million) By Application (2021-2032)
Table 25 Asia Pacific Hops Extract Revenue (USD Million) By Product (2021-2032)
Table 26 South America Hops Extract Revenue (USD Million) By Type (2021-2032)
Table 27 South America Hops Extract Revenue (USD Million) By Application (2021-2032)
Table 28 South America Hops Extract Revenue (USD Million) By Product (2021-2032)
Table 29 Middle East and Africa Hops Extract Revenue (USD Million) By Type (2021-2032)
Table 30 Middle East and Africa Hops Extract Revenue (USD Million) By Application (2021-2032)
Table 31 Middle East and Africa Hops Extract Revenue (USD Million) By Product (2021-2032)
LIST OF FIGURES
Figure 1. Market Scope
Figure 2. Pricing Forecasts Per Unit, 2023- 2032
Figure 3. Porter’s Five Forces
Figure 4. Global Hops Extract Market Revenue (USD Million) By Regions (2021-2032)
Figure 5. Global Hops Extract Market Share (%) By Regions (2023)
Figure 6. North America Hops Extract Revenue (USD Million) By Country (2021-2032)
Figure 7. United States Hops Extract Revenue (USD Million) By Country (2021-2032)
Figure 8. Canada Hops Extract Revenue (USD Million) By Country (2021-2032)
Figure 9. Mexico Hops Extract Revenue (USD Million) By Country (2021-2032)
Figure 10. Europe Hops Extract Revenue (USD Million) By Country (2021-2032)
Figure 11. Germany Hops Extract Revenue (USD Million) By Country (2021-2032)
Figure 12. France Hops Extract Revenue (USD Million) By Country (2021-2032)
Figure 13. United Kingdom Hops Extract Revenue (USD Million) By Country (2021-2032)
Figure 14. Spain Hops Extract Revenue (USD Million) By Country (2021-2032)
Figure 15. Italy Hops Extract Revenue (USD Million) By Country (2021-2032)
Figure 16. Russia Hops Extract Revenue (USD Million) By Country (2021-2032)
Figure 17. Rest of Europe Hops Extract Revenue (USD Million) By Country (2021-2032)
Figure 11. Asia Pacific Hops Extract Revenue (USD Million) By Country (2021-2032)
Figure 12. China Hops Extract Revenue (USD Million) By Country (2021-2032)
Figure 13. Japan Hops Extract Revenue (USD Million) By Country (2021-2032)
Figure 14. India Hops Extract Revenue (USD Million) By Country (2021-2032)
Figure 15. South Korea Hops Extract Revenue (USD Million) By Country (2021-2032)
Figure 16. Australia Hops Extract Revenue (USD Million) By Country (2021-2032)
Figure 17. South East Asia Hops Extract Revenue (USD Million) By Country (2021-2032)
Figure 18. South America Hops Extract Revenue (USD Million) By Country (2021-2032)
Figure 19. Brazil Hops Extract Revenue (USD Million) By Country (2021-2032)
Figure 20. Argentina Hops Extract Revenue (USD Million) By Country (2021-2032)
Figure 21. Rest of Asia Pacific Hops Extract Revenue (USD Million) By Country (2021-2032)
Figure 22. Middle East and Africa Hops Extract Revenue (USD Million) By Region (2021-2032)
Figure 23. Saudi Arabia Hops Extract Revenue (USD Million) By Region (2021-2032)
Figure 24. The UAE Hops Extract Revenue (USD Million) By Region (2021-2032)
Figure 25. Rest of Middle East Hops Extract Revenue (USD Million) By Region (2021-2032)
Figure 26. South Africa Hops Extract Revenue (USD Million) By Region (2021-2032)
Figure 27. Africa Hops Extract Revenue (USD Million) By Region (2021-2032)
Figure 28. North America Hops Extract Revenue (USD Million) By Type (2021-2032)
Figure 29. North America Hops Extract Revenue (USD Million) By Application (2021-2032)
Figure 30. North America Hops Extract Revenue (USD Million) By Product (2021-2032)
Figure 31. Europe Hops Extract Revenue (USD Million) By Type (2021-2032)
Figure 32. Europe Hops Extract Revenue (USD Million) By Application (2021-2032)
Figure 33. Europe Hops Extract Revenue (USD Million) By Product (2021-2032)
Figure 34. Asia Pacific Hops Extract Revenue (USD Million) By Type (2021-2032)
Figure 35. Asia Pacific Hops Extract Revenue (USD Million) By Application (2021-2032)
Figure 36. Asia Pacific Hops Extract Revenue (USD Million) By Product (2021-2032)
Figure 37. South America Hops Extract Revenue (USD Million) By Type (2021-2032)
Figure 38. South America Hops Extract Revenue (USD Million) By Application (2021-2032)
Figure 39. South America Hops Extract Revenue (USD Million) By Product (2021-2032)
Figure 40. Middle East and Africa Hops Extract Revenue (USD Million) By Type (2021-2032)
Figure 41. Middle East and Africa Hops Extract Revenue (USD Million) By Application (2021-2032)
Figure 42. Middle East and Africa Hops Extract Revenue (USD Million) By Product (2021-2032)
By Type
Organic
Conventional
By Application
Bittering Agents
Aroma Agents
Dual Purposes
Countries Analyzed
North America (US, Canada, Mexico)
Europe (Germany, UK, France, Spain, Italy, Russia, Rest of Europe)
Asia Pacific (China, India, Japan, South Korea, Australia, South East Asia, Rest of Asia)
South America (Brazil, Argentina, Rest of South America)
Middle East and Africa (Saudi Arabia, UAE, Rest of Middle East, South Africa, Egypt, Rest of Africa)
