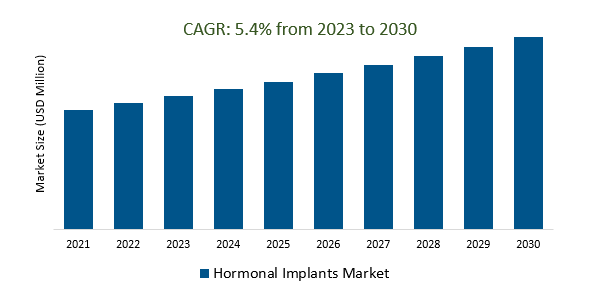
The Global Hormonal Implants Market Size is estimated to register 5.4% growth over the forecast period from 2023 to 2030.
The market growth is driven by the increasing awareness about family planning and the importance of birth control methods in controlling population growth is boosting the hormonal implant market, especially in emerging economies. Leading companies that are focused on Technological Advancements, Wider Range of Indications, Personalized Medicine, Telehealth and Remote Monitoring, Combination Implants, Increasing Awareness and Education, and others to boost market shares in the industry.
Market Overview
The Hormonal Implants Market encompasses long-acting contraceptive devices releasing hormones, offering high effectiveness, and convenience. Key drivers include efficacy, demand for long-acting contraception, women's empowerment, technological advancements, global population growth, aging demographics, and government initiatives. Challenges include cost, accessibility, side effects, regulatory hurdles, and competition. Geographically, North America, Europe, Asia-Pacific, Latin America, and the Middle East and Africa are significant markets. Key players include Merck, Bayer, AbbVie (formerly Allergan), Pfizer, and Mylan. The market is expected to grow with increasing awareness, technology advancements, and expanding applications beyond contraception.
Market Dynamics
Market Trends - Hormonal implants can help to increase female workforce participation
Hormonal implants, such as contraceptives, can indirectly boost female workforce participation by providing women with greater control over family planning, enabling them to delay or space pregnancies, reduce unplanned pregnancies, maintain their health, and contribute to gender equality in the workplace. However, workforce participation is influenced by a complex interplay of societal, economic, and policy factors, necessitating a comprehensive approach that goes beyond contraception to address barriers women face in balancing work and family responsibilities.
Market Driver- The rising awareness of family planning is driving demand for hormonal implants
The rising awareness of family planning is fueling demand for hormonal implants as an effective, long-lasting, and discreet contraceptive option. These implants provide reliable birth control, are reversible for future fertility, and offer privacy. Accessible healthcare services and education about family planning methods contribute to their increasing popularity, as individuals and couples seek informed choices for responsible reproductive health management.
Market Opportunity-Introduction of E-commerce and Telehealth Services
The convergence of e-commerce and telehealth services has brought about a transformative shift in the hormonal implants market. E-commerce platforms provide a seamless and user-friendly channel for purchasing these implants, improving accessibility for consumers. Simultaneously, telehealth services enable remote consultations with healthcare experts, streamlining the prescription and guidance process without requiring in-person clinic visits. This integration not only enhances the convenience and efficiency of acquiring hormonal implants but also has the potential to drive higher adoption rates, marking a significant evolution in the landscape of contraceptive healthcare services.
Market Share Analysis- Levonorgestrel Hormonal Implants the Hormonal Implants Market will register the fastest growth
The Global Hormonal Implants Market is analyzed across Levonorgestrel Hormonal Implants, Etonogestrel Hormonal Implants, and others. Levonorgestrel Hormonal Implants are poised to register the fastest growth. Levonorgestrel hormonal implants are a cornerstone of the hormonal implants market, known for their high effectiveness and convenience as a long-acting reversible contraception (LARC) option. These implants, containing the hormone levonorgestrel, offer prolonged pregnancy protection after a simple insertion procedure. Their reliability, discretion, and long-lasting nature have made them a popular choice, driving significant growth in the hormonal implants market.
Market Share Analysis- One Rod device held a significant market share in 2023
The Global Hormonal Implants Market is analyzed across various Types including One Rod Device, Two Rod Device, and others. Of these, One Rod Device held a significant market share in 2023. The "One Rod" device, a single-rod contraceptive implant containing etonogestrel, is a significant player in the hormonal implants market. Its simple insertion and long-lasting protection (typically three years) make it an attractive choice for individuals seeking reliable and convenient birth control. This device's effectiveness and discreet nature have fueled its popularity, contributing to the growth of the hormonal implants market.
Hormonal Implants Market Segmentation
By Category
- Levonorgestrel Hormonal Implants
- Etonogestrel Hormonal Implants
By Type
- One Rod Device
- Two Rod Device
By Application
By Region
- North America (United States, Canada, Mexico)
- Europe (Germany, France, United Kingdom, Spain, Italy, Others)
- Asia Pacific (China, India, Japan, South Korea, Australia, Others)
- Latin America (Brazil, Argentina, Others)
- Middle East and Africa (Saudi Arabia, UAE, Kuwait, Other Middle East, South Africa, Nigeria, Other Africa)
Hormonal Implants Market companies
- Bayer AG
- Merck
- Allergan
- Shanghai Dahua Pharmaceuticals
*List not exhaustive
Hormonal Implants Market Outlook 2023
1 Market Overview
1.1 Introduction to the Hormonal Implants Market
1.2 Scope of the Study
1.3 Research Objective
1.3.1 Key Market Scope and Segments
1.3.2 Players Covered
1.3.3 Years Considered
2 Executive Summary
2.1 2023 Hormonal Implants Industry- Market Statistics
3 Market Dynamics
3.1 Market Drivers
3.2 Market Challenges
3.3 Market Opportunities
3.4 Market Trends
4 Market Factor Analysis
4.1 Porter’s Five Forces
4.2 Market Entropy
4.2.1 Global Hormonal Implants Market Companies with Area Served
4.2.2 Products Offerings Global Hormonal Implants Market
5 COVID-19 Impact Analysis and Outlook Scenarios
5.1.1 Covid-19 Impact Analysis
5.1.2 Post-COVID-19 Scenario- Low Growth Case
5.1.3 Post-COVID-19 Scenario- Reference Growth Case
5.1.4 Post-COVID-19 Scenario- Low Growth Case
6 Global Hormonal Implants Market Trends
6.1 Global Hormonal Implants Revenue (USD Million) and CAGR (%) by Type (2018-2030)
6.2 Global Hormonal Implants Revenue (USD Million) and CAGR (%) by Applications (2018-2030)
6.3 Global Hormonal Implants Revenue (USD Million) and CAGR (%) by Regions (2018-2030)
7 Global Hormonal Implants Market Revenue (USD Million) by Type, and Applications (2018-2022)
7.1 Global Hormonal Implants Revenue (USD Million) by Type (2018-2022)
7.1.1 Global Hormonal Implants Revenue (USD Million), Market Share (%) by Type (2018-2022)
7.2 Global Hormonal Implants Revenue (USD Million) by Applications (2018-2022)
7.2.1 Global Hormonal Implants Revenue (USD Million), Market Share (%) by Applications (2018-2022)
8 Global Hormonal Implants Development Regional Status and Outlook
8.1 Global Hormonal Implants Revenue (USD Million) By Regions (2018-2022)
8.2 North America Hormonal Implants Revenue (USD Million) by Type, and Application (2018-2022)
8.2.1 North America Hormonal Implants Revenue (USD Million) by Country (2018-2022)
8.2.2 North America Hormonal Implants Revenue (USD Million) by Type (2018-2022)
8.2.3 North America Hormonal Implants Revenue (USD Million) by Applications (2018-2022)
8.3 Europe Hormonal Implants Revenue (USD Million), by Type, and Applications (USD Million) (2018-2022)
8.3.1 Europe Hormonal Implants Revenue (USD Million), by Country (2018-2022)
8.3.2 Europe Hormonal Implants Revenue (USD Million) by Type (2018-2022)
8.3.3 Europe Hormonal Implants Revenue (USD Million) by Applications (2018-2022)
8.4 Asia Pacific Hormonal Implants Revenue (USD Million), and Revenue (USD Million) by Type, and Applications (2018-2022)
8.4.1 Asia Pacific Hormonal Implants Revenue (USD Million) by Country (2018-2022)
8.4.2 Asia Pacific Hormonal Implants Revenue (USD Million) by Type (2018-2022)
8.4.3 Asia Pacific Hormonal Implants Revenue (USD Million) by Applications (2018-2022)
8.5 South America Hormonal Implants Revenue (USD Million), by Type, and Applications (2018-2022)
8.5.1 South America Hormonal Implants Revenue (USD Million), by Country (2018-2022)
8.5.2 South America Hormonal Implants Revenue (USD Million) by Type (2018-2022)
8.5.3 South America Hormonal Implants Revenue (USD Million) by Applications (2018-2022)
8.6 Middle East and Africa Hormonal Implants Revenue (USD Million), by Type, Technology, Application, Thickness (2018-2022)
8.6.1 Middle East and Africa Hormonal Implants Revenue (USD Million) by Country (2018-2022)
8.6.2 Middle East and Africa Hormonal Implants Revenue (USD Million) by Type (2018-2022)
8.6.3 Middle East and Africa Hormonal Implants Revenue (USD Million) by Applications (2018-2022)
9 Company Profiles
10 Global Hormonal Implants Market Revenue (USD Million), by Type, and Applications (2023-2030)
10.1 Global Hormonal Implants Revenue (USD Million) and Market Share (%) by Type (2023-2030)
10.1.1 Global Hormonal Implants Revenue (USD Million), and Market Share (%) by Type (2023-2030)
10.2 Global Hormonal Implants Revenue (USD Million) and Market Share (%) by Applications (2023-2030)
10.2.1 Global Hormonal Implants Revenue (USD Million), and Market Share (%) by Applications (2023-2030)
11 Global Hormonal Implants Development Regional Status and Outlook Forecast
11.1 Global Hormonal Implants Revenue (USD Million) By Regions (2023-2030)
11.2 North America Hormonal Implants Revenue (USD Million) by Type, and Applications (2023-2030)
11.2.1 North America Hormonal Implants Revenue (USD) Million by Country (2023-2030)
11.2.2 North America Hormonal Implants Revenue (USD Million), by Type (2023-2030)
11.2.3 North America Hormonal Implants Revenue (USD Million), Market Share (%) by Applications (2023-2030)
11.3 Europe Hormonal Implants Revenue (USD Million), by Type, and Applications (2023-2030)
11.3.1 Europe Hormonal Implants Revenue (USD Million), by Country (2023-2030)
11.3.2 Europe Hormonal Implants Revenue (USD Million), by Type (2023-2030)
11.3.3 Europe Hormonal Implants Revenue (USD Million), by Applications (2023-2030)
11.4 Asia Pacific Hormonal Implants Revenue (USD Million) by Type, and Applications (2023-2030)
11.4.1 Asia Pacific Hormonal Implants Revenue (USD Million), by Country (2023-2030)
11.4.2 Asia Pacific Hormonal Implants Revenue (USD Million), by Type (2023-2030)
11.4.3 Asia Pacific Hormonal Implants Revenue (USD Million), by Applications (2023-2030)
11.5 South America Hormonal Implants Revenue (USD Million), by Type, and Applications (2023-2030)
11.5.1 South America Hormonal Implants Revenue (USD Million), by Country (2023-2030)
11.5.2 South America Hormonal Implants Revenue (USD Million), by Type (2023-2030)
11.5.3 South America Hormonal Implants Revenue (USD Million), by Applications (2023-2030)
11.6 Middle East and Africa Hormonal Implants Revenue (USD Million), by Type, and Applications (2023-2030)
11.6.1 Middle East and Africa Hormonal Implants Revenue (USD Million), by Region (2023-2030)
11.6.2 Middle East and Africa Hormonal Implants Revenue (USD Million), by Type (2023-2030)
11.6.3 Middle East and Africa Hormonal Implants Revenue (USD Million), by Applications (2023-2030)
12 Methodology and Data Sources
12.1 Methodology/Research Approach
12.1.1 Research Programs/Design
12.1.2 Market Size Estimation
12.1.3 Market Breakdown and Data Triangulation
12.2 Data Sources
12.2.1 Secondary Sources
12.2.2 Primary Sources
12.3 Disclaimer
List of Tables
Table 1 Market Segmentation Analysis
Table 2 Global Hormonal Implants Market Companies with Areas Served
Table 3 Products Offerings Global Hormonal Implants Market
Table 4 Low Growth Scenario Forecasts
Table 5 Reference Case Growth Scenario
Table 6 High Growth Case Scenario
Table 7 Global Hormonal Implants Revenue (USD Million) And CAGR (%) By Type (2018-2030)
Table 8 Global Hormonal Implants Revenue (USD Million) And CAGR (%) By Applications (2018-2030)
Table 9 Global Hormonal Implants Revenue (USD Million) And CAGR (%) By Regions (2018-2030)
Table 10 Global Hormonal Implants Revenue (USD Million) By Type (2018-2022)
Table 11 Global Hormonal Implants Revenue Market Share (%) By Type (2018-2022)
Table 12 Global Hormonal Implants Revenue (USD Million) By Applications (2018-2022)
Table 13 Global Hormonal Implants Revenue Market Share (%) By Applications (2018-2022)
Table 14 Global Hormonal Implants Market Revenue (USD Million) By Regions (2018-2022)
Table 15 Global Hormonal Implants Market Share (%) By Regions (2018-2022)
Table 16 North America Hormonal Implants Revenue (USD Million) By Country (2018-2022)
Table 17 North America Hormonal Implants Revenue (USD Million) By Type (2018-2022)
Table 18 North America Hormonal Implants Revenue (USD Million) By Applications (2018-2022)
Table 19 Europe Hormonal Implants Revenue (USD Million) By Country (2018-2022)
Table 20 Europe Hormonal Implants Revenue (USD Million) By Type (2018-2022)
Table 21 Europe Hormonal Implants Revenue (USD Million) By Applications (2018-2022)
Table 22 Asia Pacific Hormonal Implants Revenue (USD Million) By Country (2018-2022)
Table 23 Asia Pacific Hormonal Implants Revenue (USD Million) By Type (2018-2022)
Table 24 Asia Pacific Hormonal Implants Revenue (USD Million) By Applications (2018-2022)
Table 25 South America Hormonal Implants Revenue (USD Million) By Country (2018-2022)
Table 26 South America Hormonal Implants Revenue (USD Million) By Type (2018-2022)
Table 27 South America Hormonal Implants Revenue (USD Million) By Applications (2018-2022)
Table 28 Middle East and Africa Hormonal Implants Revenue (USD Million) By Region (2018-2022)
Table 29 Middle East and Africa Hormonal Implants Revenue (USD Million) By Type (2018-2022)
Table 30 Middle East and Africa Hormonal Implants Revenue (USD Million) By Applications (2018-2022)
Table 31 Financial Analysis
Table 32 Global Hormonal Implants Revenue (USD Million) By Type (2023-2030)
Table 33 Global Hormonal Implants Revenue Market Share (%) By Type (2023-2030)
Table 34 Global Hormonal Implants Revenue (USD Million) By Applications (2023-2030)
Table 35 Global Hormonal Implants Revenue Market Share (%) By Applications (2023-2030)
Table 36 Global Hormonal Implants Market Revenue (USD Million), And Revenue (USD Million) By Regions (2023-2030)
Table 37 North America Hormonal Implants Revenue (USD)By Country (2023-2030)
Table 38 North America Hormonal Implants Revenue (USD Million) By Type (2023-2030)
Table 39 North America Hormonal Implants Revenue (USD Million) By Applications (2023-2030)
Table 40 Europe Hormonal Implants Revenue (USD Million) By Country (2023-2030)
Table 41 Europe Hormonal Implants Revenue (USD Million) By Type (2023-2030)
Table 42 Europe Hormonal Implants Revenue (USD Million) By Applications (2023-2030)
Table 43 Asia Pacific Hormonal Implants Revenue (USD Million) By Country (2023-2030)
Table 44 Asia Pacific Hormonal Implants Revenue (USD Million) By Type (2023-2030)
Table 45 Asia Pacific Hormonal Implants Revenue (USD Million) By Applications (2023-2030)
Table 46 South America Hormonal Implants Revenue (USD Million) By Country (2023-2030)
Table 47 South America Hormonal Implants Revenue (USD Million) By Type (2023-2030)
Table 48 South America Hormonal Implants Revenue (USD Million) By Applications (2023-2030)
Table 49 Middle East and Africa Hormonal Implants Revenue (USD Million) By Region (2023-2030)
Table 50 Middle East and Africa Hormonal Implants Revenue (USD Million) By Region (2023-2030)
Table 51 Middle East and Africa Hormonal Implants Revenue (USD Million) By Type (2023-2030)
Table 52 Middle East and Africa Hormonal Implants Revenue (USD Million) By Applications (2023-2030)
Table 53 Research Programs/Design for This Report
Table 54 Key Data Information from Secondary Sources
Table 55 Key Data Information from Primary Sources
List of Figures
Figure 1 Market Scope
Figure 2 Porter’s Five Forces
Figure 3 Global Hormonal Implants Revenue (USD Million) By Type (2018-2022)
Figure 4 Global Hormonal Implants Revenue Market Share (%) By Type (2022)
Figure 5 Global Hormonal Implants Revenue (USD Million) By Applications (2018-2022)
Figure 6 Global Hormonal Implants Revenue Market Share (%) By Applications (2022)
Figure 7 Global Hormonal Implants Market Revenue (USD Million) By Regions (2018-2022)
Figure 8 Global Hormonal Implants Market Share (%) By Regions (2022)
Figure 9 North America Hormonal Implants Revenue (USD Million) By Country (2018-2022)
Figure 10 North America Hormonal Implants Revenue (USD Million) By Type (2018-2022)
Figure 11 North America Hormonal Implants Revenue (USD Million) By Applications (2018-2022)
Figure 12 Europe Hormonal Implants Revenue (USD Million) By Country (2018-2022)
Figure 13 Europe Hormonal Implants Revenue (USD Million) By Type (2018-2022)
Figure 14 Europe Hormonal Implants Revenue (USD Million) By Applications (2018-2022)
Figure 15 Asia Pacific Hormonal Implants Revenue (USD Million) By Country (2018-2022)
Figure 16 Asia Pacific Hormonal Implants Revenue (USD Million) By Type (2018-2022)
Figure 17 Asia Pacific Hormonal Implants Revenue (USD Million) By Applications (2018-2022)
Figure 18 South America Hormonal Implants Revenue (USD Million) By Country (2018-2022)
Figure 19 South America Hormonal Implants Revenue (USD Million) By Type (2018-2022)
Figure 20 South America Hormonal Implants Revenue (USD Million) By Applications (2018-2022)
Figure 21 Middle East and Africa Hormonal Implants Revenue (USD Million) By Region (2018-2022)
Figure 22 Middle East and Africa Hormonal Implants Revenue (USD Million) By Type (2018-2022)
Figure 23 Middle East and Africa Hormonal Implants Revenue (USD Million) By Applications (2018-2022)
Figure 24 Global Hormonal Implants Revenue (USD Million) By Type (2023-2030)
Figure 25 Global Hormonal Implants Revenue Market Share (%) By Type (2030)
Figure 26 Global Hormonal Implants Revenue (USD Million) By Applications (2023-2030)
Figure 27 Global Hormonal Implants Revenue Market Share (%) By Applications (2030)
Figure 28 Global Hormonal Implants Market Revenue (USD Million) By Regions (2023-2030)
Figure 29 North America Hormonal Implants Revenue (USD Million) By Country (2023-2030)
Figure 30 North America Hormonal Implants Revenue (USD Million) By Type (2023-2030)
Figure 31 North America Hormonal Implants Revenue (USD Million) By Applications (2023-2030)
Figure 32 Europe Hormonal Implants Revenue (USD Million) By Country (2023-2030)
Figure 33 Europe Hormonal Implants Revenue (USD Million) By Type (2023-2030)
Figure 34 Europe Hormonal Implants Revenue (USD Million) By Applications (2023-2030)
Figure 35 Asia Pacific Hormonal Implants Revenue (USD Million) By Country (2023-2030)
Figure 36 Asia Pacific Hormonal Implants Revenue (USD Million) By Type (2023-2030)
Figure 37 Asia Pacific Hormonal Implants Revenue (USD Million) By Applications (2023-2030)
Figure 38 South America Hormonal Implants Revenue (USD Million) By Country (2023-2030)
Figure 39 South America Hormonal Implants Revenue (USD Million) By Type (2023-2030)
Figure 40 South America Hormonal Implants Revenue (USD Million) By Applications (2023-2030)
Figure 41 Middle East and Africa Hormonal Implants Revenue (USD Million) By Region (2023-2030)
Figure 42 Middle East and Africa Hormonal Implants Revenue (USD Million) By Region (2023-2030)
Figure 43 Middle East and Africa Hormonal Implants Revenue (USD Million) By Type (2023-2030)
Figure 44 Middle East and Africa Hormonal Implants Revenue (USD Million) By Applications (2023-2030)
Figure 45 Bottom-Up and Top-Down Approaches For This Report
Figure 46 Data Triangulation
