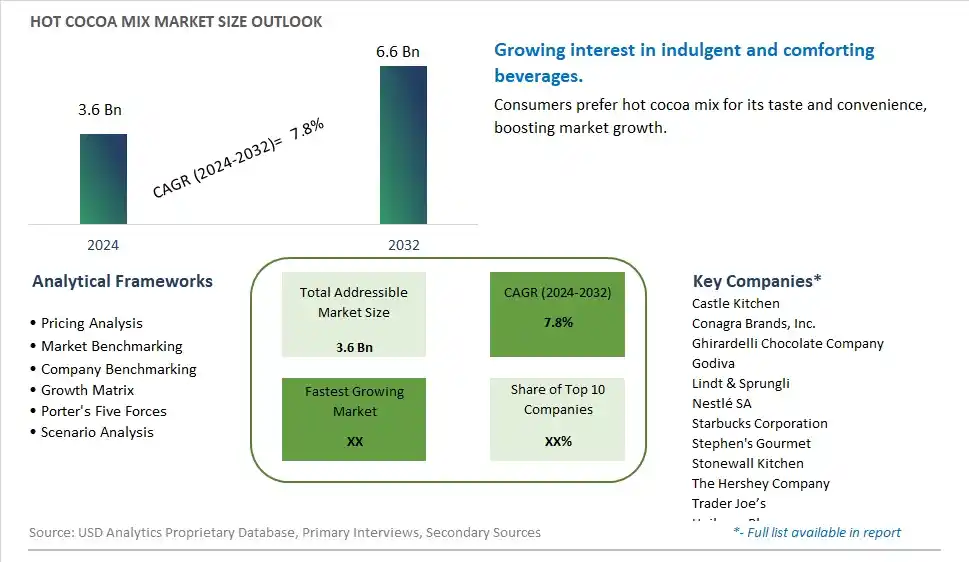
Global Hot Cocoa Mix Market Size is valued at $3.6 Billion in 2024 and is forecast to register a growth rate (CAGR) of 7.8% to reach $6.6 Billion by 2032.
The global Hot Cocoa Mix Market Comprehensive Study analyzes and forecasts the market size across 6 regions and 24 countries for diverse segments -By Type (Multi-Flavored Hot Cocoa, Plain Hot Cocoa), By Application (Hypermarket/Supermarket, Chocolate Shop, Online Retail, Others)
An Introduction to Hot Cocoa Mix Market
In 2024, the hot cocoa mix market is thriving, driven by the enduring popularity of chocolate beverages and the increasing interest in premium and health-focused products. Manufacturers are innovating with unique flavors, organic ingredients, and reduced-sugar options to cater to health-conscious consumers. Additionally, sustainable sourcing of cocoa and ethical production practices are becoming key differentiators in the market. The rise of online retail and e-commerce platforms is further boosting market accessibility and growth, making hot cocoa mixes more available to a global audience.
Hot Cocoa Mix Competitive Landscape
The market report analyses the leading companies in the industry including Castle Kitchen, Conagra Brands, Inc., Ghirardelli Chocolate Company, Godiva, Lindt & Sprungli, Nestlé SA, Starbucks Corporation, Stephen's Gourmet, Stonewall Kitchen, The Hershey Company, Trader Joe’s, Unilever Plc, Venchi, Williams-Sonoma, and Others.
Hot Cocoa Mix Market Dynamics
Hot Cocoa Mix Market Trend: Growing Demand for Premium and Artisanal Products
The most prominent trend in the Hot Cocoa Mix Market is the growing demand for premium and artisanal products. Consumers are increasingly seeking high-quality hot cocoa mixes that offer rich flavors, superior ingredients, and unique blends. This trend is driven by the rising disposable incomes and the desire for indulgent and luxurious food experiences. Artisanal hot cocoa mixes that use ethically sourced cocoa, natural sweeteners, and innovative flavors are gaining popularity as consumers look for products that provide both taste and quality.
Hot Cocoa Mix Market Driver: Increasing Popularity of Home-Based Beverages
A key driver for the Hot Cocoa Mix Market is the increasing popularity of home-based beverages. With the rise of remote work and more people spending time at home, there is a growing demand for convenient and high-quality beverage options that can be enjoyed at home. Hot cocoa mixes, which offer a quick and easy way to prepare a comforting and delicious drink, are benefiting from this trend. The convenience and versatility of hot cocoa mixes are driving their demand as consumers seek enjoyable beverage experiences within the comfort of their homes.
Hot Cocoa Mix Market Opportunity: Expansion into Health-Conscious Variants
One potential opportunity in the Hot Cocoa Mix Market lies in the expansion into health-conscious variants. As consumers become more health-conscious, there is a growing demand for hot cocoa mixes that offer health benefits such as reduced sugar, added vitamins and minerals, and natural ingredients. By developing hot cocoa mixes that cater to health-conscious consumers, manufacturers can tap into a new market segment and drive growth. Additionally, promoting the health benefits of these products through effective marketing strategies can further enhance their appeal and market reach.
Hot Cocoa Mix Market Share Analysis: Plain Hot Cocoa segment generated the highest revenue share in the industry
Plain Hot Cocoa emerges as the largest segment in the Hot Cocoa Mix Market by type. This popularity stems from its classic appeal and straightforward preparation, making it a favorite among consumers seeking a comforting and indulgent beverage. Plain hot cocoa consists of cocoa powder, sugar, and sometimes milk powder, offering a rich chocolate flavor that can be customized with additional ingredients like marshmallows or whipped cream. Its simplicity and versatility contribute to its widespread consumption across various demographics and occasions, from cozy evenings at home to holiday gatherings. The enduring popularity of plain hot cocoa underscores its status as a staple in the hot beverage category, favored for its comforting taste and ease of preparation.
Hot Cocoa Mix Market Share Analysis: Online Retail is the fastest growing segment over the forecast period to 2032
The fastest growing segment in the Hot Cocoa Mix Market by application is online retail. Online retail channels have witnessed significant growth as consumers increasingly turn to e-commerce platforms for their shopping needs, including hot cocoa mixes. The convenience of online shopping allows consumers to explore a wide range of products, compare prices, and read reviews from other users, all from the comfort of their homes. This trend has been accelerated by advancements in technology, improved internet accessibility, and shifting consumer preferences towards digital shopping experiences. Online retail not only provides convenience but also expands market reach beyond traditional brick-and-mortar stores, tapping into a global consumer base interested in specialty hot cocoa mixes and unique flavors. As a result, online retail is poised to drive substantial growth in the hot cocoa mix market through 2032, catering to evolving consumer behaviors and preferences in the beverage industry.
Hot Cocoa Mix Market Segmentation
By Type
Multi-Flavored Hot Cocoa
Plain Hot Cocoa
By Application
Hypermarket/Supermarket
Chocolate Shop
Online Retail
Others
Countries Analyzed
North America (US, Canada, Mexico)
Europe (Germany, UK, France, Spain, Italy, Russia, Rest of Europe)
Asia Pacific (China, India, Japan, South Korea, Australia, South East Asia, Rest of Asia)
South America (Brazil, Argentina, Rest of South America)
Middle East and Africa (Saudi Arabia, UAE, Rest of Middle East, South Africa, Egypt, Rest of Africa)
Hot Cocoa Mix Companies Profiled in the Study
Castle Kitchen
Conagra Brands, Inc.
Ghirardelli Chocolate Company
Godiva
Lindt & Sprungli
Nestlé SA
Starbucks Corporation
Stephen's Gourmet
Stonewall Kitchen
The Hershey Company
Trader Joe’s
Unilever Plc
Venchi
Williams-Sonoma
*- List Not Exhaustive
Chapter 1. TABLE OF CONTENTS
Chapter 2. Introduction to Hot Cocoa Mix Market
2.1. Market Overview
2.2. Key Statistics and Report Highlights
2.3. Scope of the Comprehensive Study
2.3.1. Market Definition
2.3.2 Countries and Regions Covered
2.3.3 Research Objective
2.3.4 Units, Currency, and Conversions
2.3.5 Industry Value Chain
2.4. Key Market Segments
2.5. Key Companies
2.6. Study Period
Chapter 3. Strategic Analysis Review
3.1. Hot Cocoa Mix Pricing Analysis and Forecast
3.2. Porter’s Five Forces
3.3. Market Ecosystem
3.4. SWOT Analysis
3.5. Regulatory Scenario
3.3. Effects of Inflation, Russia-Ukraine War, moderating economic growth, and other macroeconomic factors
Chapter 4. Competitive Landscape
4.1. Market Share Analysis
4.1.1. Global Hot Cocoa Mix Market Share by Company, 2023
4.1.2. Product Offerings of Leading Hot Cocoa Mix Companies
4.2. Market Entropy
4.2.1. New Product Launches in the Industry
4.2.2. Mergers, Acquisitions, Joint ventures, and Partnerships
4.3. Key Strategies and Best Practices
Chapter 5. Global Market Projections: Best, Reference, and Low Case Scenarios
5.1. Growth Analysis- Case Scenario Definitions
5.2. Low Growth Case Scenario Forecasts
5.3. Reference Growth Case Scenario Forecasts
5.4. High Growth Case Scenario Forecasts
Chapter 6. Market Dynamics
6.1. Hot Cocoa Mix Market Drivers
6.2. Hot Cocoa Mix Market Challenges
6.6. Hot Cocoa Mix Market Opportunities
6.4. Hot Cocoa Mix Market Trends
Chapter 7. Global Hot Cocoa Mix Market Outlook Trends
7.1. Global Hot Cocoa Mix Revenue (USD Million) and CAGR (%) by Type (2021-2032)
7.2. Global Hot Cocoa Mix Revenue (USD Million) and CAGR (%) by Application (2021-2032)
7.3. Global Hot Cocoa Mix Revenue (USD Million) and CAGR (%) by Product (2021-2032)
By Type
Multi-Flavored Hot Cocoa
Plain Hot Cocoa
By Application
Hypermarket/Supermarket
Chocolate Shop
Online Retail
Others
Chapter 8. Global Hot Cocoa Mix Regional Analysis and Outlook
8.1. Global Hot Cocoa Mix Revenue (USD Million) By Regions (2021- 2032)
8.2. North America Hot Cocoa Mix Revenue (USD Million) by Country (2021-2032)
8.2.1. United States Hot Cocoa Mix Regional Analysis and Outlook
8.2.2. Canada Hot Cocoa Mix Regional Analysis and Outlook
8.2.3. Mexico Hot Cocoa Mix Regional Analysis and Outlook
8.3. Europe Hot Cocoa Mix Revenue (USD Million), by Country (2021-2032)
8.3.1. Germany Hot Cocoa Mix Regional Analysis and Outlook
8.3.2. France Hot Cocoa Mix Regional Analysis and Outlook
8.3.3. United Kingdom Hot Cocoa Mix Regional Analysis and Outlook
8.3.4. Spain Hot Cocoa Mix Regional Analysis and Outlook
8.3.5. Italy Hot Cocoa Mix Regional Analysis and Outlook
8.3.6. Russia Hot Cocoa Mix Regional Analysis and Outlook
8.3.7. Rest of Europe Hot Cocoa Mix Regional Analysis and Outlook
8.4. Asia Pacific Hot Cocoa Mix Revenue (USD Million) by Country (2021-2032)
8.4.1. China Hot Cocoa Mix Regional Analysis and Outlook
8.4.2. Japan Hot Cocoa Mix Regional Analysis and Outlook
8.4.3. India Hot Cocoa Mix Regional Analysis and Outlook
8.4.4. South Korea Hot Cocoa Mix Regional Analysis and Outlook
8.4.5. Australia Hot Cocoa Mix Regional Analysis and Outlook
8.4.6. South East Asia Hot Cocoa Mix Regional Analysis and Outlook
8.4.7. Rest of Asia Pacific Hot Cocoa Mix Regional Analysis and Outlook
8.5. South America Hot Cocoa Mix Revenue (USD Million), by Country (2021-2032)
8.5.1. Brazil Hot Cocoa Mix Regional Analysis and Outlook
8.5.2. Argentina Hot Cocoa Mix Regional Analysis and Outlook
8.5.3. Rest of South America Hot Cocoa Mix Regional Analysis and Outlook
8.6. Middle East and Africa Hot Cocoa Mix Revenue (USD Million) by Country (2021-2032)
8.6.1. Middle East Hot Cocoa Mix Regional Analysis and Outlook
8.6.2. Africa Hot Cocoa Mix Regional Analysis and Outlook
Chapter 9. North America Hot Cocoa Mix Analysis and Outlook
9.1. North America Hot Cocoa Mix Revenue (USD Million) by Segments (2021-2032)
9.1.1. North America Hot Cocoa Mix Revenue (USD Million) by Type (2021-2032)
9.1.2. North America Hot Cocoa Mix Revenue (USD Million) by Application (2021-2032)
9.1.3. North America Hot Cocoa Mix Revenue (USD Million) by Product (2021-2032)
By Type
Multi-Flavored Hot Cocoa
Plain Hot Cocoa
By Application
Hypermarket/Supermarket
Chocolate Shop
Online Retail
Others
Chapter 10. Europe Hot Cocoa Mix Analysis and Outlook
10.1. Europe Hot Cocoa Mix Revenue (USD Million), by Segments (USD Million) (2021-2032)
10.1.1. Europe Hot Cocoa Mix Revenue (USD Million) by Type (2021-2032)
10.1.2. Europe Hot Cocoa Mix Revenue (USD Million) by Application (2021-2032)
10.1.3. Europe Hot Cocoa Mix Revenue (USD Million) by Product (2021-2032)
By Type
Multi-Flavored Hot Cocoa
Plain Hot Cocoa
By Application
Hypermarket/Supermarket
Chocolate Shop
Online Retail
Others
Chapter 11. Asia Pacific Hot Cocoa Mix Analysis and Outlook
11.1. Asia Pacific Hot Cocoa Mix Revenue (USD Million), and Revenue (USD Million) by Segments (2021-2032)
11.1.1. Asia Pacific Hot Cocoa Mix Revenue (USD Million) by Type (2021-2032)
11.1.2. Asia Pacific Hot Cocoa Mix Revenue (USD Million) by Application (2021-2032)
11.1.3. Asia Pacific Hot Cocoa Mix Revenue (USD Million) by Product (2021-2032)
By Type
Multi-Flavored Hot Cocoa
Plain Hot Cocoa
By Application
Hypermarket/Supermarket
Chocolate Shop
Online Retail
Others
Chapter 12. South America Hot Cocoa Mix Analysis and Outlook
12.1. South America Hot Cocoa Mix Revenue (USD Million), by Segments (2021-2032)
12.1.1. South America Hot Cocoa Mix Revenue (USD Million) by Type (2021-2032)
12.1.2. South America Hot Cocoa Mix Revenue (USD Million) by Application (2021-2032)
12.1.3. South America Hot Cocoa Mix Revenue (USD Million) by Product (2021-2032)
By Type
Multi-Flavored Hot Cocoa
Plain Hot Cocoa
By Application
Hypermarket/Supermarket
Chocolate Shop
Online Retail
Others
Chapter 13. Middle East and Africa Hot Cocoa Mix Analysis and Outlook
13.1. Middle East and Africa Hot Cocoa Mix Revenue (USD Million), by Segments (2021-2032)
13.1.1. Middle East and Africa Hot Cocoa Mix Revenue (USD Million) by Type (2021-2032)
13.1.2. Middle East and Africa Hot Cocoa Mix Revenue (USD Million) by Application (2021-2032)
13.1.3. Middle East and Africa Hot Cocoa Mix Revenue (USD Million) by Product (2021-2032)
By Type
Multi-Flavored Hot Cocoa
Plain Hot Cocoa
By Application
Hypermarket/Supermarket
Chocolate Shop
Online Retail
Others
Chapter 14. Hot Cocoa Mix Company Profiles
14.1 Business Overview
14.2 Product Profiles
14.3 SWOT Profiles
14.5 Recent Developments
14.6 Financial Profile
List of Companies
Castle Kitchen
Conagra Brands, Inc.
Ghirardelli Chocolate Company
Godiva
Lindt & Sprungli
Nestlé SA
Starbucks Corporation
Stephen's Gourmet
Stonewall Kitchen
The Hershey Company
Trader Joe’s
Unilever Plc
Venchi
Williams-Sonoma
15. Methodology and Data Sources
15.1 Customization Offerings
15.2 Subscription Services
15.3 Related Reports
15.4 Publisher Expertise
LIST OF TABLES
Table 1 Market Segmentation Analysis
Table 2 Global Hot Cocoa Mix Market Share of Leading Companies, 2023
Table 3 Product Offerings of Leading Companies
Table 4 Low Growth Scenario Forecasts
Table 5 Reference Case Growth Scenario
Table 6 High Growth Case Scenario
Table 7 Global Hot Cocoa Mix Revenue (USD Million) And CAGR (%) By Type (2021-2032)
Table 8 Global Hot Cocoa Mix Revenue (USD Million) And CAGR (%) By Application (2021-2032)
Table 9 Global Hot Cocoa Mix Revenue (USD Million) And CAGR (%) By Product (2021-2032)
Table 10 Global Hot Cocoa Mix Market Revenue (USD Million) By Regions (2021-2032)
Table 11 Global Hot Cocoa Mix Market Share (%) By Regions (2021-2032)
Table 12 North America Hot Cocoa Mix Revenue (USD Million) By Country (2021-2032)
Table 13 Europe Hot Cocoa Mix Revenue (USD Million) By Country (2021-2032)
Table 14 Asia Pacific Hot Cocoa Mix Revenue (USD Million) By Country (2021-2032)
Table 15 South America Hot Cocoa Mix Revenue (USD Million) By Country (2021-2032)
Table 16 Middle East and Africa Hot Cocoa Mix Revenue (USD Million) By Region (2021-2032)
Table 17 North America Hot Cocoa Mix Revenue (USD Million) By Type (2021-2032)
Table 18 North America Hot Cocoa Mix Revenue (USD Million) By Application (2021-2032)
Table 19 North America Hot Cocoa Mix Revenue (USD Million) By Product (2021-2032)
Table 20 Europe Hot Cocoa Mix Revenue (USD Million) By Type (2021-2032)
Table 21 Europe Hot Cocoa Mix Revenue (USD Million) By Application (2021-2032)
Table 22 Europe Hot Cocoa Mix Revenue (USD Million) By Product (2021-2032)
Table 23 Asia Pacific Hot Cocoa Mix Revenue (USD Million) By Type (2021-2032)
Table 24 Asia Pacific Hot Cocoa Mix Revenue (USD Million) By Application (2021-2032)
Table 25 Asia Pacific Hot Cocoa Mix Revenue (USD Million) By Product (2021-2032)
Table 26 South America Hot Cocoa Mix Revenue (USD Million) By Type (2021-2032)
Table 27 South America Hot Cocoa Mix Revenue (USD Million) By Application (2021-2032)
Table 28 South America Hot Cocoa Mix Revenue (USD Million) By Product (2021-2032)
Table 29 Middle East and Africa Hot Cocoa Mix Revenue (USD Million) By Type (2021-2032)
Table 30 Middle East and Africa Hot Cocoa Mix Revenue (USD Million) By Application (2021-2032)
Table 31 Middle East and Africa Hot Cocoa Mix Revenue (USD Million) By Product (2021-2032)
LIST OF FIGURES
Figure 1. Market Scope
Figure 2. Pricing Forecasts Per Unit, 2023- 2032
Figure 3. Porter’s Five Forces
Figure 4. Global Hot Cocoa Mix Market Revenue (USD Million) By Regions (2021-2032)
Figure 5. Global Hot Cocoa Mix Market Share (%) By Regions (2023)
Figure 6. North America Hot Cocoa Mix Revenue (USD Million) By Country (2021-2032)
Figure 7. United States Hot Cocoa Mix Revenue (USD Million) By Country (2021-2032)
Figure 8. Canada Hot Cocoa Mix Revenue (USD Million) By Country (2021-2032)
Figure 9. Mexico Hot Cocoa Mix Revenue (USD Million) By Country (2021-2032)
Figure 10. Europe Hot Cocoa Mix Revenue (USD Million) By Country (2021-2032)
Figure 11. Germany Hot Cocoa Mix Revenue (USD Million) By Country (2021-2032)
Figure 12. France Hot Cocoa Mix Revenue (USD Million) By Country (2021-2032)
Figure 13. United Kingdom Hot Cocoa Mix Revenue (USD Million) By Country (2021-2032)
Figure 14. Spain Hot Cocoa Mix Revenue (USD Million) By Country (2021-2032)
Figure 15. Italy Hot Cocoa Mix Revenue (USD Million) By Country (2021-2032)
Figure 16. Russia Hot Cocoa Mix Revenue (USD Million) By Country (2021-2032)
Figure 17. Rest of Europe Hot Cocoa Mix Revenue (USD Million) By Country (2021-2032)
Figure 11. Asia Pacific Hot Cocoa Mix Revenue (USD Million) By Country (2021-2032)
Figure 12. China Hot Cocoa Mix Revenue (USD Million) By Country (2021-2032)
Figure 13. Japan Hot Cocoa Mix Revenue (USD Million) By Country (2021-2032)
Figure 14. India Hot Cocoa Mix Revenue (USD Million) By Country (2021-2032)
Figure 15. South Korea Hot Cocoa Mix Revenue (USD Million) By Country (2021-2032)
Figure 16. Australia Hot Cocoa Mix Revenue (USD Million) By Country (2021-2032)
Figure 17. South East Asia Hot Cocoa Mix Revenue (USD Million) By Country (2021-2032)
Figure 18. South America Hot Cocoa Mix Revenue (USD Million) By Country (2021-2032)
Figure 19. Brazil Hot Cocoa Mix Revenue (USD Million) By Country (2021-2032)
Figure 20. Argentina Hot Cocoa Mix Revenue (USD Million) By Country (2021-2032)
Figure 21. Rest of Asia Pacific Hot Cocoa Mix Revenue (USD Million) By Country (2021-2032)
Figure 22. Middle East and Africa Hot Cocoa Mix Revenue (USD Million) By Region (2021-2032)
Figure 23. Saudi Arabia Hot Cocoa Mix Revenue (USD Million) By Region (2021-2032)
Figure 24. The UAE Hot Cocoa Mix Revenue (USD Million) By Region (2021-2032)
Figure 25. Rest of Middle East Hot Cocoa Mix Revenue (USD Million) By Region (2021-2032)
Figure 26. South Africa Hot Cocoa Mix Revenue (USD Million) By Region (2021-2032)
Figure 27. Africa Hot Cocoa Mix Revenue (USD Million) By Region (2021-2032)
Figure 28. North America Hot Cocoa Mix Revenue (USD Million) By Type (2021-2032)
Figure 29. North America Hot Cocoa Mix Revenue (USD Million) By Application (2021-2032)
Figure 30. North America Hot Cocoa Mix Revenue (USD Million) By Product (2021-2032)
Figure 31. Europe Hot Cocoa Mix Revenue (USD Million) By Type (2021-2032)
Figure 32. Europe Hot Cocoa Mix Revenue (USD Million) By Application (2021-2032)
Figure 33. Europe Hot Cocoa Mix Revenue (USD Million) By Product (2021-2032)
Figure 34. Asia Pacific Hot Cocoa Mix Revenue (USD Million) By Type (2021-2032)
Figure 35. Asia Pacific Hot Cocoa Mix Revenue (USD Million) By Application (2021-2032)
Figure 36. Asia Pacific Hot Cocoa Mix Revenue (USD Million) By Product (2021-2032)
Figure 37. South America Hot Cocoa Mix Revenue (USD Million) By Type (2021-2032)
Figure 38. South America Hot Cocoa Mix Revenue (USD Million) By Application (2021-2032)
Figure 39. South America Hot Cocoa Mix Revenue (USD Million) By Product (2021-2032)
Figure 40. Middle East and Africa Hot Cocoa Mix Revenue (USD Million) By Type (2021-2032)
Figure 41. Middle East and Africa Hot Cocoa Mix Revenue (USD Million) By Application (2021-2032)
Figure 42. Middle East and Africa Hot Cocoa Mix Revenue (USD Million) By Product (2021-2032)
By Type
Multi-Flavored Hot Cocoa
Plain Hot Cocoa
By Application
Hypermarket/Supermarket
Chocolate Shop
Online Retail
Others
Countries Analyzed
North America (US, Canada, Mexico)
Europe (Germany, UK, France, Spain, Italy, Russia, Rest of Europe)
Asia Pacific (China, India, Japan, South Korea, Australia, South East Asia, Rest of Asia)
South America (Brazil, Argentina, Rest of South America)
Middle East and Africa (Saudi Arabia, UAE, Rest of Middle East, South Africa, Egypt, Rest of Africa)
