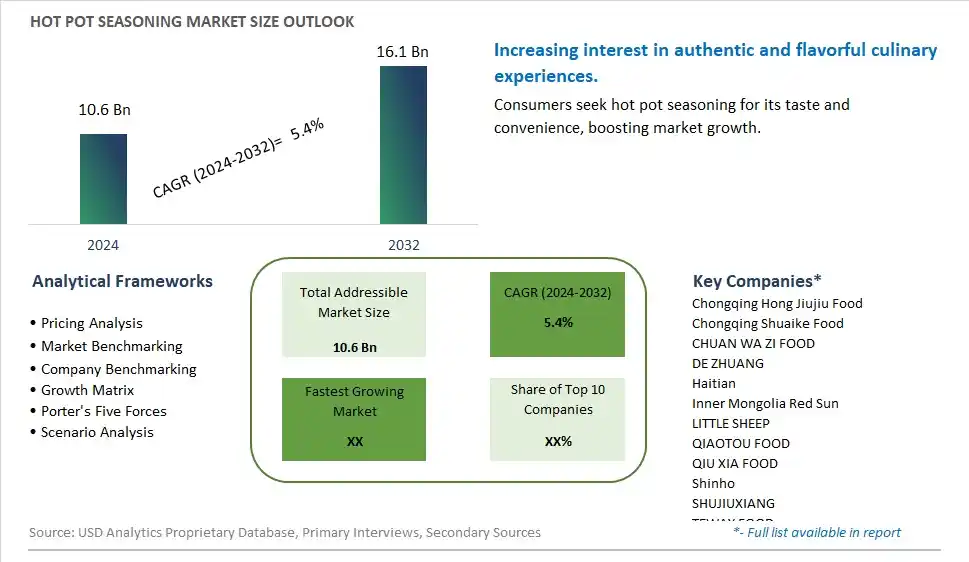
Global Hot Pot Seasoning Market Size is valued at $10.6 Billion in 2024 and is forecast to register a growth rate (CAGR) of 5.4% to reach $16.1 Billion by 2032.
The global Hot Pot Seasoning Market Comprehensive Study analyzes and forecasts the market size across 6 regions and 24 countries for diverse segments -By Type (Mushroom Soup, Spicy, Tomato, Others), By Application (Hot Pot Restaurant, Home Usage, Others)
An Introduction to Hot Pot Seasoning Market
The hot pot seasoning market in 2024 is expanding rapidly, driven by the growing popularity of hot pot dining globally. Consumers are seeking authentic, flavorful seasonings that replicate traditional Asian culinary experiences. Manufacturers are responding with a variety of spice blends, including options catering to different heat levels and dietary preferences. The market benefits from the rising trend of home-cooked meals and the increasing availability of hot pot seasoning kits in retail and online stores. Innovations in packaging and preservation are also enhancing product convenience and shelf life.
Hot Pot Seasoning Competitive Landscape
The market report analyses the leading companies in the industry including Chongqing Hong Jiujiu Food, Chongqing Shuaike Food, CHUAN WA ZI FOOD, DE ZHUANG, Haitian, Inner Mongolia Red Sun, LITTLE SHEEP, QIAOTOU FOOD, QIU XIA FOOD, Shinho, SHUJIUXIANG, TEWAY FOOD, YANGMING FOOD, YiHai International, ZHOU JUN JI, and Others.
Hot Pot Seasoning Market Dynamics
Hot Pot Seasoning Market Trend: Increasing Popularity of Global Cuisine
The most prominent trend in the Hot Pot Seasoning Market is the increasing popularity of global cuisine. Hot pot, a traditional Asian dish, is gaining international appeal as consumers explore diverse culinary experiences. The demand for authentic hot pot seasoning is rising as more people experiment with preparing hot pot at home and in restaurants. This trend is driven by the growing interest in ethnic foods and the desire to replicate restaurant-quality meals at home. As hot pot continues to gain popularity worldwide, the market for hot pot seasoning is expanding.
Hot Pot Seasoning Market Driver: Rise in At-Home Cooking and Dining Experiences
A key driver for the Hot Pot Seasoning Market is the rise in at-home cooking and dining experiences. The COVID-19 pandemic has significantly influenced consumer behavior, leading to an increase in home cooking. Hot pot, with its interactive and communal dining experience, has become a popular choice for home-cooked meals. The convenience and versatility of hot pot seasoning, which simplifies the preparation process, are driving its demand. As more consumers embrace at-home dining experiences, the hot pot seasoning market is expected to grow.
Hot Pot Seasoning Market Opportunity: Product Innovation and Customization
One potential opportunity in the Hot Pot Seasoning Market lies in product innovation and customization. Consumers are seeking unique and personalized flavor experiences in their meals. By offering a variety of seasoning blends and allowing customization, manufacturers can cater to diverse taste preferences. Additionally, introducing new flavors and combinations that appeal to health-conscious consumers, such as low-sodium or organic options, can attract a broader audience. This focus on innovation and customization can differentiate products in the competitive market and drive growth.
Hot Pot Seasoning Market Share Analysis: Spicy Hot Pot Seasoning segment generated the highest revenue share in the industry
Among the types of hot pot seasoning, spicy hot pot seasoning emerges as the largest segment in the market. Spicy hot pot seasoning is favored for its bold and piquant flavors that add a fiery kick to the hot pot experience. It includes a blend of spices, chili peppers, Sichuan peppercorns, and other seasonings that create a distinctive spicy taste profile. This type of seasoning appeals to consumers who enjoy the intense flavors and heat associated with traditional Sichuan-style hot pot, which has gained popularity globally for its rich broth and customizable ingredients. The popularity of spicy hot pot seasoning extends beyond Asian cuisine enthusiasts to broader consumer demographics seeking adventurous dining experiences and robust flavors in their meals.
Hot Pot Seasoning Market Share Analysis: Home Usage is the fastest growing segment over the forecast period to 2032
The fastest growing segment in the Hot Pot Seasoning Market by application is home usage. This growth is driven by increasing consumer interest in recreating restaurant-style hot pot experiences at home. Home usage of hot pot seasoning allows consumers to customize their hot pot broths and ingredients according to personal preferences, dietary restrictions, and family traditions. The convenience of preparing hot pot meals at home, combined with the versatility to experiment with different flavors and ingredients, has contributed to the rising demand for hot pot seasoning among home cooks. Manufacturers are responding by introducing convenient and easy-to-use packaging formats that cater specifically to the needs of home consumers, enhancing accessibility and ensuring a satisfying hot pot dining experience within the comfort of home settings. As consumer awareness and adoption of hot pot seasoning for home usage continue to grow, this segment is poised to expand significantly through 2032, driven by ongoing culinary trends and the desire for flavorful dining options at home.
Hot Pot Seasoning Market Segmentation
By Type
Mushroom Soup
Spicy
Tomato
Others
By Application
Hot Pot Restaurant
Home Usage
Others
Countries Analyzed
North America (US, Canada, Mexico)
Europe (Germany, UK, France, Spain, Italy, Russia, Rest of Europe)
Asia Pacific (China, India, Japan, South Korea, Australia, South East Asia, Rest of Asia)
South America (Brazil, Argentina, Rest of South America)
Middle East and Africa (Saudi Arabia, UAE, Rest of Middle East, South Africa, Egypt, Rest of Africa)
Hot Pot Seasoning Companies Profiled in the Study
Chongqing Hong Jiujiu Food
Chongqing Shuaike Food
CHUAN WA ZI FOOD
DE ZHUANG
Haitian
Inner Mongolia Red Sun
LITTLE SHEEP
QIAOTOU FOOD
QIU XIA FOOD
Shinho
SHUJIUXIANG
TEWAY FOOD
YANGMING FOOD
YiHai International
ZHOU JUN JI
*- List Not Exhaustive
Chapter 1. TABLE OF CONTENTS
Chapter 2. Introduction to Hot Pot Seasoning Market
2.1. Market Overview
2.2. Key Statistics and Report Highlights
2.3. Scope of the Comprehensive Study
2.3.1. Market Definition
2.3.2 Countries and Regions Covered
2.3.3 Research Objective
2.3.4 Units, Currency, and Conversions
2.3.5 Industry Value Chain
2.4. Key Market Segments
2.5. Key Companies
2.6. Study Period
Chapter 3. Strategic Analysis Review
3.1. Hot Pot Seasoning Pricing Analysis and Forecast
3.2. Porter’s Five Forces
3.3. Market Ecosystem
3.4. SWOT Analysis
3.5. Regulatory Scenario
3.3. Effects of Inflation, Russia-Ukraine War, moderating economic growth, and other macroeconomic factors
Chapter 4. Competitive Landscape
4.1. Market Share Analysis
4.1.1. Global Hot Pot Seasoning Market Share by Company, 2023
4.1.2. Product Offerings of Leading Hot Pot Seasoning Companies
4.2. Market Entropy
4.2.1. New Product Launches in the Industry
4.2.2. Mergers, Acquisitions, Joint ventures, and Partnerships
4.3. Key Strategies and Best Practices
Chapter 5. Global Market Projections: Best, Reference, and Low Case Scenarios
5.1. Growth Analysis- Case Scenario Definitions
5.2. Low Growth Case Scenario Forecasts
5.3. Reference Growth Case Scenario Forecasts
5.4. High Growth Case Scenario Forecasts
Chapter 6. Market Dynamics
6.1. Hot Pot Seasoning Market Drivers
6.2. Hot Pot Seasoning Market Challenges
6.6. Hot Pot Seasoning Market Opportunities
6.4. Hot Pot Seasoning Market Trends
Chapter 7. Global Hot Pot Seasoning Market Outlook Trends
7.1. Global Hot Pot Seasoning Revenue (USD Million) and CAGR (%) by Type (2021-2032)
7.2. Global Hot Pot Seasoning Revenue (USD Million) and CAGR (%) by Application (2021-2032)
7.3. Global Hot Pot Seasoning Revenue (USD Million) and CAGR (%) by Product (2021-2032)
By Type
Mushroom Soup
Spicy
Tomato
Others
By Application
Hot Pot Restaurant
Home Usage
Others
Chapter 8. Global Hot Pot Seasoning Regional Analysis and Outlook
8.1. Global Hot Pot Seasoning Revenue (USD Million) By Regions (2021- 2032)
8.2. North America Hot Pot Seasoning Revenue (USD Million) by Country (2021-2032)
8.2.1. United States Hot Pot Seasoning Regional Analysis and Outlook
8.2.2. Canada Hot Pot Seasoning Regional Analysis and Outlook
8.2.3. Mexico Hot Pot Seasoning Regional Analysis and Outlook
8.3. Europe Hot Pot Seasoning Revenue (USD Million), by Country (2021-2032)
8.3.1. Germany Hot Pot Seasoning Regional Analysis and Outlook
8.3.2. France Hot Pot Seasoning Regional Analysis and Outlook
8.3.3. United Kingdom Hot Pot Seasoning Regional Analysis and Outlook
8.3.4. Spain Hot Pot Seasoning Regional Analysis and Outlook
8.3.5. Italy Hot Pot Seasoning Regional Analysis and Outlook
8.3.6. Russia Hot Pot Seasoning Regional Analysis and Outlook
8.3.7. Rest of Europe Hot Pot Seasoning Regional Analysis and Outlook
8.4. Asia Pacific Hot Pot Seasoning Revenue (USD Million) by Country (2021-2032)
8.4.1. China Hot Pot Seasoning Regional Analysis and Outlook
8.4.2. Japan Hot Pot Seasoning Regional Analysis and Outlook
8.4.3. India Hot Pot Seasoning Regional Analysis and Outlook
8.4.4. South Korea Hot Pot Seasoning Regional Analysis and Outlook
8.4.5. Australia Hot Pot Seasoning Regional Analysis and Outlook
8.4.6. South East Asia Hot Pot Seasoning Regional Analysis and Outlook
8.4.7. Rest of Asia Pacific Hot Pot Seasoning Regional Analysis and Outlook
8.5. South America Hot Pot Seasoning Revenue (USD Million), by Country (2021-2032)
8.5.1. Brazil Hot Pot Seasoning Regional Analysis and Outlook
8.5.2. Argentina Hot Pot Seasoning Regional Analysis and Outlook
8.5.3. Rest of South America Hot Pot Seasoning Regional Analysis and Outlook
8.6. Middle East and Africa Hot Pot Seasoning Revenue (USD Million) by Country (2021-2032)
8.6.1. Middle East Hot Pot Seasoning Regional Analysis and Outlook
8.6.2. Africa Hot Pot Seasoning Regional Analysis and Outlook
Chapter 9. North America Hot Pot Seasoning Analysis and Outlook
9.1. North America Hot Pot Seasoning Revenue (USD Million) by Segments (2021-2032)
9.1.1. North America Hot Pot Seasoning Revenue (USD Million) by Type (2021-2032)
9.1.2. North America Hot Pot Seasoning Revenue (USD Million) by Application (2021-2032)
9.1.3. North America Hot Pot Seasoning Revenue (USD Million) by Product (2021-2032)
By Type
Mushroom Soup
Spicy
Tomato
Others
By Application
Hot Pot Restaurant
Home Usage
Others
Chapter 10. Europe Hot Pot Seasoning Analysis and Outlook
10.1. Europe Hot Pot Seasoning Revenue (USD Million), by Segments (USD Million) (2021-2032)
10.1.1. Europe Hot Pot Seasoning Revenue (USD Million) by Type (2021-2032)
10.1.2. Europe Hot Pot Seasoning Revenue (USD Million) by Application (2021-2032)
10.1.3. Europe Hot Pot Seasoning Revenue (USD Million) by Product (2021-2032)
By Type
Mushroom Soup
Spicy
Tomato
Others
By Application
Hot Pot Restaurant
Home Usage
Others
Chapter 11. Asia Pacific Hot Pot Seasoning Analysis and Outlook
11.1. Asia Pacific Hot Pot Seasoning Revenue (USD Million), and Revenue (USD Million) by Segments (2021-2032)
11.1.1. Asia Pacific Hot Pot Seasoning Revenue (USD Million) by Type (2021-2032)
11.1.2. Asia Pacific Hot Pot Seasoning Revenue (USD Million) by Application (2021-2032)
11.1.3. Asia Pacific Hot Pot Seasoning Revenue (USD Million) by Product (2021-2032)
By Type
Mushroom Soup
Spicy
Tomato
Others
By Application
Hot Pot Restaurant
Home Usage
Others
Chapter 12. South America Hot Pot Seasoning Analysis and Outlook
12.1. South America Hot Pot Seasoning Revenue (USD Million), by Segments (2021-2032)
12.1.1. South America Hot Pot Seasoning Revenue (USD Million) by Type (2021-2032)
12.1.2. South America Hot Pot Seasoning Revenue (USD Million) by Application (2021-2032)
12.1.3. South America Hot Pot Seasoning Revenue (USD Million) by Product (2021-2032)
By Type
Mushroom Soup
Spicy
Tomato
Others
By Application
Hot Pot Restaurant
Home Usage
Others
Chapter 13. Middle East and Africa Hot Pot Seasoning Analysis and Outlook
13.1. Middle East and Africa Hot Pot Seasoning Revenue (USD Million), by Segments (2021-2032)
13.1.1. Middle East and Africa Hot Pot Seasoning Revenue (USD Million) by Type (2021-2032)
13.1.2. Middle East and Africa Hot Pot Seasoning Revenue (USD Million) by Application (2021-2032)
13.1.3. Middle East and Africa Hot Pot Seasoning Revenue (USD Million) by Product (2021-2032)
By Type
Mushroom Soup
Spicy
Tomato
Others
By Application
Hot Pot Restaurant
Home Usage
Others
Chapter 14. Hot Pot Seasoning Company Profiles
14.1 Business Overview
14.2 Product Profiles
14.3 SWOT Profiles
14.5 Recent Developments
14.6 Financial Profile
List of Companies
Chongqing Hong Jiujiu Food
Chongqing Shuaike Food
CHUAN WA ZI FOOD
DE ZHUANG
Haitian
Inner Mongolia Red Sun
LITTLE SHEEP
QIAOTOU FOOD
QIU XIA FOOD
Shinho
SHUJIUXIANG
TEWAY FOOD
YANGMING FOOD
YiHai International
ZHOU JUN JI
15. Methodology and Data Sources
15.1 Customization Offerings
15.2 Subscription Services
15.3 Related Reports
15.4 Publisher Expertise
LIST OF TABLES
Table 1 Market Segmentation Analysis
Table 2 Global Hot Pot Seasoning Market Share of Leading Companies, 2023
Table 3 Product Offerings of Leading Companies
Table 4 Low Growth Scenario Forecasts
Table 5 Reference Case Growth Scenario
Table 6 High Growth Case Scenario
Table 7 Global Hot Pot Seasoning Revenue (USD Million) And CAGR (%) By Type (2021-2032)
Table 8 Global Hot Pot Seasoning Revenue (USD Million) And CAGR (%) By Application (2021-2032)
Table 9 Global Hot Pot Seasoning Revenue (USD Million) And CAGR (%) By Product (2021-2032)
Table 10 Global Hot Pot Seasoning Market Revenue (USD Million) By Regions (2021-2032)
Table 11 Global Hot Pot Seasoning Market Share (%) By Regions (2021-2032)
Table 12 North America Hot Pot Seasoning Revenue (USD Million) By Country (2021-2032)
Table 13 Europe Hot Pot Seasoning Revenue (USD Million) By Country (2021-2032)
Table 14 Asia Pacific Hot Pot Seasoning Revenue (USD Million) By Country (2021-2032)
Table 15 South America Hot Pot Seasoning Revenue (USD Million) By Country (2021-2032)
Table 16 Middle East and Africa Hot Pot Seasoning Revenue (USD Million) By Region (2021-2032)
Table 17 North America Hot Pot Seasoning Revenue (USD Million) By Type (2021-2032)
Table 18 North America Hot Pot Seasoning Revenue (USD Million) By Application (2021-2032)
Table 19 North America Hot Pot Seasoning Revenue (USD Million) By Product (2021-2032)
Table 20 Europe Hot Pot Seasoning Revenue (USD Million) By Type (2021-2032)
Table 21 Europe Hot Pot Seasoning Revenue (USD Million) By Application (2021-2032)
Table 22 Europe Hot Pot Seasoning Revenue (USD Million) By Product (2021-2032)
Table 23 Asia Pacific Hot Pot Seasoning Revenue (USD Million) By Type (2021-2032)
Table 24 Asia Pacific Hot Pot Seasoning Revenue (USD Million) By Application (2021-2032)
Table 25 Asia Pacific Hot Pot Seasoning Revenue (USD Million) By Product (2021-2032)
Table 26 South America Hot Pot Seasoning Revenue (USD Million) By Type (2021-2032)
Table 27 South America Hot Pot Seasoning Revenue (USD Million) By Application (2021-2032)
Table 28 South America Hot Pot Seasoning Revenue (USD Million) By Product (2021-2032)
Table 29 Middle East and Africa Hot Pot Seasoning Revenue (USD Million) By Type (2021-2032)
Table 30 Middle East and Africa Hot Pot Seasoning Revenue (USD Million) By Application (2021-2032)
Table 31 Middle East and Africa Hot Pot Seasoning Revenue (USD Million) By Product (2021-2032)
LIST OF FIGURES
Figure 1. Market Scope
Figure 2. Pricing Forecasts Per Unit, 2023- 2032
Figure 3. Porter’s Five Forces
Figure 4. Global Hot Pot Seasoning Market Revenue (USD Million) By Regions (2021-2032)
Figure 5. Global Hot Pot Seasoning Market Share (%) By Regions (2023)
Figure 6. North America Hot Pot Seasoning Revenue (USD Million) By Country (2021-2032)
Figure 7. United States Hot Pot Seasoning Revenue (USD Million) By Country (2021-2032)
Figure 8. Canada Hot Pot Seasoning Revenue (USD Million) By Country (2021-2032)
Figure 9. Mexico Hot Pot Seasoning Revenue (USD Million) By Country (2021-2032)
Figure 10. Europe Hot Pot Seasoning Revenue (USD Million) By Country (2021-2032)
Figure 11. Germany Hot Pot Seasoning Revenue (USD Million) By Country (2021-2032)
Figure 12. France Hot Pot Seasoning Revenue (USD Million) By Country (2021-2032)
Figure 13. United Kingdom Hot Pot Seasoning Revenue (USD Million) By Country (2021-2032)
Figure 14. Spain Hot Pot Seasoning Revenue (USD Million) By Country (2021-2032)
Figure 15. Italy Hot Pot Seasoning Revenue (USD Million) By Country (2021-2032)
Figure 16. Russia Hot Pot Seasoning Revenue (USD Million) By Country (2021-2032)
Figure 17. Rest of Europe Hot Pot Seasoning Revenue (USD Million) By Country (2021-2032)
Figure 11. Asia Pacific Hot Pot Seasoning Revenue (USD Million) By Country (2021-2032)
Figure 12. China Hot Pot Seasoning Revenue (USD Million) By Country (2021-2032)
Figure 13. Japan Hot Pot Seasoning Revenue (USD Million) By Country (2021-2032)
Figure 14. India Hot Pot Seasoning Revenue (USD Million) By Country (2021-2032)
Figure 15. South Korea Hot Pot Seasoning Revenue (USD Million) By Country (2021-2032)
Figure 16. Australia Hot Pot Seasoning Revenue (USD Million) By Country (2021-2032)
Figure 17. South East Asia Hot Pot Seasoning Revenue (USD Million) By Country (2021-2032)
Figure 18. South America Hot Pot Seasoning Revenue (USD Million) By Country (2021-2032)
Figure 19. Brazil Hot Pot Seasoning Revenue (USD Million) By Country (2021-2032)
Figure 20. Argentina Hot Pot Seasoning Revenue (USD Million) By Country (2021-2032)
Figure 21. Rest of Asia Pacific Hot Pot Seasoning Revenue (USD Million) By Country (2021-2032)
Figure 22. Middle East and Africa Hot Pot Seasoning Revenue (USD Million) By Region (2021-2032)
Figure 23. Saudi Arabia Hot Pot Seasoning Revenue (USD Million) By Region (2021-2032)
Figure 24. The UAE Hot Pot Seasoning Revenue (USD Million) By Region (2021-2032)
Figure 25. Rest of Middle East Hot Pot Seasoning Revenue (USD Million) By Region (2021-2032)
Figure 26. South Africa Hot Pot Seasoning Revenue (USD Million) By Region (2021-2032)
Figure 27. Africa Hot Pot Seasoning Revenue (USD Million) By Region (2021-2032)
Figure 28. North America Hot Pot Seasoning Revenue (USD Million) By Type (2021-2032)
Figure 29. North America Hot Pot Seasoning Revenue (USD Million) By Application (2021-2032)
Figure 30. North America Hot Pot Seasoning Revenue (USD Million) By Product (2021-2032)
Figure 31. Europe Hot Pot Seasoning Revenue (USD Million) By Type (2021-2032)
Figure 32. Europe Hot Pot Seasoning Revenue (USD Million) By Application (2021-2032)
Figure 33. Europe Hot Pot Seasoning Revenue (USD Million) By Product (2021-2032)
Figure 34. Asia Pacific Hot Pot Seasoning Revenue (USD Million) By Type (2021-2032)
Figure 35. Asia Pacific Hot Pot Seasoning Revenue (USD Million) By Application (2021-2032)
Figure 36. Asia Pacific Hot Pot Seasoning Revenue (USD Million) By Product (2021-2032)
Figure 37. South America Hot Pot Seasoning Revenue (USD Million) By Type (2021-2032)
Figure 38. South America Hot Pot Seasoning Revenue (USD Million) By Application (2021-2032)
Figure 39. South America Hot Pot Seasoning Revenue (USD Million) By Product (2021-2032)
Figure 40. Middle East and Africa Hot Pot Seasoning Revenue (USD Million) By Type (2021-2032)
Figure 41. Middle East and Africa Hot Pot Seasoning Revenue (USD Million) By Application (2021-2032)
Figure 42. Middle East and Africa Hot Pot Seasoning Revenue (USD Million) By Product (2021-2032)
By Type
Mushroom Soup
Spicy
Tomato
Others
By Application
Hot Pot Restaurant
Home Usage
Others
Countries Analyzed
North America (US, Canada, Mexico)
Europe (Germany, UK, France, Spain, Italy, Russia, Rest of Europe)
Asia Pacific (China, India, Japan, South Korea, Australia, South East Asia, Rest of Asia)
South America (Brazil, Argentina, Rest of South America)
Middle East and Africa (Saudi Arabia, UAE, Rest of Middle East, South Africa, Egypt, Rest of Africa)
