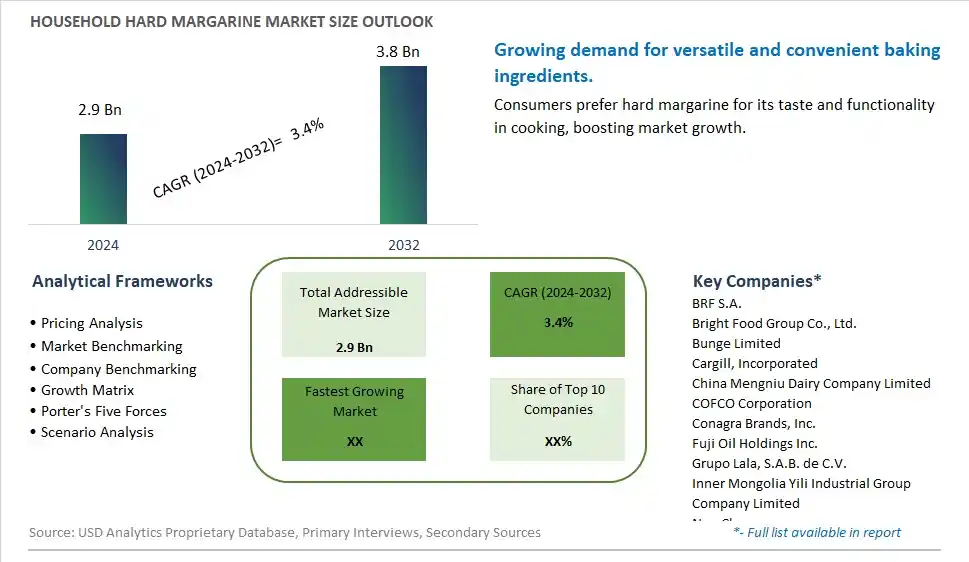
Global Household Hard Margarine Market Size is valued at $2.9 Billion in 2024 and is forecast to register a growth rate (CAGR) of 3.4% to reach $3.8 Billion by 2032.
The global Household Hard Margarine Market Comprehensive Study analyzes and forecasts the market size across 6 regions and 24 countries for diverse segments -By Product (Total Fats ≥ 70%, Total Fats < 70%), By Application (Online Sales, Offline Sales)
An Introduction to Household Hard Margarine Market
In 2024, the household hard margarine market is witnessing renewed interest, driven by its versatility and affordability as a cooking and baking ingredient. Consumers are increasingly looking for trans-fat-free and healthier alternatives, prompting manufacturers to innovate with formulations that use healthier oils and fortify products with vitamins. The market is also benefiting from the trend towards plant-based diets, with an increasing number of vegan and dairy-free margarine options available. Sustainable sourcing and eco-friendly packaging are also influencing consumer preferences in The market.
Household Hard Margarine Competitive Landscape
The market report analyses the leading companies in the industry including BRF S.A., Bright Food Group Co., Ltd., Bunge Limited, Cargill, Incorporated, China Mengniu Dairy Company Limited, COFCO Corporation, Conagra Brands, Inc., Fuji Oil Holdings Inc., Grupo Lala, S.A.B. de C.V., Inner Mongolia Yili Industrial Group Company Limited, NamChow, NMGK Group, Saputo Dairy UK Ltd., Unilever PLC, Uni-President Enterprises Corporation, Wilmar International Limited, Yildiz Holding A.S., Zydus Wellness Limited, and Others.
Household Hard Margarine Market Dynamics
Household Hard Margarine Market Trend: Shift Towards Trans-Fat-Free and Healthier Alternatives
The most prominent trend in the Household Hard Margarine Market is the shift towards trans-fat-free and healthier alternatives. With increasing health concerns related to trans fats, consumers are actively seeking margarine products that offer health benefits without compromising on quality and performance. Hard margarine, traditionally used in baking and cooking, is being reformulated to eliminate trans fats and include healthier ingredients such as plant-based oils. This trend is driving manufacturers to innovate and offer hard margarine products that cater to the health-conscious consumer Market
Household Hard Margarine Market Driver: Growing Demand for Baking Ingredients
A key driver for the Household Hard Margarine Market is the growing demand for baking ingredients. As more consumers engage in home baking, there is a rising need for high-quality margarine that provides the desired texture, flavor, and consistency in baked goods. Hard margarine, known for its stability and versatility, is a preferred choice for a variety of baking applications. The increasing popularity of home baking and the demand for reliable baking ingredients are significantly driving the market for household hard margarine.
Household Hard Margarine Market Opportunity: Introduction of Plant-Based and Vegan Varieties
One potential opportunity in the Household Hard Margarine Market lies in the introduction of plant-based and vegan varieties. As the demand for plant-based foods continues to grow, there is an increasing need for margarine products that cater to vegan and vegetarian consumers. By developing plant-based hard margarine that offers the same functionality and taste as traditional margarine, manufacturers can tap into the expanding market for vegan baking ingredients. This focus on plant-based innovation can attract a broader consumer base and drive market growth.
Household Hard Margarine Market Share Analysis: Total Fats ≥ 70% segment generated the highest revenue share in the industry
The largest segment in the Household Hard Margarine Market by product type is margarines with total fats ≥ 70%. These margarines are preferred for their higher fat content, which contributes to a richer texture and enhanced flavor profile in various culinary applications. Household consumers often choose margarines with higher fat content for baking, cooking, and spreading purposes, as they provide better consistency and mouthfeel compared to lower fat alternatives. Margarines with total fats ≥ 70% are versatile and commonly used in households for preparing pastries, cakes, cookies, and other baked goods where texture and taste enhancement are crucial factors.
Household Hard Margarine Market Share Analysis: Online Sales is the fastest growing segment over the forecast period to 2032
The fastest growing segment in the Household Hard Margarine Market by application is online sales. With the increasing digitalization of retail and consumer behavior shifting towards e-commerce, online sales of household hard margarine have seen significant growth. Online platforms offer convenience, accessibility, and a wide selection of products to consumers looking to purchase household staples, including margarine, from the comfort of their homes. Factors such as competitive pricing, promotional offers, and the ability to compare products easily contribute to the rising popularity of online channels for purchasing hard margarine. As more consumers embrace online shopping for groceries and cooking essentials, the trend towards online sales of household hard margarine is expected to continue growing rapidly through 2032.
Household Hard Margarine Market Segmentation
By Product
Total Fats ≥ 70%
Total Fats < 70%
By Application
Online Sales
Offline Sales
Countries Analyzed
North America (US, Canada, Mexico)
Europe (Germany, UK, France, Spain, Italy, Russia, Rest of Europe)
Asia Pacific (China, India, Japan, South Korea, Australia, South East Asia, Rest of Asia)
South America (Brazil, Argentina, Rest of South America)
Middle East and Africa (Saudi Arabia, UAE, Rest of Middle East, South Africa, Egypt, Rest of Africa)
Household Hard Margarine Companies Profiled in the Study
BRF S.A.
Bright Food Group Co., Ltd.
Bunge Limited
Cargill, Incorporated
China Mengniu Dairy Company Limited
COFCO Corporation
Conagra Brands, Inc.
Fuji Oil Holdings Inc.
Grupo Lala, S.A.B. de C.V.
Inner Mongolia Yili Industrial Group Company Limited
NamChow
NMGK Group
Saputo Dairy UK Ltd.
Unilever PLC
Uni-President Enterprises Corporation
Wilmar International Limited
Yildiz Holding A.S.
Zydus Wellness Limited
*- List Not Exhaustive
Chapter 1. TABLE OF CONTENTS
Chapter 2. Introduction to Household Hard Margarine Market
2.1. Market Overview
2.2. Key Statistics and Report Highlights
2.3. Scope of the Comprehensive Study
2.3.1. Market Definition
2.3.2 Countries and Regions Covered
2.3.3 Research Objective
2.3.4 Units, Currency, and Conversions
2.3.5 Industry Value Chain
2.4. Key Market Segments
2.5. Key Companies
2.6. Study Period
Chapter 3. Strategic Analysis Review
3.1. Household Hard Margarine Pricing Analysis and Forecast
3.2. Porter’s Five Forces
3.3. Market Ecosystem
3.4. SWOT Analysis
3.5. Regulatory Scenario
3.3. Effects of Inflation, Russia-Ukraine War, moderating economic growth, and other macroeconomic factors
Chapter 4. Competitive Landscape
4.1. Market Share Analysis
4.1.1. Global Household Hard Margarine Market Share by Company, 2023
4.1.2. Product Offerings of Leading Household Hard Margarine Companies
4.2. Market Entropy
4.2.1. New Product Launches in the Industry
4.2.2. Mergers, Acquisitions, Joint ventures, and Partnerships
4.3. Key Strategies and Best Practices
Chapter 5. Global Market Projections: Best, Reference, and Low Case Scenarios
5.1. Growth Analysis- Case Scenario Definitions
5.2. Low Growth Case Scenario Forecasts
5.3. Reference Growth Case Scenario Forecasts
5.4. High Growth Case Scenario Forecasts
Chapter 6. Market Dynamics
6.1. Household Hard Margarine Market Drivers
6.2. Household Hard Margarine Market Challenges
6.6. Household Hard Margarine Market Opportunities
6.4. Household Hard Margarine Market Trends
Chapter 7. Global Household Hard Margarine Market Outlook Trends
7.1. Global Household Hard Margarine Revenue (USD Million) and CAGR (%) by Type (2021-2032)
7.2. Global Household Hard Margarine Revenue (USD Million) and CAGR (%) by Application (2021-2032)
7.3. Global Household Hard Margarine Revenue (USD Million) and CAGR (%) by Product (2021-2032)
By Product
Total Fats ≥ 70%
Total Fats < 70%
By Application
Online Sales
Offline Sales
Chapter 8. Global Household Hard Margarine Regional Analysis and Outlook
8.1. Global Household Hard Margarine Revenue (USD Million) By Regions (2021- 2032)
8.2. North America Household Hard Margarine Revenue (USD Million) by Country (2021-2032)
8.2.1. United States Household Hard Margarine Regional Analysis and Outlook
8.2.2. Canada Household Hard Margarine Regional Analysis and Outlook
8.2.3. Mexico Household Hard Margarine Regional Analysis and Outlook
8.3. Europe Household Hard Margarine Revenue (USD Million), by Country (2021-2032)
8.3.1. Germany Household Hard Margarine Regional Analysis and Outlook
8.3.2. France Household Hard Margarine Regional Analysis and Outlook
8.3.3. United Kingdom Household Hard Margarine Regional Analysis and Outlook
8.3.4. Spain Household Hard Margarine Regional Analysis and Outlook
8.3.5. Italy Household Hard Margarine Regional Analysis and Outlook
8.3.6. Russia Household Hard Margarine Regional Analysis and Outlook
8.3.7. Rest of Europe Household Hard Margarine Regional Analysis and Outlook
8.4. Asia Pacific Household Hard Margarine Revenue (USD Million) by Country (2021-2032)
8.4.1. China Household Hard Margarine Regional Analysis and Outlook
8.4.2. Japan Household Hard Margarine Regional Analysis and Outlook
8.4.3. India Household Hard Margarine Regional Analysis and Outlook
8.4.4. South Korea Household Hard Margarine Regional Analysis and Outlook
8.4.5. Australia Household Hard Margarine Regional Analysis and Outlook
8.4.6. South East Asia Household Hard Margarine Regional Analysis and Outlook
8.4.7. Rest of Asia Pacific Household Hard Margarine Regional Analysis and Outlook
8.5. South America Household Hard Margarine Revenue (USD Million), by Country (2021-2032)
8.5.1. Brazil Household Hard Margarine Regional Analysis and Outlook
8.5.2. Argentina Household Hard Margarine Regional Analysis and Outlook
8.5.3. Rest of South America Household Hard Margarine Regional Analysis and Outlook
8.6. Middle East and Africa Household Hard Margarine Revenue (USD Million) by Country (2021-2032)
8.6.1. Middle East Household Hard Margarine Regional Analysis and Outlook
8.6.2. Africa Household Hard Margarine Regional Analysis and Outlook
Chapter 9. North America Household Hard Margarine Analysis and Outlook
9.1. North America Household Hard Margarine Revenue (USD Million) by Segments (2021-2032)
9.1.1. North America Household Hard Margarine Revenue (USD Million) by Type (2021-2032)
9.1.2. North America Household Hard Margarine Revenue (USD Million) by Application (2021-2032)
9.1.3. North America Household Hard Margarine Revenue (USD Million) by Product (2021-2032)
By Product
Total Fats ≥ 70%
Total Fats < 70%
By Application
Online Sales
Offline Sales
Chapter 10. Europe Household Hard Margarine Analysis and Outlook
10.1. Europe Household Hard Margarine Revenue (USD Million), by Segments (USD Million) (2021-2032)
10.1.1. Europe Household Hard Margarine Revenue (USD Million) by Type (2021-2032)
10.1.2. Europe Household Hard Margarine Revenue (USD Million) by Application (2021-2032)
10.1.3. Europe Household Hard Margarine Revenue (USD Million) by Product (2021-2032)
By Product
Total Fats ≥ 70%
Total Fats < 70%
By Application
Online Sales
Offline Sales
Chapter 11. Asia Pacific Household Hard Margarine Analysis and Outlook
11.1. Asia Pacific Household Hard Margarine Revenue (USD Million), and Revenue (USD Million) by Segments (2021-2032)
11.1.1. Asia Pacific Household Hard Margarine Revenue (USD Million) by Type (2021-2032)
11.1.2. Asia Pacific Household Hard Margarine Revenue (USD Million) by Application (2021-2032)
11.1.3. Asia Pacific Household Hard Margarine Revenue (USD Million) by Product (2021-2032)
By Product
Total Fats ≥ 70%
Total Fats < 70%
By Application
Online Sales
Offline Sales
Chapter 12. South America Household Hard Margarine Analysis and Outlook
12.1. South America Household Hard Margarine Revenue (USD Million), by Segments (2021-2032)
12.1.1. South America Household Hard Margarine Revenue (USD Million) by Type (2021-2032)
12.1.2. South America Household Hard Margarine Revenue (USD Million) by Application (2021-2032)
12.1.3. South America Household Hard Margarine Revenue (USD Million) by Product (2021-2032)
By Product
Total Fats ≥ 70%
Total Fats < 70%
By Application
Online Sales
Offline Sales
Chapter 13. Middle East and Africa Household Hard Margarine Analysis and Outlook
13.1. Middle East and Africa Household Hard Margarine Revenue (USD Million), by Segments (2021-2032)
13.1.1. Middle East and Africa Household Hard Margarine Revenue (USD Million) by Type (2021-2032)
13.1.2. Middle East and Africa Household Hard Margarine Revenue (USD Million) by Application (2021-2032)
13.1.3. Middle East and Africa Household Hard Margarine Revenue (USD Million) by Product (2021-2032)
By Product
Total Fats ≥ 70%
Total Fats < 70%
By Application
Online Sales
Offline Sales
Chapter 14. Household Hard Margarine Company Profiles
14.1 Business Overview
14.2 Product Profiles
14.3 SWOT Profiles
14.5 Recent Developments
14.6 Financial Profile
List of Companies
BRF S.A.
Bright Food Group Co., Ltd.
Bunge Limited
Cargill, Incorporated
China Mengniu Dairy Company Limited
COFCO Corporation
Conagra Brands, Inc.
Fuji Oil Holdings Inc.
Grupo Lala, S.A.B. de C.V.
Inner Mongolia Yili Industrial Group Company Limited
NamChow
NMGK Group
Saputo Dairy UK Ltd.
Unilever PLC
Uni-President Enterprises Corporation
Wilmar International Limited
Yildiz Holding A.S.
Zydus Wellness Limited
15. Methodology and Data Sources
15.1 Customization Offerings
15.2 Subscription Services
15.3 Related Reports
15.4 Publisher Expertise
LIST OF TABLES
Table 1 Market Segmentation Analysis
Table 2 Global Household Hard Margarine Market Share of Leading Companies, 2023
Table 3 Product Offerings of Leading Companies
Table 4 Low Growth Scenario Forecasts
Table 5 Reference Case Growth Scenario
Table 6 High Growth Case Scenario
Table 7 Global Household Hard Margarine Revenue (USD Million) And CAGR (%) By Type (2021-2032)
Table 8 Global Household Hard Margarine Revenue (USD Million) And CAGR (%) By Application (2021-2032)
Table 9 Global Household Hard Margarine Revenue (USD Million) And CAGR (%) By Product (2021-2032)
Table 10 Global Household Hard Margarine Market Revenue (USD Million) By Regions (2021-2032)
Table 11 Global Household Hard Margarine Market Share (%) By Regions (2021-2032)
Table 12 North America Household Hard Margarine Revenue (USD Million) By Country (2021-2032)
Table 13 Europe Household Hard Margarine Revenue (USD Million) By Country (2021-2032)
Table 14 Asia Pacific Household Hard Margarine Revenue (USD Million) By Country (2021-2032)
Table 15 South America Household Hard Margarine Revenue (USD Million) By Country (2021-2032)
Table 16 Middle East and Africa Household Hard Margarine Revenue (USD Million) By Region (2021-2032)
Table 17 North America Household Hard Margarine Revenue (USD Million) By Type (2021-2032)
Table 18 North America Household Hard Margarine Revenue (USD Million) By Application (2021-2032)
Table 19 North America Household Hard Margarine Revenue (USD Million) By Product (2021-2032)
Table 20 Europe Household Hard Margarine Revenue (USD Million) By Type (2021-2032)
Table 21 Europe Household Hard Margarine Revenue (USD Million) By Application (2021-2032)
Table 22 Europe Household Hard Margarine Revenue (USD Million) By Product (2021-2032)
Table 23 Asia Pacific Household Hard Margarine Revenue (USD Million) By Type (2021-2032)
Table 24 Asia Pacific Household Hard Margarine Revenue (USD Million) By Application (2021-2032)
Table 25 Asia Pacific Household Hard Margarine Revenue (USD Million) By Product (2021-2032)
Table 26 South America Household Hard Margarine Revenue (USD Million) By Type (2021-2032)
Table 27 South America Household Hard Margarine Revenue (USD Million) By Application (2021-2032)
Table 28 South America Household Hard Margarine Revenue (USD Million) By Product (2021-2032)
Table 29 Middle East and Africa Household Hard Margarine Revenue (USD Million) By Type (2021-2032)
Table 30 Middle East and Africa Household Hard Margarine Revenue (USD Million) By Application (2021-2032)
Table 31 Middle East and Africa Household Hard Margarine Revenue (USD Million) By Product (2021-2032)
LIST OF FIGURES
Figure 1. Market Scope
Figure 2. Pricing Forecasts Per Unit, 2023- 2032
Figure 3. Porter’s Five Forces
Figure 4. Global Household Hard Margarine Market Revenue (USD Million) By Regions (2021-2032)
Figure 5. Global Household Hard Margarine Market Share (%) By Regions (2023)
Figure 6. North America Household Hard Margarine Revenue (USD Million) By Country (2021-2032)
Figure 7. United States Household Hard Margarine Revenue (USD Million) By Country (2021-2032)
Figure 8. Canada Household Hard Margarine Revenue (USD Million) By Country (2021-2032)
Figure 9. Mexico Household Hard Margarine Revenue (USD Million) By Country (2021-2032)
Figure 10. Europe Household Hard Margarine Revenue (USD Million) By Country (2021-2032)
Figure 11. Germany Household Hard Margarine Revenue (USD Million) By Country (2021-2032)
Figure 12. France Household Hard Margarine Revenue (USD Million) By Country (2021-2032)
Figure 13. United Kingdom Household Hard Margarine Revenue (USD Million) By Country (2021-2032)
Figure 14. Spain Household Hard Margarine Revenue (USD Million) By Country (2021-2032)
Figure 15. Italy Household Hard Margarine Revenue (USD Million) By Country (2021-2032)
Figure 16. Russia Household Hard Margarine Revenue (USD Million) By Country (2021-2032)
Figure 17. Rest of Europe Household Hard Margarine Revenue (USD Million) By Country (2021-2032)
Figure 11. Asia Pacific Household Hard Margarine Revenue (USD Million) By Country (2021-2032)
Figure 12. China Household Hard Margarine Revenue (USD Million) By Country (2021-2032)
Figure 13. Japan Household Hard Margarine Revenue (USD Million) By Country (2021-2032)
Figure 14. India Household Hard Margarine Revenue (USD Million) By Country (2021-2032)
Figure 15. South Korea Household Hard Margarine Revenue (USD Million) By Country (2021-2032)
Figure 16. Australia Household Hard Margarine Revenue (USD Million) By Country (2021-2032)
Figure 17. South East Asia Household Hard Margarine Revenue (USD Million) By Country (2021-2032)
Figure 18. South America Household Hard Margarine Revenue (USD Million) By Country (2021-2032)
Figure 19. Brazil Household Hard Margarine Revenue (USD Million) By Country (2021-2032)
Figure 20. Argentina Household Hard Margarine Revenue (USD Million) By Country (2021-2032)
Figure 21. Rest of Asia Pacific Household Hard Margarine Revenue (USD Million) By Country (2021-2032)
Figure 22. Middle East and Africa Household Hard Margarine Revenue (USD Million) By Region (2021-2032)
Figure 23. Saudi Arabia Household Hard Margarine Revenue (USD Million) By Region (2021-2032)
Figure 24. The UAE Household Hard Margarine Revenue (USD Million) By Region (2021-2032)
Figure 25. Rest of Middle East Household Hard Margarine Revenue (USD Million) By Region (2021-2032)
Figure 26. South Africa Household Hard Margarine Revenue (USD Million) By Region (2021-2032)
Figure 27. Africa Household Hard Margarine Revenue (USD Million) By Region (2021-2032)
Figure 28. North America Household Hard Margarine Revenue (USD Million) By Type (2021-2032)
Figure 29. North America Household Hard Margarine Revenue (USD Million) By Application (2021-2032)
Figure 30. North America Household Hard Margarine Revenue (USD Million) By Product (2021-2032)
Figure 31. Europe Household Hard Margarine Revenue (USD Million) By Type (2021-2032)
Figure 32. Europe Household Hard Margarine Revenue (USD Million) By Application (2021-2032)
Figure 33. Europe Household Hard Margarine Revenue (USD Million) By Product (2021-2032)
Figure 34. Asia Pacific Household Hard Margarine Revenue (USD Million) By Type (2021-2032)
Figure 35. Asia Pacific Household Hard Margarine Revenue (USD Million) By Application (2021-2032)
Figure 36. Asia Pacific Household Hard Margarine Revenue (USD Million) By Product (2021-2032)
Figure 37. South America Household Hard Margarine Revenue (USD Million) By Type (2021-2032)
Figure 38. South America Household Hard Margarine Revenue (USD Million) By Application (2021-2032)
Figure 39. South America Household Hard Margarine Revenue (USD Million) By Product (2021-2032)
Figure 40. Middle East and Africa Household Hard Margarine Revenue (USD Million) By Type (2021-2032)
Figure 41. Middle East and Africa Household Hard Margarine Revenue (USD Million) By Application (2021-2032)
Figure 42. Middle East and Africa Household Hard Margarine Revenue (USD Million) By Product (2021-2032)
By Product
Total Fats ≥ 70%
Total Fats < 70%
By Application
Online Sales
Offline Sales
Countries Analyzed
North America (US, Canada, Mexico)
Europe (Germany, UK, France, Spain, Italy, Russia, Rest of Europe)
Asia Pacific (China, India, Japan, South Korea, Australia, South East Asia, Rest of Asia)
South America (Brazil, Argentina, Rest of South America)
Middle East and Africa (Saudi Arabia, UAE, Rest of Middle East, South Africa, Egypt, Rest of Africa)
