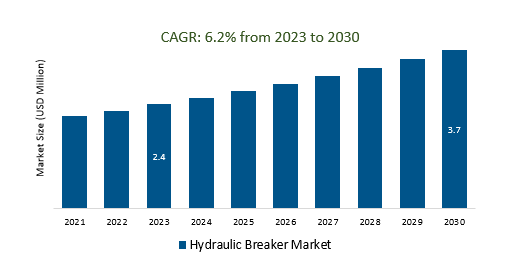
The Global Hydraulic Breaker Market Size is estimated to be US 2.4 Billion in 2023 and is poised to register 6.2X% growth over the forecast period from 2023 to 2030 to reach US $ 3.7 billion in 2030.
The market growth is driven by the increasing investment in infrastructure projects, including roads, bridges, tunnels, and buildings, which fuels the demand for hydraulic breakers. Leading companies that are focused on Green and Sustainable Solutions, Automation and Robotics, Market Expansion in Developing Region, Mining and Quarrying, Maintenance and Replacement, E-commerce and Online Sales, Safety and Ergonomics, and others to boost market shares in the industry.
Market Overview
The hydraulic breaker market is characterized by steady growth, primarily driven by the construction, mining, and demolition sectors. These versatile tools find application in breaking and excavating hard materials. Market drivers include urbanization, infrastructure development, and advancements in technology. Manufacturers focus on innovation, environmental compliance, and aftermarket services. The market is highly competitive, with a strong presence in emerging markets like China and India. Sustainability and the rental market are gaining importance, while economic conditions continue to influence market dynamics.
Market Dynamics
Market Trends- Hydraulic Breakers in the Mining Industry: A Vital Tool for Productivity and Safety
Hydraulic breakers are indispensable tools in the mining industry, offering both enhanced productivity and safety. They efficiently break down tough materials like rock and ore, reducing the need for manual labor and explosives, thus minimizing risks. Advancements in technology have also led to quieter and more eco-friendly models, aligning with the industry's sustainability goals, and making hydraulic breakers a critical asset in modern mining operations.
Market Driver- Replacement and Maintenance Demand Hydraulic Breaker Market
The hydraulic breaker market experiences a consistent demand for replacement and maintenance services due to aging equipment and regular wear in the construction, mining, and demolition sectors. Construction firms and contractors seek reliable servicing, spare parts, and repair options to extend the lifespan and maintain efficiency. This creates a dependable aftermarket segment as operators prioritize cost-effective maintenance to maximize longevity and performance, ensuring a steady demand for replacement parts and servicing in the industry.
Market Opportunity-Introduction of Technological Advancements
Technological advancements in the hydraulic breaker market have significantly improved these tools by enhancing their precision, power, and environmental friendliness. Innovations include more efficient hydraulic systems, advanced hammer designs, and noise reduction technologies, resulting in quieter and more productive operations. The integration of automation and remote-control features has improved safety and efficiency, while eco-friendly innovations like reduced emissions align with sustainability goals, collectively driving the evolution of hydraulic breakers towards greater efficiency, eco-friendliness, and operator safety.
Market Share Analysis- Machine Mounted Hydraulic Breaker Market will register the fastest growth
The Global Hydraulic Breaker Market is analyzed across Handheld, Machine Mounted, and others. Machine Mounted are poised to register the fastest growth. The machine-mounted hydraulic breaker market is a specialized sector within construction equipment, centered on hydraulic breakers affixed to heavy machinery like excavators and loaders. These attachments provide mobility and precision, making them crucial in construction, mining, and demolition. Market growth is driven by increased construction and mining activities, requiring versatile tools for material processing.
Market Share Analysis- Breaking Oversized Material held a significant market share in 2023
The Global Hydraulic Breaker Market is analyzed across various applications including Breaking Oversized Material, Trenching, Demolition, and others. Of these, Breaking Oversized Material held a significant market share in 2023. In the hydraulic breaker market, breaking oversized material is a crucial application where these attachments excel by efficiently reducing large and challenging materials to manageable sizes. Industries like construction, mining, and quarrying rely on hydraulic breakers to enhance operational efficiency, minimize costs, and improve safety when handling oversized rocks, concrete blocks, and other robust materials.
Hydraulic Breaker Market Segmentation
By Type
By Application
- Breaking Oversized Material
- Trenching
- Demolition
- Others
By Industry
- Construction
- Mining
- Others
By Equipment
By Capacity
- Light Duty (less than1000kg)
- Medium Duty (1000 to 2000kg)
- Heavy Duty (above 2000kg)
By Region
- North America (United States, Canada, Mexico)
- Europe (Germany, France, United Kingdom, Spain, Italy, Others)
- Asia Pacific (China, India, Japan, South Korea, Australia, Others)
- Latin America (Brazil, Argentina, Others)
- Middle East and Africa (Saudi Arabia, UAE, Kuwait, Other Middle East, South Africa, Nigeria, Other Africa)
Hydraulic Breaker Market Companies
- Caterpillar (United States)
- Sandvik (Sweden)
- Komatsu (Japan)Atlas Copco (Sweden)
- Doosan Bobcat (South Korea)
- Montabert (France)
- NPK Construction Equipment (United States)
- Furukawa Rock Drill (Japan)
- Soosan Heavy Industries (South Korea)
- Rammer (Finland)
- Arrowhead Rockdrill (United States)
- Breaker Technology (Canada)Hammer Srl (Italy)
- Indeco (Italy)
- JCB (United Kingdom)
*List not exhaustive
Hydraulic Breaker Market Outlook 2023
1 Market Overview
1.1 Introduction to the Hydraulic Breaker Market
1.2 Scope of the Study
1.3 Research Objective
1.3.1 Key Market Scope and Segments
1.3.2 Players Covered
1.3.3 Years Considered
2 Executive Summary
2.1 2023 Hydraulic Breaker - Market Statistics
3 Market Dynamics
3.1 Market Drivers
3.2 Market Challenges
3.3 Market Opportunities
3.4 Market Trends
4 Market Factor Analysis
4.1 Porter’s Five Forces
4.2 Market Entropy
4.2.1 Global Hydraulic Breaker Market Companies with Area Served
4.2.2 Products Offerings Global Hydraulic Breaker Market
5 COVID-19 Impact Analysis and Outlook Scenarios
5.1.1 Covid-19 Impact Analysis
5.1.2 post-COVID-19 Scenario- Low Growth Case
5.1.3 post-COVID-19 Scenario- Reference Growth Case
5.1.4 post-COVID-19 Scenario- Low Growth Case
6 Global Hydraulic Breaker Market Trends
6.1 Global Hydraulic Breaker Revenue (USD Million) and CAGR (%) by Type (2018-2030)
6.2 Global Hydraulic Breaker Revenue (USD Million) and CAGR (%) by Applications (2018-2030)
6.3 Global Hydraulic Breaker Revenue (USD Million) and CAGR (%) by regions (2018-2030)
7 Global Hydraulic Breaker Market Revenue (USD Million) by Type, and Applications (2018-2022)
7.1 Global Hydraulic Breaker Revenue (USD Million) by Type (2018-2022)
7.1.1 Global Hydraulic Breaker Revenue (USD Million), Market Share (%) by Type (2018-2022)
7.2 Global Hydraulic Breaker Revenue (USD Million) by Applications (2018-2022)
7.2.1 Global Hydraulic Breaker Revenue (USD Million), Market Share (%) by Applications (2018-2022)
8 Global Hydraulic Breaker Development Regional Status and Outlook
8.1 Global Hydraulic Breaker Revenue (USD Million) By Regions (2018-2022)
8.2 North America Hydraulic Breaker Revenue (USD Million) by Type, and Application (2018-2022)
8.2.1 North America Hydraulic Breaker Revenue (USD Million) by Country (2018-2022)
8.2.2 North America Hydraulic Breaker Revenue (USD Million) by Type (2018-2022)
8.2.3 North America Hydraulic Breaker Revenue (USD Million) by Applications (2018-2022)
8.3 Europe Hydraulic Breaker Revenue (USD Million), by Type, and Applications (USD Million) (2018-2022)
8.3.1 Europe Hydraulic Breaker Revenue (USD Million), by Country (2018-2022)
8.3.2 Europe Hydraulic Breaker Revenue (USD Million) by Type (2018-2022)
8.3.3 Europe Hydraulic Breaker Revenue (USD Million) by Applications (2018-2022)
8.4 Asia Pacific Hydraulic Breaker Revenue (USD Million), and Revenue (USD Million) by Type, and Applications (2018-2022)
8.4.1 Asia Pacific Hydraulic Breaker Revenue (USD Million) by Country (2018-2022)
8.4.2 Asia Pacific Hydraulic Breaker Revenue (USD Million) by Type (2018-2022)
8.4.3 Asia Pacific Hydraulic Breaker Revenue (USD Million) by Applications (2018-2022)
8.5 South America Hydraulic Breaker Revenue (USD Million), by Type, and Applications (2018-2022)
8.5.1 South America Hydraulic Breaker Revenue (USD Million), by Country (2018-2022)
8.5.2 South America Hydraulic Breaker Revenue (USD Million) by Type (2018-2022)
8.5.3 South America Hydraulic Breaker Revenue (USD Million) by Applications (2018-2022)
8.6 Middle East and Africa Hydraulic Breaker Revenue (USD Million), by Type, Technology, Application, Thickness (2018-2022)
8.6.1 Middle East and Africa Hydraulic Breaker Revenue (USD Million) by Country (2018-2022)
8.6.2 Middle East and Africa Hydraulic Breaker Revenue (USD Million) by Type (2018-2022)
8.6.3 Middle East and Africa Hydraulic Breaker Revenue (USD Million) by Applications (2018-2022)
9 Company Profiles
10 Global Hydraulic Breaker Market Revenue (USD Million), by Type, and Applications (2023-2030)
10.1 Global Hydraulic Breaker Revenue (USD Million) and Market Share (%) by Type (2023-2030)
10.1.1 Global Hydraulic Breaker Revenue (USD Million), and Market Share (%) by Type (2023-2030)
10.2 Global Hydraulic Breaker Revenue (USD Million) and Market Share (%) by Applications (2023-2030)
10.2.1 Global Hydraulic Breaker Revenue (USD Million), and Market Share (%) by Applications (2023-2030)
11 Global Hydraulic Breaker Development Regional Status and Outlook Forecast
11.1 Global Hydraulic Breaker Revenue (USD Million) By Regions (2023-2030)
11.2 North America Hydraulic Breaker Revenue (USD Million) by Type, and Applications (2023-2030)
11.2.1 North America Hydraulic Breaker Revenue (USD) Million by Country (2023-2030)
11.2.2 North America Hydraulic Breaker Revenue (USD Million), by Type (2023-2030)
11.2.3 North America Hydraulic Breaker Revenue (USD Million), Market Share (%) by Applications (2023-2030)
11.3 Europe Hydraulic Breaker Revenue (USD Million), by Type, and Applications (2023-2030)
11.3.1 Europe Hydraulic Breaker Revenue (USD Million), by Country (2023-2030)
11.3.2 Europe Hydraulic Breaker Revenue (USD Million), by Type (2023-2030)
11.3.3 Europe Hydraulic Breaker Revenue (USD Million), by Applications (2023-2030)
11.4 Asia Pacific Hydraulic Breaker Revenue (USD Million) by Type, and Applications (2023-2030)
11.4.1 Asia Pacific Hydraulic Breaker Revenue (USD Million), by Country (2023-2030)
11.4.2 Asia Pacific Hydraulic Breaker Revenue (USD Million), by Type (2023-2030)
11.4.3 Asia Pacific Hydraulic Breaker Revenue (USD Million), by Applications (2023-2030)
11.5 South America Hydraulic Breaker Revenue (USD Million), by Type, and Applications (2023-2030)
11.5.1 South America Hydraulic Breaker Revenue (USD Million), by Country (2023-2030)
11.5.2 South America Hydraulic Breaker Revenue (USD Million), by Type (2023-2030)
11.5.3 South America Hydraulic Breaker Revenue (USD Million), by Applications (2023-2030)
11.6 Middle East and Africa Hydraulic Breaker Revenue (USD Million), by Type, and Applications (2023-2030)
11.6.1 Middle East and Africa Hydraulic Breaker Revenue (USD Million), by region (2023-2030)
11.6.2 Middle East and Africa Hydraulic Breaker Revenue (USD Million), by Type (2023-2030)
11.6.3 Middle East and Africa Hydraulic Breaker Revenue (USD Million), by Applications (2023-2030)
12 Methodology and Data Sources
12.1 Methodology/Research Approach
12.1.1 Research Programs/Design
12.1.2 Market Size Estimation
12.1.3 Market Breakdown and Data Triangulation
12.2 Data Sources
12.2.1 Secondary Sources
12.2.2 Primary Sources
12.3 Disclaimer
List of Tables
Table 1 Market Segmentation Analysis
Table 2 Global Hydraulic Breaker Market Companies with Areas Served
Table 3 Products Offerings Global Hydraulic Breaker Market
Table 4 Low Growth Scenario Forecasts
Table 5 Reference Case Growth Scenario
Table 6 High Growth Case Scenario
Table 7 Global Hydraulic Breaker Revenue (USD Million) And CAGR (%) By Type (2018-2030)
Table 8 Global Hydraulic Breaker Revenue (USD Million) And CAGR (%) By Applications (2018-2030)
Table 9 Global Hydraulic Breaker Revenue (USD Million) And CAGR (%) By Regions (2018-2030)
Table 10 Global Hydraulic Breaker Revenue (USD Million) By Type (2018-2022)
Table 11 Global Hydraulic Breaker Revenue Market Share (%) By Type (2018-2022)
Table 12 Global Hydraulic Breaker Revenue (USD Million) By Applications (2018-2022)
Table 13 Global Hydraulic Breaker Revenue Market Share (%) By Applications (2018-2022)
Table 14 Global Hydraulic Breaker Market Revenue (USD Million) By Regions (2018-2022)
Table 15 Global Hydraulic Breaker Market Share (%) By Regions (2018-2022)
Table 16 North America Hydraulic Breaker Revenue (USD Million) By Country (2018-2022)
Table 17 North America Hydraulic Breaker Revenue (USD Million) By Type (2018-2022)
Table 18 North America Hydraulic Breaker Revenue (USD Million) By Applications (2018-2022)
Table 19 Europe Hydraulic Breaker Revenue (USD Million) By Country (2018-2022)
Table 20 Europe Hydraulic Breaker Revenue (USD Million) By Type (2018-2022)
Table 21 Europe Hydraulic Breaker Revenue (USD Million) By Applications (2018-2022)
Table 22 Asia Pacific Hydraulic Breaker Revenue (USD Million) By Country (2018-2022)
Table 23 Asia Pacific Hydraulic Breaker Revenue (USD Million) By Type (2018-2022)
Table 24 Asia Pacific Hydraulic Breaker Revenue (USD Million) By Applications (2018-2022)
Table 25 South America Hydraulic Breaker Revenue (USD Million) By Country (2018-2022)
Table 26 South America Hydraulic Breaker Revenue (USD Million) By Type (2018-2022)
Table 27 South America Hydraulic Breaker Revenue (USD Million) By Applications (2018-2022)
Table 28 Middle East and Africa Hydraulic Breaker Revenue (USD Million) By Region (2018-2022)
Table 29 Middle East and Africa Hydraulic Breaker Revenue (USD Million) By Type (2018-2022)
Table 30 Middle East and Africa Hydraulic Breaker Revenue (USD Million) By Applications (2018-2022)
Table 31 Financial Analysis
Table 32 Global Hydraulic Breaker Revenue (USD Million) By Type (2023-2030)
Table 33 Global Hydraulic Breaker Revenue Market Share (%) By Type (2023-2030)
Table 34 Global Hydraulic Breaker Revenue (USD Million) By Applications (2023-2030)
Table 35 Global Hydraulic Breaker Revenue Market Share (%) By Applications (2023-2030)
Table 36 Global Hydraulic Breaker Market Revenue (USD Million), And Revenue (USD Million) By Regions (2023-2030)
Table 37 North America Hydraulic Breaker Revenue (USD)By Country (2023-2030)
Table 38 North America Hydraulic Breaker Revenue (USD Million) By Type (2023-2030)
Table 39 North America Hydraulic Breaker Revenue (USD Million) By Applications (2023-2030)
Table 40 Europe Hydraulic Breaker Revenue (USD Million) By Country (2023-2030)
Table 41 Europe Hydraulic Breaker Revenue (USD Million) By Type (2023-2030)
Table 42 Europe Hydraulic Breaker Revenue (USD Million) By Applications (2023-2030)
Table 43 Asia Pacific Hydraulic Breaker Revenue (USD Million) By Country (2023-2030)
Table 44 Asia Pacific Hydraulic Breaker Revenue (USD Million) By Type (2023-2030)
Table 45 Asia Pacific Hydraulic Breaker Revenue (USD Million) By Applications (2023-2030)
Table 46 South America Hydraulic Breaker Revenue (USD Million) By Country (2023-2030)
Table 47 South America Hydraulic Breaker Revenue (USD Million) By Type (2023-2030)
Table 48 South America Hydraulic Breaker Revenue (USD Million) By Applications (2023-2030)
Table 49 Middle East and Africa Hydraulic Breaker Revenue (USD Million) By Region (2023-2030)
Table 50 Middle East and Africa Hydraulic Breaker Revenue (USD Million) By Region (2023-2030)
Table 51 Middle East and Africa Hydraulic Breaker Revenue (USD Million) By Type (2023-2030)
Table 52 Middle East and Africa Hydraulic Breaker Revenue (USD Million) By Applications (2023-2030)
Table 53 Research Programs/Design for This Report
Table 54 Key Data Information from Secondary Sources
Table 55 Key Data Information from Primary Sources
List of Figures
Figure 1 Market Scope
Figure 2 Porter’s Five Forces
Figure 3 Global Hydraulic Breaker Revenue (USD Million) By Type (2018-2022)
Figure 4 Global Hydraulic Breaker Revenue Market Share (%) By Type (2022)
Figure 5 Global Hydraulic Breaker Revenue (USD Million) By Applications (2018-2022)
Figure 6 Global Hydraulic Breaker Revenue Market Share (%) By Applications (2022)
Figure 7 Global Hydraulic Breaker Market Revenue (USD Million) By Regions (2018-2022)
Figure 8 Global Hydraulic Breaker Market Share (%) By Regions (2022)
Figure 9 North America Hydraulic Breaker Revenue (USD Million) By Country (2018-2022)
Figure 10 North America Hydraulic Breaker Revenue (USD Million) By Type (2018-2022)
Figure 11 North America Hydraulic Breaker Revenue (USD Million) By Applications (2018-2022)
Figure 12 Europe Hydraulic Breaker Revenue (USD Million) By Country (2018-2022)
Figure 13 Europe Hydraulic Breaker Revenue (USD Million) By Type (2018-2022)
Figure 14 Europe Hydraulic Breaker Revenue (USD Million) By Applications (2018-2022)
Figure 15 Asia Pacific Hydraulic Breaker Revenue (USD Million) By Country (2018-2022)
Figure 16 Asia Pacific Hydraulic Breaker Revenue (USD Million) By Type (2018-2022)
Figure 17 Asia Pacific Hydraulic Breaker Revenue (USD Million) By Applications (2018-2022)
Figure 18 South America Hydraulic Breaker Revenue (USD Million) By Country (2018-2022)
Figure 19 South America Hydraulic Breaker Revenue (USD Million) By Type (2018-2022)
Figure 20 South America Hydraulic Breaker Revenue (USD Million) By Applications (2018-2022)
Figure 21 Middle East and Africa Hydraulic Breaker Revenue (USD Million) By Region (2018-2022)
Figure 22 Middle East and Africa Hydraulic Breaker Revenue (USD Million) By Type (2018-2022)
Figure 23 Middle East and Africa Hydraulic Breaker Revenue (USD Million) By Applications (2018-2022)
Figure 24 Global Hydraulic Breaker Revenue (USD Million) By Type (2023-2030)
Figure 25 Global Hydraulic Breaker Revenue Market Share (%) By Type (2030)
Figure 26 Global Hydraulic Breaker Revenue (USD Million) By Applications (2023-2030)
Figure 27 Global Hydraulic Breaker Revenue Market Share (%) By Applications (2030)
Figure 28 Global Hydraulic Breaker Market Revenue (USD Million) By Regions (2023-2030)
Figure 29 North America Hydraulic Breaker Revenue (USD Million) By Country (2023-2030)
Figure 30 North America Hydraulic Breaker Revenue (USD Million) By Type (2023-2030)
Figure 31 North America Hydraulic Breaker Revenue (USD Million) By Applications (2023-2030)
Figure 32 Europe Hydraulic Breaker Revenue (USD Million) By Country (2023-2030)
Figure 33 Europe Hydraulic Breaker Revenue (USD Million) By Type (2023-2030)
Figure 34 Europe Hydraulic Breaker Revenue (USD Million) By Applications (2023-2030)
Figure 35 Asia Pacific Hydraulic Breaker Revenue (USD Million) By Country (2023-2030)
Figure 36 Asia Pacific Hydraulic Breaker Revenue (USD Million) By Type (2023-2030)
Figure 37 Asia Pacific Hydraulic Breaker Revenue (USD Million) By Applications (2023-2030)
Figure 38 South America Hydraulic Breaker Revenue (USD Million) By Country (2023-2030)
Figure 39 South America Hydraulic Breaker Revenue (USD Million) By Type (2023-2030)
Figure 40 South America Hydraulic Breaker Revenue (USD Million) By Applications (2023-2030)
Figure 41 Middle East and Africa Hydraulic Breaker Revenue (USD Million) By Region (2023-2030)
Figure 42 Middle East and Africa Hydraulic Breaker Revenue (USD Million) By Region (2023-2030)
Figure 43 Middle East and Africa Hydraulic Breaker Revenue (USD Million) By Type (2023-2030)
Figure 44 Middle East and Africa Hydraulic Breaker Revenue (USD Million) By Applications (2023-2030)
Figure 45 Bottom-Up and Top-Down Approaches for This Report
Figure 46 Data Triangulation
