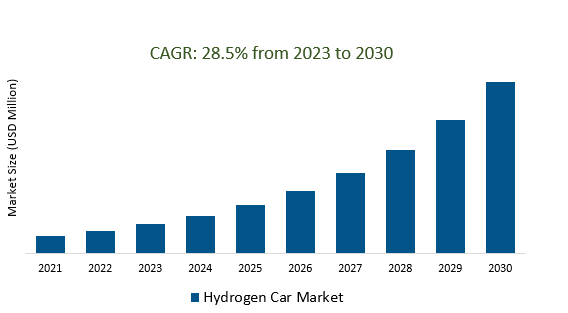
The Global Hydrogen Car Market Size is estimated to register 28.5% growth over the forecast period from 2023 to 2030.
Hydrogen Car Market Overview
Ongoing research and development in fuel cell technology, particularly in improving efficiency, reducing costs, and extending the lifespan of fuel cells, are enhancing the attractiveness and viability of hydrogen-powered vehicles. Increasing global efforts to reduce carbon emissions and combat climate change are driving the demand for zero-emission vehicles. Growing interest in utilizing hydrogen fuel cell technology for heavy-duty applications like trucks, buses, and other commercial vehicles due to their potential for long-range capabilities and shorter refueling times compared to battery-electric alternatives. Collaboration among automakers, energy companies, governments, and research institutions is fostering innovation, standardization, and the development of hydrogen ecosystems, accelerating the growth of the hydrogen car market. The emergence of hydrogen ecosystems encompassing various stakeholders involved in hydrogen production, storage, transportation, and usage is facilitating a more integrated approach to the hydrogen economy.
Hydrogen Car Market Dynamics
Market Trends- The increasing demand for zero-emission vehicles is driving the market growth.
The heightened environmental consciousness and amplified concerns about climate change are steering consumers, governments, and businesses toward cleaner transportation alternatives. Regulatory changes and evolving policies mandating lower emissions standards are significant drivers compelling businesses to invest in environmentally friendly transport options. Further, the diversification of hydrogen vehicle models, catering to various commercial needs such as fleet operations and logistics, is attracting businesses looking for zero-emission solutions in their operations.
Market Driver- The decarbonization of transportation is a pivotal focus within the hydrogen car market.
Growing emphasis on diversifying transportation fuels to reduce dependency on fossil fuels is the key factor driving the demand as hydrogen is seen as a promising alternative fuel.
Additionally, advancements in fuel cell technology are reducing manufacturing costs and enhancing the efficiency of hydrogen-powered vehicles, making them more appealing for businesses concerned with long-term operational savings and eco-friendly branding.
These versatile models catering to diverse needs, including logistics, fleet operations, and public transportation, offering companies viable options to align their operations with eco-friendly practices while meeting specific operational requirements are fueling the demand.
Market Opportunity- Introduction of Longer Driving Range and Fast Refueling for Hydrogen Car Market.
Advancements in fuel cell design and efficiency of optimizing fuel cell systems, enabling them to convert hydrogen into electricity more effectively, thereby maximizing the vehicle's range before requiring refueling are driving the market.
The expansion of refueling infrastructure is ensuring better accessibility for consumers and businesses, alleviating concerns about the availability of refueling stations and enabling longer trips without range anxiety.
Additionally, automakers' increasing focus on developing hydrogen-powered vehicles with larger hydrogen tanks and improved fuel cell efficiency directly contributes to longer driving ranges and faster refueling times.
Market Share Analysis- Passenger vehicles will register the fastest growth.
The Global Hydrogen Car Market is analyzed across Passenger Vehicle & Commercial Vehicle. Passenger vehicles are poised to register the fastest growth. Passenger vehicles serve as the forefront of showcasing the feasibility and advantages of hydrogen technology in the automotive sector, attracting consumer interest, and laying the groundwork for further advancements in hydrogen-powered vehicles. Additionally, passenger vehicles tend to have a more extensive consumer base and higher market demand compared to commercial vehicles. The adoption of hydrogen technology in passenger vehicles aligned with consumer preferences for eco-friendly and sustainable transportation solutions, contributing to the faster growth rate in this segment.
Market Share Analysis- Proton Exchange Membrane Fuel Cell held a significant market share in 2023.
The Global Product Engineering Service Market is analyzed across various Fuel cell types including Proton Exchange Membrane Fuel Cell, Phosphoric Acid Fuel Cells, Alkaline Fuel Cell, Solid Oxide Fuel Cell & Others. Of these, Proton Exchange Membrane Fuel Cell held a significant market share in 2023. PEMFCs are known for their high-power density, quick startup times, and suitability for automotive applications. These characteristics make PEMFCs particularly well-suited for use in hydrogen-powered passenger vehicles, offering a balance between performance, efficiency, and practicality for everyday use. Automakers and fuel cell developers have focused their efforts on advancing PEMFC technology for automotive applications, aiming to improve efficiency, reduce costs, and increase durability. It's essential to note that advancements in fuel cell technology are ongoing, and the significance of various fuel cell types may evolve over time based on technological breakthroughs, cost reductions, and industry preferences.
Hydrogen Car Market Segmentation
By Type
- Passenger Vehicle
- Commercial Vehicle
By Fuel Cell Type
- Proton Exchange Membrane Fuel Cell
- Phosphoric Acid Fuel Cells
- Alkaline Fuel Cell
- Solid Oxide Fuel Cell
- Others
By Region
- North America (United States, Canada, Mexico)
- Europe (Germany, France, United Kingdom, Spain, Italy, Others)
- Asia Pacific (China, India, Japan, South Korea, Australia, Others)
- Latin America (Brazil, Argentina, Others)
- Middle East and Africa (Saudi Arabia, UAE, Kuwait, Other Middle East, South Africa, Nigeria, Other Africa)
Hydrogen Car Market Companies
- Toyota (Japan)
- Van Hool (Belgium)
- Hyundai Motor Group (Korea)
- WrightBus (United Kingdom)
- Volvo Group (Sweden)
- Hyzon Motors (United States)
- TWI Ltd (United Kingdom)
- Renault (France)
- Mercedes Benz Group (Germany)
- Audi AG (Germany)
- Scania (Sweden)
*List not exhaustive
Hydrogen Car Market Outlook 2023
1 Market Overview
1.1 Introduction to the Hydrogen Car Market
1.2 Scope of the Study
1.3 Research Objective
1.3.1 Key Market Scope and Segments
1.3.2 Players Covered
1.3.3 Years Considered
2 Executive Summary
2.1 2023 Hydrogen Car Industry- Market Statistics
3 Market Dynamics
3.1 Market Drivers
3.2 Market Challenges
3.3 Market Opportunities
3.4 Market Trends
4 Market Factor Analysis
4.1 Porter’s Five Forces
4.2 Market Entropy
4.2.1 Global Hydrogen Car Market Companies with Area Served
4.2.2 Products Offerings Global Hydrogen Car Market
5 COVID-19 Impact Analysis and Outlook Scenarios
5.1.1 Covid-19 Impact Analysis
5.1.2 post-COVID-19 Scenario- Low Growth Case
5.1.3 post-COVID-19 Scenario- Reference Growth Case
5.1.4 post-COVID-19 Scenario- Low Growth Case
6 Global Hydrogen Car Market Trends
6.1 Global Hydrogen Car Revenue (USD Million) and CAGR (%) by Type (2018-2030)
6.2 Global Hydrogen Car Revenue (USD Million) and CAGR (%) by Applications (2018-2030)
6.3 Global Hydrogen Car Revenue (USD Million) and CAGR (%) by regions (2018-2030)
7 Global Hydrogen Car Market Revenue (USD Million) by Type, and Applications (2018-2022)
7.1 Global Hydrogen Car Revenue (USD Million) by Type (2018-2022)
7.1.1 Global Hydrogen Car Revenue (USD Million), Market Share (%) by Type (2018-2022)
7.2 Global Hydrogen Car Revenue (USD Million) by Applications (2018-2022)
7.2.1 Global Hydrogen Car Revenue (USD Million), Market Share (%) by Applications (2018-2022)
8 Global Hydrogen Car Development Regional Status and Outlook
8.1 Global Hydrogen Car Revenue (USD Million) By Regions (2018-2022)
8.2 North America Hydrogen Car Revenue (USD Million) by Type, and Application (2018-2022)
8.2.1 North America Hydrogen Car Revenue (USD Million) by Country (2018-2022)
8.2.2 North America Hydrogen Car Revenue (USD Million) by Type (2018-2022)
8.2.3 North America Hydrogen Car Revenue (USD Million) by Applications (2018-2022)
8.3 Europe Hydrogen Car Revenue (USD Million), by Type, and Applications (USD Million) (2018-2022)
8.3.1 Europe Hydrogen Car Revenue (USD Million), by Country (2018-2022)
8.3.2 Europe Hydrogen Car Revenue (USD Million) by Type (2018-2022)
8.3.3 Europe Hydrogen Car Revenue (USD Million) by Applications (2018-2022)
8.4 Asia Pacific Hydrogen Car Revenue (USD Million), and Revenue (USD Million) by Type, and Applications (2018-2022)
8.4.1 Asia Pacific Hydrogen Car Revenue (USD Million) by Country (2018-2022)
8.4.2 Asia Pacific Hydrogen Car Revenue (USD Million) by Type (2018-2022)
8.4.3 Asia Pacific Hydrogen Car Revenue (USD Million) by Applications (2018-2022)
8.5 South America Hydrogen Car Revenue (USD Million), by Type, and Applications (2018-2022)
8.5.1 South America Hydrogen Car Revenue (USD Million), by Country (2018-2022)
8.5.2 South America Hydrogen Car Revenue (USD Million) by Type (2018-2022)
8.5.3 South America Hydrogen Car Revenue (USD Million) by Applications (2018-2022)
8.6 Middle East and Africa Hydrogen Car Revenue (USD Million), by Type, Technology, Application, Thickness (2018-2022)
8.6.1 Middle East and Africa Hydrogen Car Revenue (USD Million) by Country (2018-2022)
8.6.2 Middle East and Africa Hydrogen Car Revenue (USD Million) by Type (2018-2022)
8.6.3 Middle East and Africa Hydrogen Car Revenue (USD Million) by Applications (2018-2022)
9 Company Profiles
10 Global Hydrogen Car Market Revenue (USD Million), by Type, and Applications (2023-2030)
10.1 Global Hydrogen Car Revenue (USD Million) and Market Share (%) by Type (2023-2030)
10.1.1 Global Hydrogen Car Revenue (USD Million), and Market Share (%) by Type (2023-2030)
10.2 Global Hydrogen Car Revenue (USD Million) and Market Share (%) by Applications (2023-2030)
10.2.1 Global Hydrogen Car Revenue (USD Million), and Market Share (%) by Applications (2023-2030)
11 Global Hydrogen Car Development Regional Status and Outlook Forecast
11.1 Global Hydrogen Car Revenue (USD Million) By Regions (2023-2030)
11.2 North America Hydrogen Car Revenue (USD Million) by Type, and Applications (2023-2030)
11.2.1 North America Hydrogen Car Revenue (USD) Million by Country (2023-2030)
11.2.2 North America Hydrogen Car Revenue (USD Million), by Type (2023-2030)
11.2.3 North America Hydrogen Car Revenue (USD Million), Market Share (%) by Applications (2023-2030)
11.3 Europe Hydrogen Car Revenue (USD Million), by Type, and Applications (2023-2030)
11.3.1 Europe Hydrogen Car Revenue (USD Million), by Country (2023-2030)
11.3.2 Europe Hydrogen Car Revenue (USD Million), by Type (2023-2030)
11.3.3 Europe Hydrogen Car Revenue (USD Million), by Applications (2023-2030)
11.4 Asia Pacific Hydrogen Car Revenue (USD Million) by Type, and Applications (2023-2030)
11.4.1 Asia Pacific Hydrogen Car Revenue (USD Million), by Country (2023-2030)
11.4.2 Asia Pacific Hydrogen Car Revenue (USD Million), by Type (2023-2030)
11.4.3 Asia Pacific Hydrogen Car Revenue (USD Million), by Applications (2023-2030)
11.5 South America Hydrogen Car Revenue (USD Million), by Type, and Applications (2023-2030)
11.5.1 South America Hydrogen Car Revenue (USD Million), by Country (2023-2030)
11.5.2 South America Hydrogen Car Revenue (USD Million), by Type (2023-2030)
11.5.3 South America Hydrogen Car Revenue (USD Million), by Applications (2023-2030)
11.6 Middle East and Africa Hydrogen Car Revenue (USD Million), by Type, and Applications (2023-2030)
11.6.1 Middle East and Africa Hydrogen Car Revenue (USD Million), by region (2023-2030)
11.6.2 Middle East and Africa Hydrogen Car Revenue (USD Million), by Type (2023-2030)
11.6.3 Middle East and Africa Hydrogen Car Revenue (USD Million), by Applications (2023-2030)
12 Methodology and Data Sources
12.1 Methodology/Research Approach
12.1.1 Research Programs/Design
12.1.2 Market Size Estimation
12.1.3 Market Breakdown and Data Triangulation
12.2 Data Sources
12.2.1 Secondary Sources
12.2.2 Primary Sources
12.3 Disclaimer
List of Tables
Table 1 Market Segmentation Analysis
Table 2 Global Hydrogen Car Market Companies with Areas Served
Table 3 Products Offerings Global Hydrogen Car Market
Table 4 Low Growth Scenario Forecasts
Table 5 Reference Case Growth Scenario
Table 6 High Growth Case Scenario
Table 7 Global Hydrogen Car Revenue (USD Million) And CAGR (%) By Type (2018-2030)
Table 8 Global Hydrogen Car Revenue (USD Million) And CAGR (%) By Applications (2018-2030)
Table 9 Global Hydrogen Car Revenue (USD Million) And CAGR (%) By Regions (2018-2030)
Table 10 Global Hydrogen Car Revenue (USD Million) By Type (2018-2022)
Table 11 Global Hydrogen Car Revenue Market Share (%) By Type (2018-2022)
Table 12 Global Hydrogen Car Revenue (USD Million) By Applications (2018-2022)
Table 13 Global Hydrogen Car Revenue Market Share (%) By Applications (2018-2022)
Table 14 Global Hydrogen Car Market Revenue (USD Million) By Regions (2018-2022)
Table 15 Global Hydrogen Car Market Share (%) By Regions (2018-2022)
Table 16 North America Hydrogen Car Revenue (USD Million) By Country (2018-2022)
Table 17 North America Hydrogen Car Revenue (USD Million) By Type (2018-2022)
Table 18 North America Hydrogen Car Revenue (USD Million) By Applications (2018-2022)
Table 19 Europe Hydrogen Car Revenue (USD Million) By Country (2018-2022)
Table 20 Europe Hydrogen Car Revenue (USD Million) By Type (2018-2022)
Table 21 Europe Hydrogen Car Revenue (USD Million) By Applications (2018-2022)
Table 22 Asia Pacific Hydrogen Car Revenue (USD Million) By Country (2018-2022)
Table 23 Asia Pacific Hydrogen Car Revenue (USD Million) By Type (2018-2022)
Table 24 Asia Pacific Hydrogen Car Revenue (USD Million) By Applications (2018-2022)
Table 25 South America Hydrogen Car Revenue (USD Million) By Country (2018-2022)
Table 26 South America Hydrogen Car Revenue (USD Million) By Type (2018-2022)
Table 27 South America Hydrogen Car Revenue (USD Million) By Applications (2018-2022)
Table 28 Middle East and Africa Hydrogen Car Revenue (USD Million) By Region (2018-2022)
Table 29 Middle East and Africa Hydrogen Car Revenue (USD Million) By Type (2018-2022)
Table 30 Middle East and Africa Hydrogen Car Revenue (USD Million) By Applications (2018-2022)
Table 31 Financial Analysis
Table 32 Global Hydrogen Car Revenue (USD Million) By Type (2023-2030)
Table 33 Global Hydrogen Car Revenue Market Share (%) By Type (2023-2030)
Table 34 Global Hydrogen Car Revenue (USD Million) By Applications (2023-2030)
Table 35 Global Hydrogen Car Revenue Market Share (%) By Applications (2023-2030)
Table 36 Global Hydrogen Car Market Revenue (USD Million), And Revenue (USD Million) By Regions (2023-2030)
Table 37 North America Hydrogen Car Revenue (USD)By Country (2023-2030)
Table 38 North America Hydrogen Car Revenue (USD Million) By Type (2023-2030)
Table 39 North America Hydrogen Car Revenue (USD Million) By Applications (2023-2030)
Table 40 Europe Hydrogen Car Revenue (USD Million) By Country (2023-2030)
Table 41 Europe Hydrogen Car Revenue (USD Million) By Type (2023-2030)
Table 42 Europe Hydrogen Car Revenue (USD Million) By Applications (2023-2030)
Table 43 Asia Pacific Hydrogen Car Revenue (USD Million) By Country (2023-2030)
Table 44 Asia Pacific Hydrogen Car Revenue (USD Million) By Type (2023-2030)
Table 45 Asia Pacific Hydrogen Car Revenue (USD Million) By Applications (2023-2030)
Table 46 South America Hydrogen Car Revenue (USD Million) By Country (2023-2030)
Table 47 South America Hydrogen Car Revenue (USD Million) By Type (2023-2030)
Table 48 South America Hydrogen Car Revenue (USD Million) By Applications (2023-2030)
Table 49 Middle East and Africa Hydrogen Car Revenue (USD Million) By Region (2023-2030)
Table 50 Middle East and Africa Hydrogen Car Revenue (USD Million) By Region (2023-2030)
Table 51 Middle East and Africa Hydrogen Car Revenue (USD Million) By Type (2023-2030)
Table 52 Middle East and Africa Hydrogen Car Revenue (USD Million) By Applications (2023-2030)
Table 53 Research Programs/Design for This Report
Table 54 Key Data Information from Secondary Sources
Table 55 Key Data Information from Primary Sources
List of Figures
Figure 1 Market Scope
Figure 2 Porter’s Five Forces
Figure 3 Global Hydrogen Car Revenue (USD Million) By Type (2018-2022)
Figure 4 Global Hydrogen Car Revenue Market Share (%) By Type (2022)
Figure 5 Global Hydrogen Car Revenue (USD Million) By Applications (2018-2022)
Figure 6 Global Hydrogen Car Revenue Market Share (%) By Applications (2022)
Figure 7 Global Hydrogen Car Market Revenue (USD Million) By Regions (2018-2022)
Figure 8 Global Hydrogen Car Market Share (%) By Regions (2022)
Figure 9 North America Hydrogen Car Revenue (USD Million) By Country (2018-2022)
Figure 10 North America Hydrogen Car Revenue (USD Million) By Type (2018-2022)
Figure 11 North America Hydrogen Car Revenue (USD Million) By Applications (2018-2022)
Figure 12 Europe Hydrogen Car Revenue (USD Million) By Country (2018-2022)
Figure 13 Europe Hydrogen Car Revenue (USD Million) By Type (2018-2022)
Figure 14 Europe Hydrogen Car Revenue (USD Million) By Applications (2018-2022)
Figure 15 Asia Pacific Hydrogen Car Revenue (USD Million) By Country (2018-2022)
Figure 16 Asia Pacific Hydrogen Car Revenue (USD Million) By Type (2018-2022)
Figure 17 Asia Pacific Hydrogen Car Revenue (USD Million) By Applications (2018-2022)
Figure 18 South America Hydrogen Car Revenue (USD Million) By Country (2018-2022)
Figure 19 South America Hydrogen Car Revenue (USD Million) By Type (2018-2022)
Figure 20 South America Hydrogen Car Revenue (USD Million) By Applications (2018-2022)
Figure 21 Middle East and Africa Hydrogen Car Revenue (USD Million) By Region (2018-2022)
Figure 22 Middle East and Africa Hydrogen Car Revenue (USD Million) By Type (2018-2022)
Figure 23 Middle East and Africa Hydrogen Car Revenue (USD Million) By Applications (2018-2022)
Figure 24 Global Hydrogen Car Revenue (USD Million) By Type (2023-2030)
Figure 25 Global Hydrogen Car Revenue Market Share (%) By Type (2030)
Figure 26 Global Hydrogen Car Revenue (USD Million) By Applications (2023-2030)
Figure 27 Global Hydrogen Car Revenue Market Share (%) By Applications (2030)
Figure 28 Global Hydrogen Car Market Revenue (USD Million) By Regions (2023-2030)
Figure 29 North America Hydrogen Car Revenue (USD Million) By Country (2023-2030)
Figure 30 North America Hydrogen Car Revenue (USD Million) By Type (2023-2030)
Figure 31 North America Hydrogen Car Revenue (USD Million) By Applications (2023-2030)
Figure 32 Europe Hydrogen Car Revenue (USD Million) By Country (2023-2030)
Figure 33 Europe Hydrogen Car Revenue (USD Million) By Type (2023-2030)
Figure 34 Europe Hydrogen Car Revenue (USD Million) By Applications (2023-2030)
Figure 35 Asia Pacific Hydrogen Car Revenue (USD Million) By Country (2023-2030)
Figure 36 Asia Pacific Hydrogen Car Revenue (USD Million) By Type (2023-2030)
Figure 37 Asia Pacific Hydrogen Car Revenue (USD Million) By Applications (2023-2030)
Figure 38 South America Hydrogen Car Revenue (USD Million) By Country (2023-2030)
Figure 39 South America Hydrogen Car Revenue (USD Million) By Type (2023-2030)
Figure 40 South America Hydrogen Car Revenue (USD Million) By Applications (2023-2030)
Figure 41 Middle East and Africa Hydrogen Car Revenue (USD Million) By Region (2023-2030)
Figure 42 Middle East and Africa Hydrogen Car Revenue (USD Million) By Region (2023-2030)
Figure 43 Middle East and Africa Hydrogen Car Revenue (USD Million) By Type (2023-2030)
Figure 44 Middle East and Africa Hydrogen Car Revenue (USD Million) By Applications (2023-2030)
Figure 45 Bottom-Up and Top-Down Approaches for This Report
Figure 46 Data Triangulation
