The Global Hydrogen Fuel Cells Market is estimated to register 22.5% growth over the forecast period from 2023 to 2030.
The market growth is driven by the increasing development of integrated hydrogen ecosystems that encompass production, storage, transportation, and utilization is a trend. Leading companies are focusing on the Transportation Sector, Green Hydrogen Production, Hydrogen Ecosystem Development, International Collaboration, Energy Storage, and others to boost market shares in the industry.
Market Overview
The hydrogen fuel cell market revolves around electrochemical devices converting hydrogen and oxygen into electricity with zero emissions, addressing environmental concerns and promoting sustainability. Key drivers include global environmental awareness, governmental support, and the push for cleaner transportation, although challenges such as hydrogen production, infrastructure development, and cost competitiveness persist. Applications span transportation, stationary power, material handling, portable electronics, and industrial uses, with ongoing growth expected as technology advances and infrastructure expand to meet demand for clean energy alternatives.
Market Dynamics
Market Trends- Companies are launching Industrial Applications to attract a consumer base
Hydrogen fuel cells find diverse industrial applications, serving as clean and efficient power sources in material handling equipment, backup power systems for critical infrastructure, remote power generation, combined heat and power setups, data centers, distributed energy systems, wastewater treatment plants, mining operations, the oil and gas industry, and rail transportation. They contribute to reducing emissions, enhancing energy efficiency, and ensuring uninterrupted operations in industrial settings, promoting sustainable and environmentally responsible energy solutions.
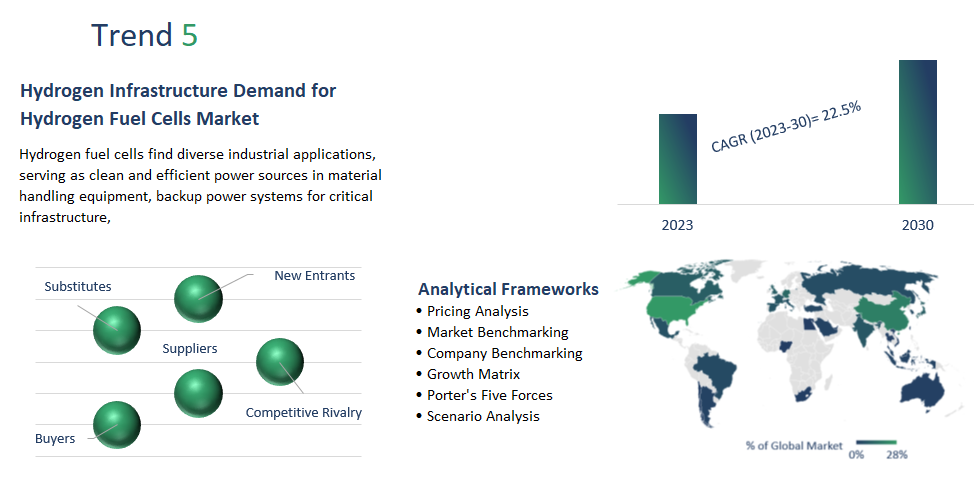
Market Driver- Hydrogen Infrastructure Demand for Hydrogen Fuel Cells Market
Hydrogen fuel cells find diverse industrial applications, serving as clean and efficient power sources in material handling equipment, backup power systems for critical infrastructure, remote power generation, combined heat and power setups, data centers, distributed energy systems, wastewater treatment plants, mining operations, the oil and gas industry, and rail transportation. They contribute to reducing emissions, enhancing energy efficiency, and ensuring uninterrupted operations in industrial settings, promoting sustainable and environmentally responsible energy solutions.
Market Opportunity-Introduction of Advancements in Technology
Advancements in technology for hydrogen fuel cells encompass improvements in fuel cell stack efficiency, materials innovation, reduced precious metal usage, system integration, hydrogen production, storage, transportation, fuel cell vehicles, infrastructure, safety measures, and renewable hydrogen production methods. These advancements are driving increased efficiency, cost-effectiveness, and environmental sustainability across various applications, from transportation to industrial processes, making hydrogen fuel cells a more competitive and practical clean energy solution.
Market Share Analysis- proton exchange membrane fuel cells Hydrogen Fuel Cells Market will register the fastest growth
The Global Hydrogen Fuel Cells Market is analyzed across proton exchange membrane fuel cells, Phosphoric Acid Fuel Cells, Solid Oxide Fuel Cells, Molten Carbonate Fuel Cells, and others. Of these, proton exchange membrane fuel cells will register the fastest growth. Proton Exchange Membrane Fuel Cells (PEMFCs) are integral to the hydrogen fuel cell market, known for their high-power density and quick start-up. Primarily used in fuel cell vehicles (FCVs) due to their efficiency and compact design, PEMFCs also have applications in portable power devices, backup power systems, and small-scale stationary power generation.
Market Share Analysis- Stationary held a significant market share in 2023
The Global Hydrogen Fuel Cells Market is analyzed across various applications including Stationary, Transportation, Portable, and others. Of these, Stationary held a significant market share in 2023. Stationary applications in the hydrogen fuel cell market involve the use of fuel cells for stationary power generation, including backup power for critical facilities, distributed energy systems, combined heat and power (CHP), microgrids, remote power generation, residential heating, industrial and commercial facilities, wastewater treatment, and remote telecommunications.
Hydrogen Fuel Cells Market Segmentation
By Type
- Proton Exchange Membrane Fuel cells
- Phosphoric Acid Fuel Cells
- Solid Oxide Fuel Cells
- Molten Carbonate Fuel Cells
- Others
By Application
By End User
- Fuel Cell Vehicles
- Utilities
- Defense
- Others
By Region
- North America (United States, Canada, Mexico)
- Europe (Germany, France, United Kingdom, Spain, Italy, Others)
- Asia Pacific (China, India, Japan, South Korea, Australia, Others)
- Latin America (Brazil, Argentina, Others)
- Middle East and Africa (Saudi Arabia, UAE, Kuwait, Other Middle East, South Africa, Nigeria, Other Africa)
Hydrogen Fuel Cells Market Companies
- Ballard Power Systems Inc
- Intelligent Energy
- Nedstack Fuel Cell Technology
- Plug Power Inc
- Doosan Fuel Cell Co. Ltd
- SFC Energy AG
- ITM Power Plc
- Ceres
- AFC Energy
- Fuel Cell Energy Inc
- McPhy Energy SA
- Bloom Energy
* List not exhaustive
Hydrogen Fuel Cells Market Outlook 2023
1 Market Overview
1.1 Introduction to the Hydrogen Fuel Cells Market
1.2 Scope of the Study
1.3 Research Objective
1.3.1 Key Market Scope and Segments
1.3.2 Players Covered
1.3.3 Years Considered
2 Executive Summary
2.1 2023 Hydrogen Fuel Cells Industry- Market Statistics
3 Market Dynamics
3.1 Market Drivers
3.2 Market Challenges
3.3 Market Opportunities
3.4 Market Trends
4 Market Factor Analysis
4.1 Porter’s Five Forces
4.2 Market Entropy
4.2.1 Global Hydrogen Fuel Cells Market Companies with Area Served
4.2.2 Products Offerings Global Hydrogen Fuel Cells Market
5 COVID-19 Impact Analysis and Outlook Scenarios
5.1.1 Covid-19 Impact Analysis
5.1.2 Post-COVID-19 Scenario- Low Growth Case
5.1.3 Post-COVID-19 Scenario- Reference Growth Case
5.1.4 Post-COVID-19 Scenario- Low Growth Case
6 Global Hydrogen Fuel Cells Market Trends
6.1 Global Hydrogen Fuel Cells Revenue (USD Million) and CAGR (%) by Type (2018-2030)
6.2 Global Hydrogen Fuel Cells Revenue (USD Million) and CAGR (%) by Applications (2018-2030)
6.3 Global Hydrogen Fuel Cells Revenue (USD Million) and CAGR (%) by Regions (2018-2030)
7 Global Hydrogen Fuel Cells Market Revenue (USD Million) by Type, and Applications (2018-2022)
7.1 Global Hydrogen Fuel Cells Revenue (USD Million) by Type (2018-2022)
7.1.1 Global Hydrogen Fuel Cells Revenue (USD Million), Market Share (%) by Type (2018-2022)
7.2 Global Hydrogen Fuel Cells Revenue (USD Million) by Applications (2018-2022)
7.2.1 Global Hydrogen Fuel Cells Revenue (USD Million), Market Share (%) by Applications (2018-2022)
8 Global Hydrogen Fuel Cells Development Regional Status and Outlook
8.1 Global Hydrogen Fuel Cells Revenue (USD Million) By Regions (2018-2022)
8.2 North America Hydrogen Fuel Cells Revenue (USD Million) by Type, and Application (2018-2022)
8.2.1 North America Hydrogen Fuel Cells Revenue (USD Million) by Country (2018-2022)
8.2.2 North America Hydrogen Fuel Cells Revenue (USD Million) by Type (2018-2022)
8.2.3 North America Hydrogen Fuel Cells Revenue (USD Million) by Applications (2018-2022)
8.3 Europe Hydrogen Fuel Cells Revenue (USD Million), by Type, and Applications (USD Million) (2018-2022)
8.3.1 Europe Hydrogen Fuel Cells Revenue (USD Million), by Country (2018-2022)
8.3.2 Europe Hydrogen Fuel Cells Revenue (USD Million) by Type (2018-2022)
8.3.3 Europe Hydrogen Fuel Cells Revenue (USD Million) by Applications (2018-2022)
8.4 Asia Pacific Hydrogen Fuel Cells Revenue (USD Million), and Revenue (USD Million) by Type, and Applications (2018-2022)
8.4.1 Asia Pacific Hydrogen Fuel Cells Revenue (USD Million) by Country (2018-2022)
8.4.2 Asia Pacific Hydrogen Fuel Cells Revenue (USD Million) by Type (2018-2022)
8.4.3 Asia Pacific Hydrogen Fuel Cells Revenue (USD Million) by Applications (2018-2022)
8.5 South America Hydrogen Fuel Cells Revenue (USD Million), by Type, and Applications (2018-2022)
8.5.1 South America Hydrogen Fuel Cells Revenue (USD Million), by Country (2018-2022)
8.5.2 South America Hydrogen Fuel Cells Revenue (USD Million) by Type (2018-2022)
8.5.3 South America Hydrogen Fuel Cells Revenue (USD Million) by Applications (2018-2022)
8.6 Middle East and Africa Hydrogen Fuel Cells Revenue (USD Million), by Type, Technology, Application, Thickness (2018-2022)
8.6.1 Middle East and Africa Hydrogen Fuel Cells Revenue (USD Million) by Country (2018-2022)
8.6.2 Middle East and Africa Hydrogen Fuel Cells Revenue (USD Million) by Type (2018-2022)
8.6.3 Middle East and Africa Hydrogen Fuel Cells Revenue (USD Million) by Applications (2018-2022)
9 Company Profiles
10 Global Hydrogen Fuel Cells Market Revenue (USD Million), by Type, and Applications (2023-2030)
10.1 Global Hydrogen Fuel Cells Revenue (USD Million) and Market Share (%) by Type (2023-2030)
10.1.1 Global Hydrogen Fuel Cells Revenue (USD Million), and Market Share (%) by Type (2023-2030)
10.2 Global Hydrogen Fuel Cells Revenue (USD Million) and Market Share (%) by Applications (2023-2030)
10.2.1 Global Hydrogen Fuel Cells Revenue (USD Million), and Market Share (%) by Applications (2023-2030)
11 Global Hydrogen Fuel Cells Development Regional Status and Outlook Forecast
11.1 Global Hydrogen Fuel Cells Revenue (USD Million) By Regions (2023-2030)
11.2 North America Hydrogen Fuel Cells Revenue (USD Million) by Type, and Applications (2023-2030)
11.2.1 North America Hydrogen Fuel Cells Revenue (USD) Million by Country (2023-2030)
11.2.2 North America Hydrogen Fuel Cells Revenue (USD Million), by Type (2023-2030)
11.2.3 North America Hydrogen Fuel Cells Revenue (USD Million), Market Share (%) by Applications (2023-2030)
11.3 Europe Hydrogen Fuel Cells Revenue (USD Million), by Type, and Applications (2023-2030)
11.3.1 Europe Hydrogen Fuel Cells Revenue (USD Million), by Country (2023-2030)
11.3.2 Europe Hydrogen Fuel Cells Revenue (USD Million), by Type (2023-2030)
11.3.3 Europe Hydrogen Fuel Cells Revenue (USD Million), by Applications (2023-2030)
11.4 Asia Pacific Hydrogen Fuel Cells Revenue (USD Million) by Type, and Applications (2023-2030)
11.4.1 Asia Pacific Hydrogen Fuel Cells Revenue (USD Million), by Country (2023-2030)
11.4.2 Asia Pacific Hydrogen Fuel Cells Revenue (USD Million), by Type (2023-2030)
11.4.3 Asia Pacific Hydrogen Fuel Cells Revenue (USD Million), by Applications (2023-2030)
11.5 South America Hydrogen Fuel Cells Revenue (USD Million), by Type, and Applications (2023-2030)
11.5.1 South America Hydrogen Fuel Cells Revenue (USD Million), by Country (2023-2030)
11.5.2 South America Hydrogen Fuel Cells Revenue (USD Million), by Type (2023-2030)
11.5.3 South America Hydrogen Fuel Cells Revenue (USD Million), by Applications (2023-2030)
11.6 Middle East and Africa Hydrogen Fuel Cells Revenue (USD Million), by Type, and Applications (2023-2030)
11.6.1 Middle East and Africa Hydrogen Fuel Cells Revenue (USD Million), by Region (2023-2030)
11.6.2 Middle East and Africa Hydrogen Fuel Cells Revenue (USD Million), by Type (2023-2030)
11.6.3 Middle East and Africa Hydrogen Fuel Cells Revenue (USD Million), by Applications (2023-2030)
12 Methodology and Data Sources
12.1 Methodology/Research Approach
12.1.1 Research Programs/Design
12.1.2 Market Size Estimation
12.1.3 Market Breakdown and Data Triangulation
12.2 Data Sources
12.2.1 Secondary Sources
12.2.2 Primary Sources
12.3 Disclaimer
List of Tables
Table 1 Market Segmentation Analysis
Table 2 Global Hydrogen Fuel Cells Market Companies with Areas Served
Table 3 Products Offerings Global Hydrogen Fuel Cells Market
Table 4 Low Growth Scenario Forecasts
Table 5 Reference Case Growth Scenario
Table 6 High Growth Case Scenario
Table 7 Global Hydrogen Fuel Cells Revenue (USD Million) And CAGR (%) By Type (2018-2030)
Table 8 Global Hydrogen Fuel Cells Revenue (USD Million) And CAGR (%) By Applications (2018-2030)
Table 9 Global Hydrogen Fuel Cells Revenue (USD Million) And CAGR (%) By Regions (2018-2030)
Table 10 Global Hydrogen Fuel Cells Revenue (USD Million) By Type (2018-2022)
Table 11 Global Hydrogen Fuel Cells Revenue Market Share (%) By Type (2018-2022)
Table 12 Global Hydrogen Fuel Cells Revenue (USD Million) By Applications (2018-2022)
Table 13 Global Hydrogen Fuel Cells Revenue Market Share (%) By Applications (2018-2022)
Table 14 Global Hydrogen Fuel Cells Market Revenue (USD Million) By Regions (2018-2022)
Table 15 Global Hydrogen Fuel Cells Market Share (%) By Regions (2018-2022)
Table 16 North America Hydrogen Fuel Cells Revenue (USD Million) By Country (2018-2022)
Table 17 North America Hydrogen Fuel Cells Revenue (USD Million) By Type (2018-2022)
Table 18 North America Hydrogen Fuel Cells Revenue (USD Million) By Applications (2018-2022)
Table 19 Europe Hydrogen Fuel Cells Revenue (USD Million) By Country (2018-2022)
Table 20 Europe Hydrogen Fuel Cells Revenue (USD Million) By Type (2018-2022)
Table 21 Europe Hydrogen Fuel Cells Revenue (USD Million) By Applications (2018-2022)
Table 22 Asia Pacific Hydrogen Fuel Cells Revenue (USD Million) By Country (2018-2022)
Table 23 Asia Pacific Hydrogen Fuel Cells Revenue (USD Million) By Type (2018-2022)
Table 24 Asia Pacific Hydrogen Fuel Cells Revenue (USD Million) By Applications (2018-2022)
Table 25 South America Hydrogen Fuel Cells Revenue (USD Million) By Country (2018-2022)
Table 26 South America Hydrogen Fuel Cells Revenue (USD Million) By Type (2018-2022)
Table 27 South America Hydrogen Fuel Cells Revenue (USD Million) By Applications (2018-2022)
Table 28 Middle East and Africa Hydrogen Fuel Cells Revenue (USD Million) By Region (2018-2022)
Table 29 Middle East and Africa Hydrogen Fuel Cells Revenue (USD Million) By Type (2018-2022)
Table 30 Middle East and Africa Hydrogen Fuel Cells Revenue (USD Million) By Applications (2018-2022)
Table 31 Financial Analysis
Table 32 Global Hydrogen Fuel Cells Revenue (USD Million) By Type (2023-2030)
Table 33 Global Hydrogen Fuel Cells Revenue Market Share (%) By Type (2023-2030)
Table 34 Global Hydrogen Fuel Cells Revenue (USD Million) By Applications (2023-2030)
Table 35 Global Hydrogen Fuel Cells Revenue Market Share (%) By Applications (2023-2030)
Table 36 Global Hydrogen Fuel Cells Market Revenue (USD Million), And Revenue (USD Million) By Regions (2023-2030)
Table 37 North America Hydrogen Fuel Cells Revenue (USD)By Country (2023-2030)
Table 38 North America Hydrogen Fuel Cells Revenue (USD Million) By Type (2023-2030)
Table 39 North America Hydrogen Fuel Cells Revenue (USD Million) By Applications (2023-2030)
Table 40 Europe Hydrogen Fuel Cells Revenue (USD Million) By Country (2023-2030)
Table 41 Europe Hydrogen Fuel Cells Revenue (USD Million) By Type (2023-2030)
Table 42 Europe Hydrogen Fuel Cells Revenue (USD Million) By Applications (2023-2030)
Table 43 Asia Pacific Hydrogen Fuel Cells Revenue (USD Million) By Country (2023-2030)
Table 44 Asia Pacific Hydrogen Fuel Cells Revenue (USD Million) By Type (2023-2030)
Table 45 Asia Pacific Hydrogen Fuel Cells Revenue (USD Million) By Applications (2023-2030)
Table 46 South America Hydrogen Fuel Cells Revenue (USD Million) By Country (2023-2030)
Table 47 South America Hydrogen Fuel Cells Revenue (USD Million) By Type (2023-2030)
Table 48 South America Hydrogen Fuel Cells Revenue (USD Million) By Applications (2023-2030)
Table 49 Middle East and Africa Hydrogen Fuel Cells Revenue (USD Million) By Region (2023-2030)
Table 50 Middle East and Africa Hydrogen Fuel Cells Revenue (USD Million) By Region (2023-2030)
Table 51 Middle East and Africa Hydrogen Fuel Cells Revenue (USD Million) By Type (2023-2030)
Table 52 Middle East and Africa Hydrogen Fuel Cells Revenue (USD Million) By Applications (2023-2030)
Table 53 Research Programs/Design for This Report
Table 54 Key Data Information from Secondary Sources
Table 55 Key Data Information from Primary Sources
List of Figures
Figure 1 Market Scope
Figure 2 Porter’s Five Forces
Figure 3 Global Hydrogen Fuel Cells Revenue (USD Million) By Type (2018-2022)
Figure 4 Global Hydrogen Fuel Cells Revenue Market Share (%) By Type (2022)
Figure 5 Global Hydrogen Fuel Cells Revenue (USD Million) By Applications (2018-2022)
Figure 6 Global Hydrogen Fuel Cells Revenue Market Share (%) By Applications (2022)
Figure 7 Global Hydrogen Fuel Cells Market Revenue (USD Million) By Regions (2018-2022)
Figure 8 Global Hydrogen Fuel Cells Market Share (%) By Regions (2022)
Figure 9 North America Hydrogen Fuel Cells Revenue (USD Million) By Country (2018-2022)
Figure 10 North America Hydrogen Fuel Cells Revenue (USD Million) By Type (2018-2022)
Figure 11 North America Hydrogen Fuel Cells Revenue (USD Million) By Applications (2018-2022)
Figure 12 Europe Hydrogen Fuel Cells Revenue (USD Million) By Country (2018-2022)
Figure 13 Europe Hydrogen Fuel Cells Revenue (USD Million) By Type (2018-2022)
Figure 14 Europe Hydrogen Fuel Cells Revenue (USD Million) By Applications (2018-2022)
Figure 15 Asia Pacific Hydrogen Fuel Cells Revenue (USD Million) By Country (2018-2022)
Figure 16 Asia Pacific Hydrogen Fuel Cells Revenue (USD Million) By Type (2018-2022)
Figure 17 Asia Pacific Hydrogen Fuel Cells Revenue (USD Million) By Applications (2018-2022)
Figure 18 South America Hydrogen Fuel Cells Revenue (USD Million) By Country (2018-2022)
Figure 19 South America Hydrogen Fuel Cells Revenue (USD Million) By Type (2018-2022)
Figure 20 South America Hydrogen Fuel Cells Revenue (USD Million) By Applications (2018-2022)
Figure 21 Middle East and Africa Hydrogen Fuel Cells Revenue (USD Million) By Region (2018-2022)
Figure 22 Middle East and Africa Hydrogen Fuel Cells Revenue (USD Million) By Type (2018-2022)
Figure 23 Middle East and Africa Hydrogen Fuel Cells Revenue (USD Million) By Applications (2018-2022)
Figure 24 Global Hydrogen Fuel Cells Revenue (USD Million) By Type (2023-2030)
Figure 25 Global Hydrogen Fuel Cells Revenue Market Share (%) By Type (2030)
Figure 26 Global Hydrogen Fuel Cells Revenue (USD Million) By Applications (2023-2030)
Figure 27 Global Hydrogen Fuel Cells Revenue Market Share (%) By Applications (2030)
Figure 28 Global Hydrogen Fuel Cells Market Revenue (USD Million) By Regions (2023-2030)
Figure 29 North America Hydrogen Fuel Cells Revenue (USD Million) By Country (2023-2030)
Figure 30 North America Hydrogen Fuel Cells Revenue (USD Million) By Type (2023-2030)
Figure 31 North America Hydrogen Fuel Cells Revenue (USD Million) By Applications (2023-2030)
Figure 32 Europe Hydrogen Fuel Cells Revenue (USD Million) By Country (2023-2030)
Figure 33 Europe Hydrogen Fuel Cells Revenue (USD Million) By Type (2023-2030)
Figure 34 Europe Hydrogen Fuel Cells Revenue (USD Million) By Applications (2023-2030)
Figure 35 Asia Pacific Hydrogen Fuel Cells Revenue (USD Million) By Country (2023-2030)
Figure 36 Asia Pacific Hydrogen Fuel Cells Revenue (USD Million) By Type (2023-2030)
Figure 37 Asia Pacific Hydrogen Fuel Cells Revenue (USD Million) By Applications (2023-2030)
Figure 38 South America Hydrogen Fuel Cells Revenue (USD Million) By Country (2023-2030)
Figure 39 South America Hydrogen Fuel Cells Revenue (USD Million) By Type (2023-2030)
Figure 40 South America Hydrogen Fuel Cells Revenue (USD Million) By Applications (2023-2030)
Figure 41 Middle East and Africa Hydrogen Fuel Cells Revenue (USD Million) By Region (2023-2030)
Figure 42 Middle East and Africa Hydrogen Fuel Cells Revenue (USD Million) By Region (2023-2030)
Figure 43 Middle East and Africa Hydrogen Fuel Cells Revenue (USD Million) By Type (2023-2030)
Figure 44 Middle East and Africa Hydrogen Fuel Cells Revenue (USD Million) By Applications (2023-2030)
Figure 45 Bottom-Up and Top-Down Approaches For This Report
Figure 46 Data Triangulation
