
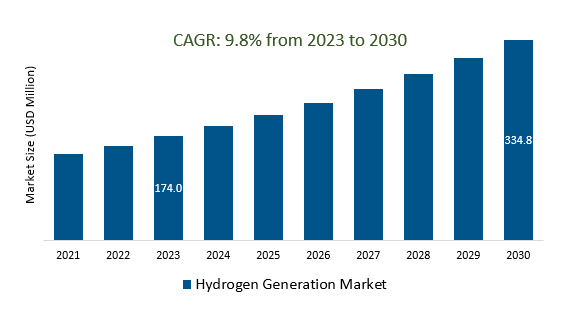
The global Hydrogen Generation Market Size is estimated to be US$ 174.0 Billion in 2023 and is poised to register 9.8% growth over the forecast period from 2023 to 2030 to reach US $ 334.8 billion in 2030.
The market growth is driven predominantly by increasing toward cleaner and more sustainable energy sources is driving interest in hydrogen as a clean fuel option, especially for sectors that are hard to electrify directly. Leading companies focusing on Green Hydrogen Dominance, Energy Storage Solutions, Transportation Revolution, Power Generation, Technological Advancement, and others to boost market shares in the industry.
The hydrogen generation market is undergoing rapid growth driven by global clean energy initiatives and decarbonization goals. Green hydrogen produced through electrolysis powered by renewable energy sources is gaining traction, with applications in transportation, industry, power generation, and energy storage including industrial gas companies, electrolyzer manufacturers, energy firms, and automakers. Challenges include cost competitiveness, infrastructure development, energy efficiency, storage, and scaling up production. The market's evolution is dynamic, with ongoing technological advancements and policy support shaping its future trajectory.
Green hydrogen's emergence as a clean energy solution, produced through renewable-powered electrolysis, is reshaping the hydrogen generation market by reducing emissions and aligning with sustainability goals. Its applications span industries, energy storage, and transportation, while supportive policies, infrastructure investments, and global collaborations are accelerating its growth. As costs decrease and technology advances, green hydrogen's pivotal role in decarbonization and energy transition is driving innovation and shaping the market's trajectory.
Advancements in electrolysis technology are pivotal in reshaping the hydrogen generation market, boosting efficiency, reducing costs, and enabling seamless integration with renewable energy sources. Improved materials, scalability, durability, and modularity are driving the development of more efficient and cost-effective electrolyzers, essential for producing high-purity hydrogen across industries and remote applications while contributing to the overall transition towards sustainable energy solutions.
Industrial applications are a driving force in the hydrogen generation market, encompassing ammonia production, refining, steel manufacturing, chemicals, electronics, and more. Hydrogen's versatility serves as a crucial feedstock for processes like ammonia synthesis, refining desulfurization, and methanol production, while also enabling emissions reduction, compliance with regulations, and cleaner operations in various industries, contributing to sustainable practices and environmental goals.
The global Hydrogen Generation Market is analyzed across Steam Methane Reforming, Coal Gasification, and Others. Of these, Steam Methane Reforming is poised to register the fastest growth. Steam Methane Reforming (SMR) holds a central position in the hydrogen generation market as a widely used method that produces hydrogen by reacting natural gas with steam. Despite its established role and high-purity hydrogen output, SMR emits carbon dioxide, posing an environmental challenge. Solutions like carbon capture and storage (CCS) can mitigate its emissions, while transitioning to greener methods remains vital for a more sustainable hydrogen production landscape, especially in the context of the global push for cleaner energy solutions.
The global Hydrogen Generation Market is analyzed across a wide range of applications including Methanol production, Ammonia Production, Petroleum Refining, Transportation, Power Generation, and Others. Of these, Transportation held a significant market share in 2023. Transportation is a critical factor in the hydrogen generation market, encompassing hydrogen's role as a fuel for fuel cell vehicles, heavy-duty transport, and energy storage in aviation and shipping. Hydrogen-powered vehicles offer emissions reduction and longer ranges, necessitating the development of hydrogen refueling infrastructure. Global collaboration is driving advancements, while challenges include cost reduction, infrastructure expansion, and energy efficiency improvements. Hydrogen's potential in trains, maritime applications, and aviation highlights its versatility as a sustainable transportation solution amidst the push for emissions reduction and cleaner mobility.
By Technology
By Application
By System
By Source
By Region
* List not exhaustive
Hydrogen Generation Market Outlook 2023
1 Market Overview
1.1 Introduction to Hydrogen Generation Market
1.2 Scope of the Study
1.3 Research Objective
1.3.1 Key Market Scope and Segments
1.3.2 Players Covered
1.3.3 Years Considered
2 Executive Summary
2.1 2023 Hydrogen Generation Industry- Market Statistics
3 Market Dynamics
3.1 Market Drivers
3.2 Market Challenges
3.3 Market Opportunities
3.4 Market Trends
4 Market Factor Analysis
4.1 Porter’s Five Forces
4.2 Market Entropy
4.2.1 Global Hydrogen Generation Market Companies with Area Served
4.2.2 Products Offerings Global Hydrogen Generation Market
5 COVID-19 Impact Analysis and Outlook Scenarios
5.1.1 Covid-19 Impact Analysis
5.1.2 Post-COVID-19 Scenario- Low Growth Case
5.1.3 Post-COVID-19 Scenario- Reference Growth Case
5.1.4 Post-COVID-19 Scenario- Low Growth Case
6 Global Hydrogen Generation Market Trends
6.1 Global Hydrogen Generation Revenue (USD Million) and CAGR (%) by Type (2018-2028)
6.2 Global Hydrogen Generation Revenue (USD Million) and CAGR (%) by Applications (2018-2028)
6.3 Global Hydrogen Generation Revenue (USD Million) and CAGR (%) by Regions (2018-2028)
7 Global Hydrogen Generation Market Revenue (USD Million) by Type, and Applications (2018-2022)
7.1 Global Hydrogen Generation Revenue (USD Million) by Type (2018-2022)
7.1.1 Global Hydrogen Generation Revenue (USD Million), Market Share (%) by Type (2018-2022)
7.2 Global Hydrogen Generation Revenue (USD Million) by Applications (2018-2022)
7.2.1 Global Hydrogen Generation Revenue (USD Million), Market Share (%) by Applications (2018-2022)
8 Global Hydrogen Generation Development Regional Status and Outlook
8.1 Global Hydrogen Generation Revenue (USD Million) By Regions (2018-2022)
8.2 North America Hydrogen Generation Revenue (USD Million) by Type, and Application (2018-2022)
8.2.1 North America Hydrogen Generation Revenue (USD Million) by Country (2018-2022)
8.2.2 North America Hydrogen Generation Revenue (USD Million) by Type (2018-2022)
8.2.3 North America Hydrogen Generation Revenue (USD Million) by Applications (2018-2022)
8.3 Europe Hydrogen Generation Revenue (USD Million), by Type, and Applications (USD Million) (2018-2022)
8.3.1 Europe Hydrogen Generation Revenue (USD Million), by Country (2018-2022)
8.3.2 Europe Hydrogen Generation Revenue (USD Million) by Type (2018-2022)
8.3.3 Europe Hydrogen Generation Revenue (USD Million) by Applications (2018-2022)
8.4 Asia Pacific Hydrogen Generation Revenue (USD Million), and Revenue (USD Million) by Type, and Applications (2018-2022)
8.4.1 Asia Pacific Hydrogen Generation Revenue (USD Million) by Country (2018-2022)
8.4.2 Asia Pacific Hydrogen Generation Revenue (USD Million) by Type (2018-2022)
8.4.3 Asia Pacific Hydrogen Generation Revenue (USD Million) by Applications (2018-2022)
8.5 South America Hydrogen Generation Revenue (USD Million), by Type, and Applications (2018-2022)
8.5.1 South America Hydrogen Generation Revenue (USD Million), by Country (2018-2022)
8.5.2 South America Hydrogen Generation Revenue (USD Million) by Type (2018-2022)
8.5.3 South America Hydrogen Generation Revenue (USD Million) by Applications (2018-2022)
8.6 Middle East and Africa Hydrogen Generation Revenue (USD Million), by Type, Technology, Application, Thickness (2018-2022)
8.6.1 Middle East and Africa Hydrogen Generation Revenue (USD Million) by Country (2018-2022)
8.6.2 Middle East and Africa Hydrogen Generation Revenue (USD Million) by Type (2018-2022)
8.6.3 Middle East and Africa Hydrogen Generation Revenue (USD Million) by Applications (2018-2022)
9 Company Profiles
10 Global Hydrogen Generation Market Revenue (USD Million), by Type, and Applications (2023-2028)
10.1 Global Hydrogen Generation Revenue (USD Million) and Market Share (%) by Type (2023-2028)
10.1.1 Global Hydrogen Generation Revenue (USD Million), and Market Share (%) by Type (2023-2028)
10.2 Global Hydrogen Generation Revenue (USD Million) and Market Share (%) by Applications (2023-2028)
10.2.1 Global Hydrogen Generation Revenue (USD Million), and Market Share (%) by Applications (2023-2028)
11 Global Hydrogen Generation Development Regional Status and Outlook Forecast
11.1 Global Hydrogen Generation Revenue (USD Million) By Regions (2023-2028)
11.2 North America Hydrogen Generation Revenue (USD Million) by Type, and Applications (2023-2028)
11.2.1 North America Hydrogen Generation Revenue (USD) Million by Country (2023-2028)
11.2.2 North America Hydrogen Generation Revenue (USD Million), by Type (2023-2028)
11.2.3 North America Hydrogen Generation Revenue (USD Million), Market Share (%) by Applications (2023-2028)
11.3 Europe Hydrogen Generation Revenue (USD Million), by Type, and Applications (2023-2028)
11.3.1 Europe Hydrogen Generation Revenue (USD Million), by Country (2023-2028)
11.3.2 Europe Hydrogen Generation Revenue (USD Million), by Type (2023-2028)
11.3.3 Europe Hydrogen Generation Revenue (USD Million), by Applications (2023-2028)
11.4 Asia Pacific Hydrogen Generation Revenue (USD Million) by Type, and Applications (2023-2028)
11.4.1 Asia Pacific Hydrogen Generation Revenue (USD Million), by Country (2023-2028)
11.4.2 Asia Pacific Hydrogen Generation Revenue (USD Million), by Type (2023-2028)
11.4.3 Asia Pacific Hydrogen Generation Revenue (USD Million), by Applications (2023-2028)
11.5 South America Hydrogen Generation Revenue (USD Million), by Type, and Applications (2023-2028)
11.5.1 South America Hydrogen Generation Revenue (USD Million), by Country (2023-2028)
11.5.2 South America Hydrogen Generation Revenue (USD Million), by Type (2023-2028)
11.5.3 South America Hydrogen Generation Revenue (USD Million), by Applications (2023-2028)
11.6 Middle East and Africa Hydrogen Generation Revenue (USD Million), by Type, and Applications (2023-2028)
11.6.1 Middle East and Africa Hydrogen Generation Revenue (USD Million), by Region (2023-2028)
11.6.2 Middle East and Africa Hydrogen Generation Revenue (USD Million), by Type (2023-2028)
11.6.3 Middle East and Africa Hydrogen Generation Revenue (USD Million), by Applications (2023-2028)
12 Methodology and Data Sources
12.1 Methodology/Research Approach
12.1.1 Research Programs/Design
12.1.2 Market Size Estimation
12.1.3 Market Breakdown and Data Triangulation
12.2 Data Sources
12.2.1 Secondary Sources
12.2.2 Primary Sources
12.3 Disclaimer
List Of Tables
Table 1 Market Segmentation Analysis
Table 2 Global Hydrogen Generation Market Companies with Areas Served
Table 3 Products Offerings Global Hydrogen Generation Market
Table 4 Low Growth Scenario Forecasts
Table 5 Reference Case Growth Scenario
Table 6 High Growth Case Scenario
Table 7 Global Hydrogen Generation Revenue (USD Million) And CAGR (%) By Type (2018-2028)
Table 8 Global Hydrogen Generation Revenue (USD Million) And CAGR (%) By Applications (2018-2028)
Table 9 Global Hydrogen Generation Revenue (USD Million) And CAGR (%) By Regions (2018-2028)
Table 10 Global Hydrogen Generation Revenue (USD Million) By Type (2018-2022)
Table 11 Global Hydrogen Generation Revenue Market Share (%) By Type (2018-2022)
Table 12 Global Hydrogen Generation Revenue (USD Million) By Applications (2018-2022)
Table 13 Global Hydrogen Generation Revenue Market Share (%) By Applications (2018-2022)
Table 14 Global Hydrogen Generation Market Revenue (USD Million) By Regions (2018-2022)
Table 15 Global Hydrogen Generation Market Share (%) By Regions (2018-2022)
Table 16 North America Hydrogen Generation Revenue (USD Million) By Country (2018-2022)
Table 17 North America Hydrogen Generation Revenue (USD Million) By Type (2018-2022)
Table 18 North America Hydrogen Generation Revenue (USD Million) By Applications (2018-2022)
Table 19 Europe Hydrogen Generation Revenue (USD Million) By Country (2018-2022)
Table 20 Europe Hydrogen Generation Revenue (USD Million) By Type (2018-2022)
Table 21 Europe Hydrogen Generation Revenue (USD Million) By Applications (2018-2022)
Table 22 Asia Pacific Hydrogen Generation Revenue (USD Million) By Country (2018-2022)
Table 23 Asia Pacific Hydrogen Generation Revenue (USD Million) By Type (2018-2022)
Table 24 Asia Pacific Hydrogen Generation Revenue (USD Million) By Applications (2018-2022)
Table 25 South America Hydrogen Generation Revenue (USD Million) By Country (2018-2022)
Table 26 South America Hydrogen Generation Revenue (USD Million) By Type (2018-2022)
Table 27 South America Hydrogen Generation Revenue (USD Million) By Applications (2018-2022)
Table 28 Middle East and Africa Hydrogen Generation Revenue (USD Million) By Region (2018-2022)
Table 29 Middle East and Africa Hydrogen Generation Revenue (USD Million) By Type (2018-2022)
Table 30 Middle East and Africa Hydrogen Generation Revenue (USD Million) By Applications (2018-2022)
Table 31 Financial Analysis
Table 32 Global Hydrogen Generation Revenue (USD Million) By Type (2023-2028)
Table 33 Global Hydrogen Generation Revenue Market Share (%) By Type (2023-2028)
Table 34 Global Hydrogen Generation Revenue (USD Million) By Applications (2023-2028)
Table 35 Global Hydrogen Generation Revenue Market Share (%) By Applications (2023-2028)
Table 36 Global Hydrogen Generation Market Revenue (USD Million), And Revenue (USD Million) By Regions (2023-2028)
Table 37 North America Hydrogen Generation Revenue (USD)By Country (2023-2028)
Table 38 North America Hydrogen Generation Revenue (USD Million) By Type (2023-2028)
Table 39 North America Hydrogen Generation Revenue (USD Million) By Applications (2023-2028)
Table 40 Europe Hydrogen Generation Revenue (USD Million) By Country (2023-2028)
Table 41 Europe Hydrogen Generation Revenue (USD Million) By Type (2023-2028)
Table 42 Europe Hydrogen Generation Revenue (USD Million) By Applications (2023-2028)
Table 43 Asia Pacific Hydrogen Generation Revenue (USD Million) By Country (2023-2028)
Table 44 Asia Pacific Hydrogen Generation Revenue (USD Million) By Type (2023-2028)
Table 45 Asia Pacific Hydrogen Generation Revenue (USD Million) By Applications (2023-2028)
Table 46 South America Hydrogen Generation Revenue (USD Million) By Country (2023-2028)
Table 47 South America Hydrogen Generation Revenue (USD Million) By Type (2023-2028)
Table 48 South America Hydrogen Generation Revenue (USD Million) By Applications (2023-2028)
Table 49 Middle East and Africa Hydrogen Generation Revenue (USD Million) By Region (2023-2028)
Table 50 Middle East and Africa Hydrogen Generation Revenue (USD Million) By Region (2023-2028)
Table 51 Middle East and Africa Hydrogen Generation Revenue (USD Million) By Type (2023-2028)
Table 52 Middle East and Africa Hydrogen Generation Revenue (USD Million) By Applications (2023-2028)
Table 53 Research Programs/Design for This Report
Table 54 Key Data Information from Secondary Sources
Table 55 Key Data Information from Primary Sources
List Of Figures
Figure 1 Market Scope
Figure 2 Porter’s Five Forces
Figure 3 Global Hydrogen Generation Revenue (USD Million) By Type (2018-2022)
Figure 4 Global Hydrogen Generation Revenue Market Share (%) By Type (2022)
Figure 5 Global Hydrogen Generation Revenue (USD Million) By Applications (2018-2022)
Figure 6 Global Hydrogen Generation Revenue Market Share (%) By Applications (2022)
Figure 7 Global Hydrogen Generation Market Revenue (USD Million) By Regions (2018-2022)
Figure 8 Global Hydrogen Generation Market Share (%) By Regions (2022)
Figure 9 North America Hydrogen Generation Revenue (USD Million) By Country (2018-2022)
Figure 10 North America Hydrogen Generation Revenue (USD Million) By Type (2018-2022)
Figure 11 North America Hydrogen Generation Revenue (USD Million) By Applications (2018-2022)
Figure 12 Europe Hydrogen Generation Revenue (USD Million) By Country (2018-2022)
Figure 13 Europe Hydrogen Generation Revenue (USD Million) By Type (2018-2022)
Figure 14 Europe Hydrogen Generation Revenue (USD Million) By Applications (2018-2022)
Figure 15 Asia Pacific Hydrogen Generation Revenue (USD Million) By Country (2018-2022)
Figure 16 Asia Pacific Hydrogen Generation Revenue (USD Million) By Type (2018-2022)
Figure 17 Asia Pacific Hydrogen Generation Revenue (USD Million) By Applications (2018-2022)
Figure 18 South America Hydrogen Generation Revenue (USD Million) By Country (2018-2022)
Figure 19 South America Hydrogen Generation Revenue (USD Million) By Type (2018-2022)
Figure 20 South America Hydrogen Generation Revenue (USD Million) By Applications (2018-2022)
Figure 21 Middle East and Africa Hydrogen Generation Revenue (USD Million) By Region (2018-2022)
Figure 22 Middle East and Africa Hydrogen Generation Revenue (USD Million) By Type (2018-2022)
Figure 23 Middle East and Africa Hydrogen Generation Revenue (USD Million) By Applications (2018-2022)
Figure 24 Global Hydrogen Generation Revenue (USD Million) By Type (2023-2028)
Figure 25 Global Hydrogen Generation Revenue Market Share (%) By Type (2028)
Figure 26 Global Hydrogen Generation Revenue (USD Million) By Applications (2023-2028)
Figure 27 Global Hydrogen Generation Revenue Market Share (%) By Applications (2028)
Figure 28 Global Hydrogen Generation Market Revenue (USD Million) By Regions (2023-2028)
Figure 29 North America Hydrogen Generation Revenue (USD Million) By Country (2023-2028)
Figure 30 North America Hydrogen Generation Revenue (USD Million) By Type (2023-2028)
Figure 31 North America Hydrogen Generation Revenue (USD Million) By Applications (2023-2028)
Figure 32 Europe Hydrogen Generation Revenue (USD Million) By Country (2023-2028)
Figure 33 Europe Hydrogen Generation Revenue (USD Million) By Type (2023-2028)
Figure 34 Europe Hydrogen Generation Revenue (USD Million) By Applications (2023-2028)
Figure 35 Asia Pacific Hydrogen Generation Revenue (USD Million) By Country (2023-2028)
Figure 36 Asia Pacific Hydrogen Generation Revenue (USD Million) By Type (2023-2028)
Figure 37 Asia Pacific Hydrogen Generation Revenue (USD Million) By Applications (2023-2028)
Figure 38 South America Hydrogen Generation Revenue (USD Million) By Country (2023-2028)
Figure 39 South America Hydrogen Generation Revenue (USD Million) By Type (2023-2028)
Figure 40 South America Hydrogen Generation Revenue (USD Million) By Applications (2023-2028)
Figure 41 Middle East and Africa Hydrogen Generation Revenue (USD Million) By Region (2023-2028)
Figure 42 Middle East and Africa Hydrogen Generation Revenue (USD Million) By Region (2023-2028)
Figure 43 Middle East and Africa Hydrogen Generation Revenue (USD Million) By Type (2023-2028)
Figure 44 Middle East and Africa Hydrogen Generation Revenue (USD Million) By Applications (2023-2028)
Figure 45 Bottom-Up and Top-Down Approaches For This Report
Figure 46 Data Triangulation
By Technology
By Application
By System
By Source
By Region