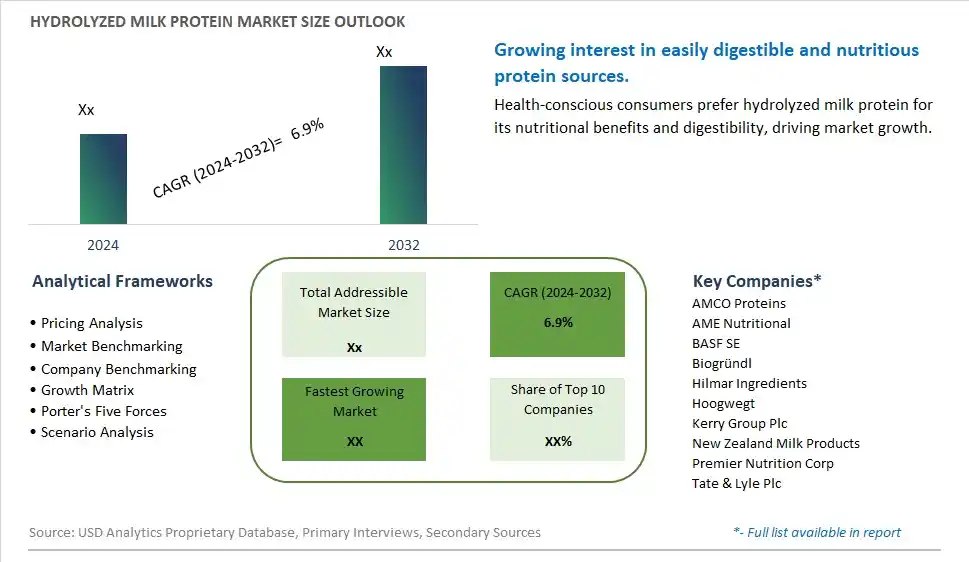
Global Hydrolyzed Milk Protein Market Size is valued at $XX Million in 2024 and is forecast to register a growth rate (CAGR) of 6.9% to reach $XX Million by 2032.
The global Hydrolyzed Milk Protein Market Comprehensive Study analyzes and forecasts the market size across 6 regions and 24 countries for diverse segments -By Type (Whey, Casein), By Application (Sports Nutrition, Clinical Nutrition, Infant Formula, Bakery and Confectionery, Personal Care)
An Introduction to Hydrolyzed Milk Protein Market
The hydrolyzed milk protein market in 2024 is expanding rapidly, driven by its applications in infant formula, sports nutrition, and medical foods. Hydrolyzed milk protein, known for its enhanced digestibility and reduced allergenic potential, is increasingly preferred for sensitive consumers, including infants and individuals with milk allergies. The market is benefiting from advancements in protein hydrolysis technology, which improve the nutritional profile and functional properties of these proteins. Additionally, the trend towards high-protein diets and the demand for functional foods are supporting market growth.
Hydrolyzed Milk Protein Competitive Landscape
The market report analyses the leading companies in the industry including AMCO Proteins, AME Nutritional, BASF SE, Biogründl, Hilmar Ingredients, Hoogwegt, Kerry Group Plc, New Zealand Milk Products, Premier Nutrition Corp, Tate & Lyle Plc, and Others.
Hydrolyzed Milk Protein Market Dynamics
Hydrolyzed Milk Protein Market Trend: Growing Demand for Sports and Infant Nutrition
The most prominent trend in the Hydrolyzed Milk Protein Market is the growing demand for sports and infant nutrition. Hydrolyzed milk protein, which is pre-digested and easier to absorb, is increasingly being used in sports nutrition products to support muscle recovery and growth. Additionally, it is a key ingredient in infant formulas designed for infants with allergies or sensitivities to intact proteins. This trend is driving the demand for hydrolyzed milk protein as manufacturers develop specialized nutrition products that cater to athletes, bodybuilders, and infants.
Hydrolyzed Milk Protein Market Driver: Increasing Incidence of Food Allergies and Intolerances
A key driver for the Hydrolyzed Milk Protein Market is the increasing incidence of food allergies and intolerances. As more individuals are diagnosed with food allergies, particularly to milk proteins, there is a growing need for hypoallergenic protein sources. Hydrolyzed milk protein, which has reduced allergenic potential, is being used to formulate foods and supplements that are safe for individuals with milk allergies. This rising prevalence of food allergies and intolerances is significantly driving the market for hydrolyzed milk protein as consumers seek safe and effective nutritional options.
Hydrolyzed Milk Protein Market Opportunity: Expansion into Clinical and Medical Nutrition
One potential opportunity in the Hydrolyzed Milk Protein Market lies in the expansion into clinical and medical nutrition. Hydrolyzed milk protein is beneficial for patients with specific medical conditions that require easily digestible and hypoallergenic protein sources. By developing clinical nutrition products that incorporate hydrolyzed milk protein, manufacturers can address the nutritional needs of patients with conditions such as malabsorption syndromes, severe food allergies, and gastrointestinal disorders. This focus on clinical and medical nutrition can drive market growth and enhance the role of hydrolyzed milk protein in specialized healthcare.
Hydrolyzed Milk Protein Market Share Analysis: Whey segment generated the highest revenue share in the industry
In the Hydrolyzed Milk Protein Market by type, whey emerges as the largest segment. Whey protein is a popular choice among consumers and manufacturers alike due to its high nutritional value and versatile applications. It is widely used in sports nutrition products, dietary supplements, and functional foods for its fast absorption rate and ability to support muscle recovery and growth. Whey hydrolyzed milk protein undergoes enzymatic hydrolysis, breaking down protein into smaller peptides, which enhances its digestibility and bioavailability. This makes whey hydrolyzed protein ideal for various nutritional and functional purposes across different consumer segments.
Hydrolyzed Milk Protein Market Share Analysis: Sports Nutrition is the fastest growing segment over the forecast period to 2032
The fastest growing segment in the Hydrolyzed Milk Protein Market by application is sports nutrition. This growth is driven by the increasing awareness of health and fitness among consumers globally. Hydrolyzed milk proteins, particularly whey and casein derivatives, are valued in sports nutrition for their ability to promote muscle protein synthesis, enhance recovery post-exercise, and support overall athletic performance. Sports nutrition products fortified with hydrolyzed milk proteins are sought after by athletes, fitness enthusiasts, and active individuals looking for effective nutritional supplementation. As demand for specialized sports nutrition products continues to rise, driven by trends in fitness and wellness, the market for hydrolyzed milk proteins in sports nutrition is expected to experience significant growth up to 2032.
Hydrolyzed Milk Protein Market Segmentation
By Type
Whey
Casein
By Application
Sports Nutrition
Clinical Nutrition
Infant Formula
Bakery and Confectionery
Personal Care
Countries Analyzed
North America (US, Canada, Mexico)
Europe (Germany, UK, France, Spain, Italy, Russia, Rest of Europe)
Asia Pacific (China, India, Japan, South Korea, Australia, South East Asia, Rest of Asia)
South America (Brazil, Argentina, Rest of South America)
Middle East and Africa (Saudi Arabia, UAE, Rest of Middle East, South Africa, Egypt, Rest of Africa)
Hydrolyzed Milk Protein Companies Profiled in the Study
AMCO Proteins
AME Nutritional
BASF SE
Biogründl
Hilmar Ingredients
Hoogwegt
Kerry Group Plc
New Zealand Milk Products
Premier Nutrition Corp
Tate & Lyle Plc
*- List Not Exhaustive
Chapter 1. TABLE OF CONTENTS
Chapter 2. Introduction to Hydrolyzed Milk Protein Market
2.1. Market Overview
2.2. Key Statistics and Report Highlights
2.3. Scope of the Comprehensive Study
2.3.1. Market Definition
2.3.2 Countries and Regions Covered
2.3.3 Research Objective
2.3.4 Units, Currency, and Conversions
2.3.5 Industry Value Chain
2.4. Key Market Segments
2.5. Key Companies
2.6. Study Period
Chapter 3. Strategic Analysis Review
3.1. Hydrolyzed Milk Protein Pricing Analysis and Forecast
3.2. Porter’s Five Forces
3.3. Market Ecosystem
3.4. SWOT Analysis
3.5. Regulatory Scenario
3.3. Effects of Inflation, Russia-Ukraine War, moderating economic growth, and other macroeconomic factors
Chapter 4. Competitive Landscape
4.1. Market Share Analysis
4.1.1. Global Hydrolyzed Milk Protein Market Share by Company, 2023
4.1.2. Product Offerings of Leading Hydrolyzed Milk Protein Companies
4.2. Market Entropy
4.2.1. New Product Launches in the Industry
4.2.2. Mergers, Acquisitions, Joint ventures, and Partnerships
4.3. Key Strategies and Best Practices
Chapter 5. Global Market Projections: Best, Reference, and Low Case Scenarios
5.1. Growth Analysis- Case Scenario Definitions
5.2. Low Growth Case Scenario Forecasts
5.3. Reference Growth Case Scenario Forecasts
5.4. High Growth Case Scenario Forecasts
Chapter 6. Market Dynamics
6.1. Hydrolyzed Milk Protein Market Drivers
6.2. Hydrolyzed Milk Protein Market Challenges
6.6. Hydrolyzed Milk Protein Market Opportunities
6.4. Hydrolyzed Milk Protein Market Trends
Chapter 7. Global Hydrolyzed Milk Protein Market Outlook Trends
7.1. Global Hydrolyzed Milk Protein Revenue (USD Million) and CAGR (%) by Type (2021-2032)
7.2. Global Hydrolyzed Milk Protein Revenue (USD Million) and CAGR (%) by Application (2021-2032)
7.3. Global Hydrolyzed Milk Protein Revenue (USD Million) and CAGR (%) by Product (2021-2032)
By Type
Whey
Casein
By Application
Sports Nutrition
Clinical Nutrition
Infant Formula
Bakery and Confectionery
Personal Care
Chapter 8. Global Hydrolyzed Milk Protein Regional Analysis and Outlook
8.1. Global Hydrolyzed Milk Protein Revenue (USD Million) By Regions (2021- 2032)
8.2. North America Hydrolyzed Milk Protein Revenue (USD Million) by Country (2021-2032)
8.2.1. United States Hydrolyzed Milk Protein Regional Analysis and Outlook
8.2.2. Canada Hydrolyzed Milk Protein Regional Analysis and Outlook
8.2.3. Mexico Hydrolyzed Milk Protein Regional Analysis and Outlook
8.3. Europe Hydrolyzed Milk Protein Revenue (USD Million), by Country (2021-2032)
8.3.1. Germany Hydrolyzed Milk Protein Regional Analysis and Outlook
8.3.2. France Hydrolyzed Milk Protein Regional Analysis and Outlook
8.3.3. United Kingdom Hydrolyzed Milk Protein Regional Analysis and Outlook
8.3.4. Spain Hydrolyzed Milk Protein Regional Analysis and Outlook
8.3.5. Italy Hydrolyzed Milk Protein Regional Analysis and Outlook
8.3.6. Russia Hydrolyzed Milk Protein Regional Analysis and Outlook
8.3.7. Rest of Europe Hydrolyzed Milk Protein Regional Analysis and Outlook
8.4. Asia Pacific Hydrolyzed Milk Protein Revenue (USD Million) by Country (2021-2032)
8.4.1. China Hydrolyzed Milk Protein Regional Analysis and Outlook
8.4.2. Japan Hydrolyzed Milk Protein Regional Analysis and Outlook
8.4.3. India Hydrolyzed Milk Protein Regional Analysis and Outlook
8.4.4. South Korea Hydrolyzed Milk Protein Regional Analysis and Outlook
8.4.5. Australia Hydrolyzed Milk Protein Regional Analysis and Outlook
8.4.6. South East Asia Hydrolyzed Milk Protein Regional Analysis and Outlook
8.4.7. Rest of Asia Pacific Hydrolyzed Milk Protein Regional Analysis and Outlook
8.5. South America Hydrolyzed Milk Protein Revenue (USD Million), by Country (2021-2032)
8.5.1. Brazil Hydrolyzed Milk Protein Regional Analysis and Outlook
8.5.2. Argentina Hydrolyzed Milk Protein Regional Analysis and Outlook
8.5.3. Rest of South America Hydrolyzed Milk Protein Regional Analysis and Outlook
8.6. Middle East and Africa Hydrolyzed Milk Protein Revenue (USD Million) by Country (2021-2032)
8.6.1. Middle East Hydrolyzed Milk Protein Regional Analysis and Outlook
8.6.2. Africa Hydrolyzed Milk Protein Regional Analysis and Outlook
Chapter 9. North America Hydrolyzed Milk Protein Analysis and Outlook
9.1. North America Hydrolyzed Milk Protein Revenue (USD Million) by Segments (2021-2032)
9.1.1. North America Hydrolyzed Milk Protein Revenue (USD Million) by Type (2021-2032)
9.1.2. North America Hydrolyzed Milk Protein Revenue (USD Million) by Application (2021-2032)
9.1.3. North America Hydrolyzed Milk Protein Revenue (USD Million) by Product (2021-2032)
By Type
Whey
Casein
By Application
Sports Nutrition
Clinical Nutrition
Infant Formula
Bakery and Confectionery
Personal Care
Chapter 10. Europe Hydrolyzed Milk Protein Analysis and Outlook
10.1. Europe Hydrolyzed Milk Protein Revenue (USD Million), by Segments (USD Million) (2021-2032)
10.1.1. Europe Hydrolyzed Milk Protein Revenue (USD Million) by Type (2021-2032)
10.1.2. Europe Hydrolyzed Milk Protein Revenue (USD Million) by Application (2021-2032)
10.1.3. Europe Hydrolyzed Milk Protein Revenue (USD Million) by Product (2021-2032)
By Type
Whey
Casein
By Application
Sports Nutrition
Clinical Nutrition
Infant Formula
Bakery and Confectionery
Personal Care
Chapter 11. Asia Pacific Hydrolyzed Milk Protein Analysis and Outlook
11.1. Asia Pacific Hydrolyzed Milk Protein Revenue (USD Million), and Revenue (USD Million) by Segments (2021-2032)
11.1.1. Asia Pacific Hydrolyzed Milk Protein Revenue (USD Million) by Type (2021-2032)
11.1.2. Asia Pacific Hydrolyzed Milk Protein Revenue (USD Million) by Application (2021-2032)
11.1.3. Asia Pacific Hydrolyzed Milk Protein Revenue (USD Million) by Product (2021-2032)
By Type
Whey
Casein
By Application
Sports Nutrition
Clinical Nutrition
Infant Formula
Bakery and Confectionery
Personal Care
Chapter 12. South America Hydrolyzed Milk Protein Analysis and Outlook
12.1. South America Hydrolyzed Milk Protein Revenue (USD Million), by Segments (2021-2032)
12.1.1. South America Hydrolyzed Milk Protein Revenue (USD Million) by Type (2021-2032)
12.1.2. South America Hydrolyzed Milk Protein Revenue (USD Million) by Application (2021-2032)
12.1.3. South America Hydrolyzed Milk Protein Revenue (USD Million) by Product (2021-2032)
By Type
Whey
Casein
By Application
Sports Nutrition
Clinical Nutrition
Infant Formula
Bakery and Confectionery
Personal Care
Chapter 13. Middle East and Africa Hydrolyzed Milk Protein Analysis and Outlook
13.1. Middle East and Africa Hydrolyzed Milk Protein Revenue (USD Million), by Segments (2021-2032)
13.1.1. Middle East and Africa Hydrolyzed Milk Protein Revenue (USD Million) by Type (2021-2032)
13.1.2. Middle East and Africa Hydrolyzed Milk Protein Revenue (USD Million) by Application (2021-2032)
13.1.3. Middle East and Africa Hydrolyzed Milk Protein Revenue (USD Million) by Product (2021-2032)
By Type
Whey
Casein
By Application
Sports Nutrition
Clinical Nutrition
Infant Formula
Bakery and Confectionery
Personal Care
Chapter 14. Hydrolyzed Milk Protein Company Profiles
14.1 Business Overview
14.2 Product Profiles
14.3 SWOT Profiles
14.5 Recent Developments
14.6 Financial Profile
List of Companies
AMCO Proteins
AME Nutritional
BASF SE
Biogründl
Hilmar Ingredients
Hoogwegt
Kerry Group Plc
New Zealand Milk Products
Premier Nutrition Corp
Tate & Lyle Plc
15. Methodology and Data Sources
15.1 Customization Offerings
15.2 Subscription Services
15.3 Related Reports
15.4 Publisher Expertise
LIST OF TABLES
Table 1 Market Segmentation Analysis
Table 2 Global Hydrolyzed Milk Protein Market Share of Leading Companies, 2023
Table 3 Product Offerings of Leading Companies
Table 4 Low Growth Scenario Forecasts
Table 5 Reference Case Growth Scenario
Table 6 High Growth Case Scenario
Table 7 Global Hydrolyzed Milk Protein Revenue (USD Million) And CAGR (%) By Type (2021-2032)
Table 8 Global Hydrolyzed Milk Protein Revenue (USD Million) And CAGR (%) By Application (2021-2032)
Table 9 Global Hydrolyzed Milk Protein Revenue (USD Million) And CAGR (%) By Product (2021-2032)
Table 10 Global Hydrolyzed Milk Protein Market Revenue (USD Million) By Regions (2021-2032)
Table 11 Global Hydrolyzed Milk Protein Market Share (%) By Regions (2021-2032)
Table 12 North America Hydrolyzed Milk Protein Revenue (USD Million) By Country (2021-2032)
Table 13 Europe Hydrolyzed Milk Protein Revenue (USD Million) By Country (2021-2032)
Table 14 Asia Pacific Hydrolyzed Milk Protein Revenue (USD Million) By Country (2021-2032)
Table 15 South America Hydrolyzed Milk Protein Revenue (USD Million) By Country (2021-2032)
Table 16 Middle East and Africa Hydrolyzed Milk Protein Revenue (USD Million) By Region (2021-2032)
Table 17 North America Hydrolyzed Milk Protein Revenue (USD Million) By Type (2021-2032)
Table 18 North America Hydrolyzed Milk Protein Revenue (USD Million) By Application (2021-2032)
Table 19 North America Hydrolyzed Milk Protein Revenue (USD Million) By Product (2021-2032)
Table 20 Europe Hydrolyzed Milk Protein Revenue (USD Million) By Type (2021-2032)
Table 21 Europe Hydrolyzed Milk Protein Revenue (USD Million) By Application (2021-2032)
Table 22 Europe Hydrolyzed Milk Protein Revenue (USD Million) By Product (2021-2032)
Table 23 Asia Pacific Hydrolyzed Milk Protein Revenue (USD Million) By Type (2021-2032)
Table 24 Asia Pacific Hydrolyzed Milk Protein Revenue (USD Million) By Application (2021-2032)
Table 25 Asia Pacific Hydrolyzed Milk Protein Revenue (USD Million) By Product (2021-2032)
Table 26 South America Hydrolyzed Milk Protein Revenue (USD Million) By Type (2021-2032)
Table 27 South America Hydrolyzed Milk Protein Revenue (USD Million) By Application (2021-2032)
Table 28 South America Hydrolyzed Milk Protein Revenue (USD Million) By Product (2021-2032)
Table 29 Middle East and Africa Hydrolyzed Milk Protein Revenue (USD Million) By Type (2021-2032)
Table 30 Middle East and Africa Hydrolyzed Milk Protein Revenue (USD Million) By Application (2021-2032)
Table 31 Middle East and Africa Hydrolyzed Milk Protein Revenue (USD Million) By Product (2021-2032)
LIST OF FIGURES
Figure 1. Market Scope
Figure 2. Pricing Forecasts Per Unit, 2023- 2032
Figure 3. Porter’s Five Forces
Figure 4. Global Hydrolyzed Milk Protein Market Revenue (USD Million) By Regions (2021-2032)
Figure 5. Global Hydrolyzed Milk Protein Market Share (%) By Regions (2023)
Figure 6. North America Hydrolyzed Milk Protein Revenue (USD Million) By Country (2021-2032)
Figure 7. United States Hydrolyzed Milk Protein Revenue (USD Million) By Country (2021-2032)
Figure 8. Canada Hydrolyzed Milk Protein Revenue (USD Million) By Country (2021-2032)
Figure 9. Mexico Hydrolyzed Milk Protein Revenue (USD Million) By Country (2021-2032)
Figure 10. Europe Hydrolyzed Milk Protein Revenue (USD Million) By Country (2021-2032)
Figure 11. Germany Hydrolyzed Milk Protein Revenue (USD Million) By Country (2021-2032)
Figure 12. France Hydrolyzed Milk Protein Revenue (USD Million) By Country (2021-2032)
Figure 13. United Kingdom Hydrolyzed Milk Protein Revenue (USD Million) By Country (2021-2032)
Figure 14. Spain Hydrolyzed Milk Protein Revenue (USD Million) By Country (2021-2032)
Figure 15. Italy Hydrolyzed Milk Protein Revenue (USD Million) By Country (2021-2032)
Figure 16. Russia Hydrolyzed Milk Protein Revenue (USD Million) By Country (2021-2032)
Figure 17. Rest of Europe Hydrolyzed Milk Protein Revenue (USD Million) By Country (2021-2032)
Figure 11. Asia Pacific Hydrolyzed Milk Protein Revenue (USD Million) By Country (2021-2032)
Figure 12. China Hydrolyzed Milk Protein Revenue (USD Million) By Country (2021-2032)
Figure 13. Japan Hydrolyzed Milk Protein Revenue (USD Million) By Country (2021-2032)
Figure 14. India Hydrolyzed Milk Protein Revenue (USD Million) By Country (2021-2032)
Figure 15. South Korea Hydrolyzed Milk Protein Revenue (USD Million) By Country (2021-2032)
Figure 16. Australia Hydrolyzed Milk Protein Revenue (USD Million) By Country (2021-2032)
Figure 17. South East Asia Hydrolyzed Milk Protein Revenue (USD Million) By Country (2021-2032)
Figure 18. South America Hydrolyzed Milk Protein Revenue (USD Million) By Country (2021-2032)
Figure 19. Brazil Hydrolyzed Milk Protein Revenue (USD Million) By Country (2021-2032)
Figure 20. Argentina Hydrolyzed Milk Protein Revenue (USD Million) By Country (2021-2032)
Figure 21. Rest of Asia Pacific Hydrolyzed Milk Protein Revenue (USD Million) By Country (2021-2032)
Figure 22. Middle East and Africa Hydrolyzed Milk Protein Revenue (USD Million) By Region (2021-2032)
Figure 23. Saudi Arabia Hydrolyzed Milk Protein Revenue (USD Million) By Region (2021-2032)
Figure 24. The UAE Hydrolyzed Milk Protein Revenue (USD Million) By Region (2021-2032)
Figure 25. Rest of Middle East Hydrolyzed Milk Protein Revenue (USD Million) By Region (2021-2032)
Figure 26. South Africa Hydrolyzed Milk Protein Revenue (USD Million) By Region (2021-2032)
Figure 27. Africa Hydrolyzed Milk Protein Revenue (USD Million) By Region (2021-2032)
Figure 28. North America Hydrolyzed Milk Protein Revenue (USD Million) By Type (2021-2032)
Figure 29. North America Hydrolyzed Milk Protein Revenue (USD Million) By Application (2021-2032)
Figure 30. North America Hydrolyzed Milk Protein Revenue (USD Million) By Product (2021-2032)
Figure 31. Europe Hydrolyzed Milk Protein Revenue (USD Million) By Type (2021-2032)
Figure 32. Europe Hydrolyzed Milk Protein Revenue (USD Million) By Application (2021-2032)
Figure 33. Europe Hydrolyzed Milk Protein Revenue (USD Million) By Product (2021-2032)
Figure 34. Asia Pacific Hydrolyzed Milk Protein Revenue (USD Million) By Type (2021-2032)
Figure 35. Asia Pacific Hydrolyzed Milk Protein Revenue (USD Million) By Application (2021-2032)
Figure 36. Asia Pacific Hydrolyzed Milk Protein Revenue (USD Million) By Product (2021-2032)
Figure 37. South America Hydrolyzed Milk Protein Revenue (USD Million) By Type (2021-2032)
Figure 38. South America Hydrolyzed Milk Protein Revenue (USD Million) By Application (2021-2032)
Figure 39. South America Hydrolyzed Milk Protein Revenue (USD Million) By Product (2021-2032)
Figure 40. Middle East and Africa Hydrolyzed Milk Protein Revenue (USD Million) By Type (2021-2032)
Figure 41. Middle East and Africa Hydrolyzed Milk Protein Revenue (USD Million) By Application (2021-2032)
Figure 42. Middle East and Africa Hydrolyzed Milk Protein Revenue (USD Million) By Product (2021-2032)
By Type
Whey
Casein
By Application
Sports Nutrition
Clinical Nutrition
Infant Formula
Bakery and Confectionery
Personal Care
Countries Analyzed
North America (US, Canada, Mexico)
Europe (Germany, UK, France, Spain, Italy, Russia, Rest of Europe)
Asia Pacific (China, India, Japan, South Korea, Australia, South East Asia, Rest of Asia)
South America (Brazil, Argentina, Rest of South America)
Middle East and Africa (Saudi Arabia, UAE, Rest of Middle East, South Africa, Egypt, Rest of Africa)
