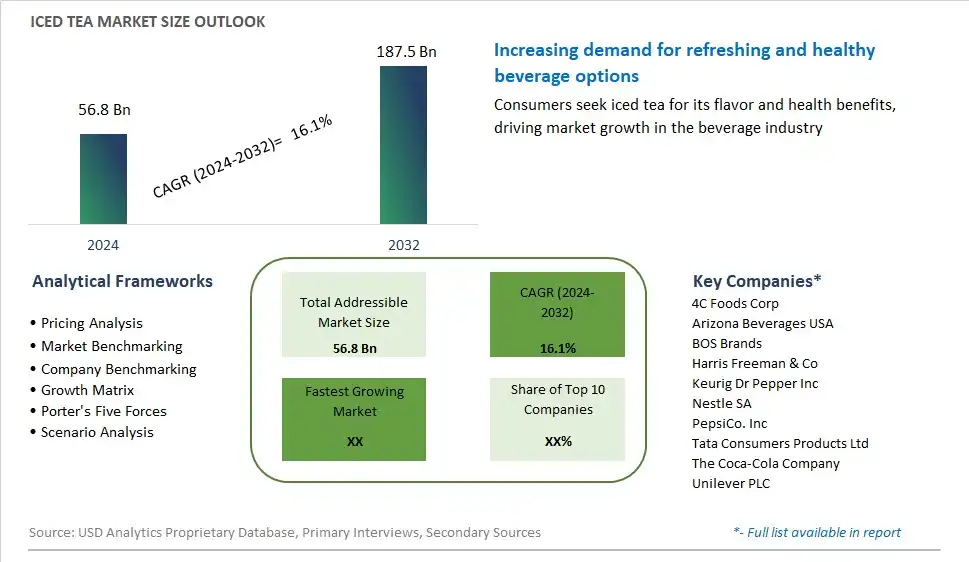
Global Iced Tea Market Size is valued at $56.8 Billion in 2024 and is forecast to register a growth rate (CAGR) of 16.1% to reach $187.5 Billion by 2032.
The global Iced Tea Market Comprehensive Study analyzes and forecasts the market size across 6 regions and 24 countries for diverse segments -By Product (Black Iced Tea, Green Iced Tea, Herbal Iced Tea, Others), By Form (Powder, Liquid), By Distribution Channel (Supermarkets/ Hypermarkets, Convenience Stores, Online Retail Stores, Others)
An Introduction to Iced Tea Market
In 2024, the market for iced tea continues to grow as consumers seek refreshing and flavorful beverages that offer hydration, taste, and health benefits. Iced tea, made by steeping tea leaves in cold water and served chilled over ice, has become a popular beverage choice for consumers looking for a low-calorie, caffeine-free alternative to sugary sodas and juices. With a wide range of flavors, varieties, and brewing methods, iced tea appeals to diverse consumer preferences and lifestyles, offering options for both traditional tea enthusiasts and those seeking innovative and exotic flavors. Moreover, the rise of health and wellness trends has led to increased demand for functional and naturally flavored iced teas infused with herbs, fruits, and botanicals known for their antioxidant, anti-inflammatory, and hydrating properties. As consumers prioritize healthier beverage options and seek alternatives to sugary drinks, the market for iced tea is poised for continued growth and innovation, offering opportunities for product diversification, packaging innovation, and marketing strategies that promote hydration, refreshment, and well-being.
Iced Tea Competitive Landscape
The market report analyses the leading companies in the industry including 4C Foods Corp, Arizona Beverages USA, BOS Brands, Harris Freeman & Co, Keurig Dr Pepper Inc, Nestle SA, PepsiCo. Inc, Tata Consumers Products Ltd, The Coca-Cola Company, Unilever PLC, and Others.
Iced Tea Market Dynamics
Iced Tea Market Trend: Rising Demand for Healthier Beverage Options
The market for iced tea is experiencing a prominent trend towards the rising demand for healthier beverage options, driven by increasing consumer awareness of health and wellness, preference for natural ingredients, and the desire to reduce sugar intake. As individuals seek alternatives to sugary sodas and high-calorie drinks, there is a growing popularity of iced tea as a refreshing and flavorful beverage choice that can be enjoyed both cold and unsweetened or lightly sweetened. This trend is fueled by factors such as the shift towards healthier lifestyles, concerns about obesity and diabetes, and the availability of a wide variety of iced tea flavors and formulations, driving market growth and innovation in the iced tea segment.
Market Driver: Consumer Preference for Refreshing and Hydrating Beverages
A key driver propelling the market for iced tea is the consumer preference for refreshing and hydrating beverages, driven by factors such as hot weather, active lifestyles, and the desire for thirst-quenching options. As individuals seek to stay hydrated and cool down during warmer months or after physical activities, there is an increased demand for iced tea as a convenient and enjoyable beverage choice that offers hydration, flavor, and refreshment. This driver is further fueled by the versatility of iced tea as a base for various flavorings, infusions, and enhancements, catering to diverse taste preferences and providing a healthier alternative to sugary drinks, driving market growth and consumption of iced tea products.
Market Opportunity: Innovation in Flavor Profiles and Functional Ingredients
An opportunity exists for manufacturers of iced tea to innovate and differentiate their products by exploring new flavor profiles and incorporating functional ingredients that offer added health benefits and consumer appeal. By experimenting with exotic fruits, herbs, botanicals, and natural sweeteners, manufacturers can create unique and exciting flavor combinations that stand out in the market and appeal to adventurous consumers seeking novel taste experiences. Moreover, incorporating functional ingredients such as antioxidants, vitamins, minerals, and adaptogens into iced tea formulations can enhance the nutritional profile and wellness positioning of products, meeting the growing demand for functional beverages that support health and vitality. This opportunity allows manufacturers to expand their product offerings, attract new consumer segments, and capitalize on the growing popularity of iced tea as a healthier and more flavorful beverage option in the market.
Iced Tea Market Share Analysis: Black Iced Tea held the dominant market share in 2024
Within the Iced Tea Market, the segment focused on Black Iced Tea is the largest, owing to its widespread popularity and timeless appeal. Black iced tea, with its robust flavor and refreshing taste, holds a strong foothold in the beverage industry, appealing to a broad spectrum of consumers. Its versatility allows for various flavor enhancements, making it a customizable option for both casual consumers and connoisseurs alike. Further, black tea's rich history and cultural significance contribute to its enduring demand, with consumers often gravitating towards familiar and comforting choices. Additionally, the segment's dominance is reinforced by its availability in various formats, including bottled, canned, and powdered forms, catering to diverse consumer preferences and consumption occasions. As consumers continue to seek refreshing and flavorful beverage options, black iced tea remains at the forefront of the market, embodying tradition and innovation in the ever-evolving beverage landscape.
Iced Tea Market Share Analysis: Liquid Form market is poised to register the fastest growth rae over the forecast period to 2032
In the Iced Tea Market, the Liquid Form segment is the fastest-growing, fueled by its convenience, versatility, and evolving consumer preferences. Liquid iced tea offers ready-to-drink solutions that cater to on-the-go lifestyles, providing instant refreshment without the need for preparation or mixing. Further, the segment's growth is propelled by innovations in flavor profiles, packaging formats, and marketing strategies, which captivate consumers seeking novel and indulgent beverage experiences. Additionally, liquid iced tea's availability in a wide range of flavors and formulations, including unsweetened, sweetened, and flavored varieties, appeals to diverse taste preferences and dietary needs. As consumers increasingly prioritize convenience and flavor diversity in their beverage choices, the liquid form emerges as a frontrunner in driving the rapid expansion of the iced tea market, reshaping consumption habits and market dynamics.
Iced Tea Market Share Analysis: Supermarkets/Hypermarkets held the dominant market share in 2024
Within the Iced Tea Market, Supermarkets/Hypermarkets emerge as the largest distribution channel, owing to their extensive reach, diverse product offerings, and consumer convenience. These retail giants serve as go-to destinations for consumers seeking a wide selection of beverages, including iced tea, all under one roof. Their spacious aisles and strategic placement of products make it easy for shoppers to discover and purchase their preferred iced tea brands. Additionally, supermarkets and hypermarkets often leverage promotional activities, such as discounts, bundling deals, and product displays, to attract and retain customers, further solidifying their dominance in the market. Further, the established infrastructure and robust supply chain of supermarkets/hypermarkets ensure consistent availability of iced tea products, meeting consumer demand across various regions. As consumers continue to prioritize convenience and variety in their shopping experiences, supermarkets/hypermarkets remain at the forefront of the iced tea market distribution, shaping consumption patterns and market growth.
Iced Tea Market Segmentation
By Product
Black Iced Tea
Green Iced Tea
Herbal Iced Tea
Others
By Form
Powder
Liquid
By Distribution Channel
Supermarkets/ Hypermarkets
Convenience Stores
Online Retail Stores
Others
Countries Analyzed
North America (US, Canada, Mexico)
Europe (Germany, UK, France, Spain, Italy, Russia, Rest of Europe)
Asia Pacific (China, India, Japan, South Korea, Australia, South East Asia, Rest of Asia)
South America (Brazil, Argentina, Rest of South America)
Middle East and Africa (Saudi Arabia, UAE, Rest of Middle East, South Africa, Egypt, Rest of Africa)
Iced Tea Companies Profiled in the Study
4C Foods Corp
Arizona Beverages USA
BOS Brands
Harris Freeman & Co
Keurig Dr Pepper Inc
Nestle SA
PepsiCo. Inc
Tata Consumers Products Ltd
The Coca-Cola Company
Unilever PLC
*- List Not Exhaustive
Chapter 1. TABLE OF CONTENTS
Chapter 2. Introduction to Iced Tea Market
2.1. Market Overview
2.2. Key Statistics and Report Highlights
2.3. Scope of the Comprehensive Study
2.3.1. Market Definition
2.3.2 Countries and Regions Covered
2.3.3 Research Objective
2.3.4 Units, Currency, and Conversions
2.3.5 Industry Value Chain
2.4. Key Market Segments
2.5. Key Companies
2.6. Study Period
Chapter 3. Strategic Analysis Review
3.1. Iced Tea Pricing Analysis and Forecast
3.2. Porter’s Five Forces
3.3. Market Ecosystem
3.4. SWOT Analysis
3.5. Regulatory Scenario
3.3. Effects of Inflation, Russia-Ukraine War, moderating economic growth, and other macroeconomic factors
Chapter 4. Competitive Landscape
4.1. Market Share Analysis
4.1.1. Global Iced Tea Market Share by Company, 2023
4.1.2. Product Offerings of Leading Iced Tea Companies
4.2. Market Entropy
4.2.1. New Product Launches in the Industry
4.2.2. Mergers, Acquisitions, Joint ventures, and Partnerships
4.3. Key Strategies and Best Practices
Chapter 5. Global Market Projections: Best, Reference, and Low Case Scenarios
5.1. Growth Analysis- Case Scenario Definitions
5.2. Low Growth Case Scenario Forecasts
5.3. Reference Growth Case Scenario Forecasts
5.4. High Growth Case Scenario Forecasts
Chapter 6. Market Dynamics
6.1. Iced Tea Market Drivers
6.2. Iced Tea Market Challenges
6.6. Iced Tea Market Opportunities
6.4. Iced Tea Market Trends
Chapter 7. Global Iced Tea Market Outlook Trends
7.1. Global Iced Tea Revenue (USD Million) and CAGR (%) by Type (2021-2032)
7.2. Global Iced Tea Revenue (USD Million) and CAGR (%) by Application (2021-2032)
7.3. Global Iced Tea Revenue (USD Million) and CAGR (%) by Product (2021-2032)
By Product
Black Iced Tea
Green Iced Tea
Herbal Iced Tea
Others
By Form
Powder
Liquid
By Distribution Channel
Supermarkets/ Hypermarkets
Convenience Stores
Online Retail Stores
Others
Chapter 8. Global Iced Tea Regional Analysis and Outlook
8.1. Global Iced Tea Revenue (USD Million) By Regions (2021- 2032)
8.2. North America Iced Tea Revenue (USD Million) by Country (2021-2032)
8.2.1. United States Iced Tea Regional Analysis and Outlook
8.2.2. Canada Iced Tea Regional Analysis and Outlook
8.2.3. Mexico Iced Tea Regional Analysis and Outlook
8.3. Europe Iced Tea Revenue (USD Million), by Country (2021-2032)
8.3.1. Germany Iced Tea Regional Analysis and Outlook
8.3.2. France Iced Tea Regional Analysis and Outlook
8.3.3. United Kingdom Iced Tea Regional Analysis and Outlook
8.3.4. Spain Iced Tea Regional Analysis and Outlook
8.3.5. Italy Iced Tea Regional Analysis and Outlook
8.3.6. Russia Iced Tea Regional Analysis and Outlook
8.3.7. Rest of Europe Iced Tea Regional Analysis and Outlook
8.4. Asia Pacific Iced Tea Revenue (USD Million) by Country (2021-2032)
8.4.1. China Iced Tea Regional Analysis and Outlook
8.4.2. Japan Iced Tea Regional Analysis and Outlook
8.4.3. India Iced Tea Regional Analysis and Outlook
8.4.4. South Korea Iced Tea Regional Analysis and Outlook
8.4.5. Australia Iced Tea Regional Analysis and Outlook
8.4.6. South East Asia Iced Tea Regional Analysis and Outlook
8.4.7. Rest of Asia Pacific Iced Tea Regional Analysis and Outlook
8.5. South America Iced Tea Revenue (USD Million), by Country (2021-2032)
8.5.1. Brazil Iced Tea Regional Analysis and Outlook
8.5.2. Argentina Iced Tea Regional Analysis and Outlook
8.5.3. Rest of South America Iced Tea Regional Analysis and Outlook
8.6. Middle East and Africa Iced Tea Revenue (USD Million) by Country (2021-2032)
8.6.1. Middle East Iced Tea Regional Analysis and Outlook
8.6.2. Africa Iced Tea Regional Analysis and Outlook
Chapter 9. North America Iced Tea Analysis and Outlook
9.1. North America Iced Tea Revenue (USD Million) by Segments (2021-2032)
9.1.1. North America Iced Tea Revenue (USD Million) by Type (2021-2032)
9.1.2. North America Iced Tea Revenue (USD Million) by Application (2021-2032)
9.1.3. North America Iced Tea Revenue (USD Million) by Product (2021-2032)
By Product
Black Iced Tea
Green Iced Tea
Herbal Iced Tea
Others
By Form
Powder
Liquid
By Distribution Channel
Supermarkets/ Hypermarkets
Convenience Stores
Online Retail Stores
Others
Chapter 10. Europe Iced Tea Analysis and Outlook
10.1. Europe Iced Tea Revenue (USD Million), by Segments (USD Million) (2021-2032)
10.1.1. Europe Iced Tea Revenue (USD Million) by Type (2021-2032)
10.1.2. Europe Iced Tea Revenue (USD Million) by Application (2021-2032)
10.1.3. Europe Iced Tea Revenue (USD Million) by Product (2021-2032)
By Product
Black Iced Tea
Green Iced Tea
Herbal Iced Tea
Others
By Form
Powder
Liquid
By Distribution Channel
Supermarkets/ Hypermarkets
Convenience Stores
Online Retail Stores
Others
Chapter 11. Asia Pacific Iced Tea Analysis and Outlook
11.1. Asia Pacific Iced Tea Revenue (USD Million), and Revenue (USD Million) by Segments (2021-2032)
11.1.1. Asia Pacific Iced Tea Revenue (USD Million) by Type (2021-2032)
11.1.2. Asia Pacific Iced Tea Revenue (USD Million) by Application (2021-2032)
11.1.3. Asia Pacific Iced Tea Revenue (USD Million) by Product (2021-2032)
By Product
Black Iced Tea
Green Iced Tea
Herbal Iced Tea
Others
By Form
Powder
Liquid
By Distribution Channel
Supermarkets/ Hypermarkets
Convenience Stores
Online Retail Stores
Others
Chapter 12. South America Iced Tea Analysis and Outlook
12.1. South America Iced Tea Revenue (USD Million), by Segments (2021-2032)
12.1.1. South America Iced Tea Revenue (USD Million) by Type (2021-2032)
12.1.2. South America Iced Tea Revenue (USD Million) by Application (2021-2032)
12.1.3. South America Iced Tea Revenue (USD Million) by Product (2021-2032)
By Product
Black Iced Tea
Green Iced Tea
Herbal Iced Tea
Others
By Form
Powder
Liquid
By Distribution Channel
Supermarkets/ Hypermarkets
Convenience Stores
Online Retail Stores
Others
Chapter 13. Middle East and Africa Iced Tea Analysis and Outlook
13.1. Middle East and Africa Iced Tea Revenue (USD Million), by Segments (2021-2032)
13.1.1. Middle East and Africa Iced Tea Revenue (USD Million) by Type (2021-2032)
13.1.2. Middle East and Africa Iced Tea Revenue (USD Million) by Application (2021-2032)
13.1.3. Middle East and Africa Iced Tea Revenue (USD Million) by Product (2021-2032)
By Product
Black Iced Tea
Green Iced Tea
Herbal Iced Tea
Others
By Form
Powder
Liquid
By Distribution Channel
Supermarkets/ Hypermarkets
Convenience Stores
Online Retail Stores
Others
Chapter 14. Iced Tea Company Profiles
14.1 Business Overview
14.2 Product Profiles
14.3 SWOT Profiles
14.5 Recent Developments
14.6 Financial Profile
List of Companies
4C Foods Corp
Arizona Beverages USA
BOS Brands
Harris Freeman & Co
Keurig Dr Pepper Inc
Nestle SA
PepsiCo. Inc
Tata Consumers Products Ltd
The Coca-Cola Company
Unilever PLC
15. Methodology and Data Sources
15.1 Customization Offerings
15.2 Subscription Services
15.3 Related Reports
15.4 Publisher Expertise
LIST OF TABLES
Table 1 Market Segmentation Analysis
Table 2 Global Iced Tea Market Share of Leading Companies, 2023
Table 3 Product Offerings of Leading Companies
Table 4 Low Growth Scenario Forecasts
Table 5 Reference Case Growth Scenario
Table 6 High Growth Case Scenario
Table 7 Global Iced Tea Revenue (USD Million) And CAGR (%) By Type (2021-2032)
Table 8 Global Iced Tea Revenue (USD Million) And CAGR (%) By Application (2021-2032)
Table 9 Global Iced Tea Revenue (USD Million) And CAGR (%) By Product (2021-2032)
Table 10 Global Iced Tea Market Revenue (USD Million) By Regions (2021-2032)
Table 11 Global Iced Tea Market Share (%) By Regions (2021-2032)
Table 12 North America Iced Tea Revenue (USD Million) By Country (2021-2032)
Table 13 Europe Iced Tea Revenue (USD Million) By Country (2021-2032)
Table 14 Asia Pacific Iced Tea Revenue (USD Million) By Country (2021-2032)
Table 15 South America Iced Tea Revenue (USD Million) By Country (2021-2032)
Table 16 Middle East and Africa Iced Tea Revenue (USD Million) By Region (2021-2032)
Table 17 North America Iced Tea Revenue (USD Million) By Type (2021-2032)
Table 18 North America Iced Tea Revenue (USD Million) By Application (2021-2032)
Table 19 North America Iced Tea Revenue (USD Million) By Product (2021-2032)
Table 20 Europe Iced Tea Revenue (USD Million) By Type (2021-2032)
Table 21 Europe Iced Tea Revenue (USD Million) By Application (2021-2032)
Table 22 Europe Iced Tea Revenue (USD Million) By Product (2021-2032)
Table 23 Asia Pacific Iced Tea Revenue (USD Million) By Type (2021-2032)
Table 24 Asia Pacific Iced Tea Revenue (USD Million) By Application (2021-2032)
Table 25 Asia Pacific Iced Tea Revenue (USD Million) By Product (2021-2032)
Table 26 South America Iced Tea Revenue (USD Million) By Type (2021-2032)
Table 27 South America Iced Tea Revenue (USD Million) By Application (2021-2032)
Table 28 South America Iced Tea Revenue (USD Million) By Product (2021-2032)
Table 29 Middle East and Africa Iced Tea Revenue (USD Million) By Type (2021-2032)
Table 30 Middle East and Africa Iced Tea Revenue (USD Million) By Application (2021-2032)
Table 31 Middle East and Africa Iced Tea Revenue (USD Million) By Product (2021-2032)
LIST OF FIGURES
Figure 1. Market Scope
Figure 2. Pricing Forecasts Per Unit, 2023- 2032
Figure 3. Porter’s Five Forces
Figure 4. Global Iced Tea Market Revenue (USD Million) By Regions (2021-2032)
Figure 5. Global Iced Tea Market Share (%) By Regions (2023)
Figure 6. North America Iced Tea Revenue (USD Million) By Country (2021-2032)
Figure 7. United States Iced Tea Revenue (USD Million) By Country (2021-2032)
Figure 8. Canada Iced Tea Revenue (USD Million) By Country (2021-2032)
Figure 9. Mexico Iced Tea Revenue (USD Million) By Country (2021-2032)
Figure 10. Europe Iced Tea Revenue (USD Million) By Country (2021-2032)
Figure 11. Germany Iced Tea Revenue (USD Million) By Country (2021-2032)
Figure 12. France Iced Tea Revenue (USD Million) By Country (2021-2032)
Figure 13. United Kingdom Iced Tea Revenue (USD Million) By Country (2021-2032)
Figure 14. Spain Iced Tea Revenue (USD Million) By Country (2021-2032)
Figure 15. Italy Iced Tea Revenue (USD Million) By Country (2021-2032)
Figure 16. Russia Iced Tea Revenue (USD Million) By Country (2021-2032)
Figure 17. Rest of Europe Iced Tea Revenue (USD Million) By Country (2021-2032)
Figure 11. Asia Pacific Iced Tea Revenue (USD Million) By Country (2021-2032)
Figure 12. China Iced Tea Revenue (USD Million) By Country (2021-2032)
Figure 13. Japan Iced Tea Revenue (USD Million) By Country (2021-2032)
Figure 14. India Iced Tea Revenue (USD Million) By Country (2021-2032)
Figure 15. South Korea Iced Tea Revenue (USD Million) By Country (2021-2032)
Figure 16. Australia Iced Tea Revenue (USD Million) By Country (2021-2032)
Figure 17. South East Asia Iced Tea Revenue (USD Million) By Country (2021-2032)
Figure 18. South America Iced Tea Revenue (USD Million) By Country (2021-2032)
Figure 19. Brazil Iced Tea Revenue (USD Million) By Country (2021-2032)
Figure 20. Argentina Iced Tea Revenue (USD Million) By Country (2021-2032)
Figure 21. Rest of Asia Pacific Iced Tea Revenue (USD Million) By Country (2021-2032)
Figure 22. Middle East and Africa Iced Tea Revenue (USD Million) By Region (2021-2032)
Figure 23. Saudi Arabia Iced Tea Revenue (USD Million) By Region (2021-2032)
Figure 24. The UAE Iced Tea Revenue (USD Million) By Region (2021-2032)
Figure 25. Rest of Middle East Iced Tea Revenue (USD Million) By Region (2021-2032)
Figure 26. South Africa Iced Tea Revenue (USD Million) By Region (2021-2032)
Figure 27. Africa Iced Tea Revenue (USD Million) By Region (2021-2032)
Figure 28. North America Iced Tea Revenue (USD Million) By Type (2021-2032)
Figure 29. North America Iced Tea Revenue (USD Million) By Application (2021-2032)
Figure 30. North America Iced Tea Revenue (USD Million) By Product (2021-2032)
Figure 31. Europe Iced Tea Revenue (USD Million) By Type (2021-2032)
Figure 32. Europe Iced Tea Revenue (USD Million) By Application (2021-2032)
Figure 33. Europe Iced Tea Revenue (USD Million) By Product (2021-2032)
Figure 34. Asia Pacific Iced Tea Revenue (USD Million) By Type (2021-2032)
Figure 35. Asia Pacific Iced Tea Revenue (USD Million) By Application (2021-2032)
Figure 36. Asia Pacific Iced Tea Revenue (USD Million) By Product (2021-2032)
Figure 37. South America Iced Tea Revenue (USD Million) By Type (2021-2032)
Figure 38. South America Iced Tea Revenue (USD Million) By Application (2021-2032)
Figure 39. South America Iced Tea Revenue (USD Million) By Product (2021-2032)
Figure 40. Middle East and Africa Iced Tea Revenue (USD Million) By Type (2021-2032)
Figure 41. Middle East and Africa Iced Tea Revenue (USD Million) By Application (2021-2032)
Figure 42. Middle East and Africa Iced Tea Revenue (USD Million) By Product (2021-2032)
By Product
Black Iced Tea
Green Iced Tea
Herbal Iced Tea
Others
By Form
Powder
Liquid
By Distribution Channel
Supermarkets/ Hypermarkets
Convenience Stores
Online Retail Stores
Others
Countries Analyzed
North America (US, Canada, Mexico)
Europe (Germany, UK, France, Spain, Italy, Russia, Rest of Europe)
Asia Pacific (China, India, Japan, South Korea, Australia, South East Asia, Rest of Asia)
South America (Brazil, Argentina, Rest of South America)
Middle East and Africa (Saudi Arabia, UAE, Rest of Middle East, South Africa, Egypt, Rest of Africa)
