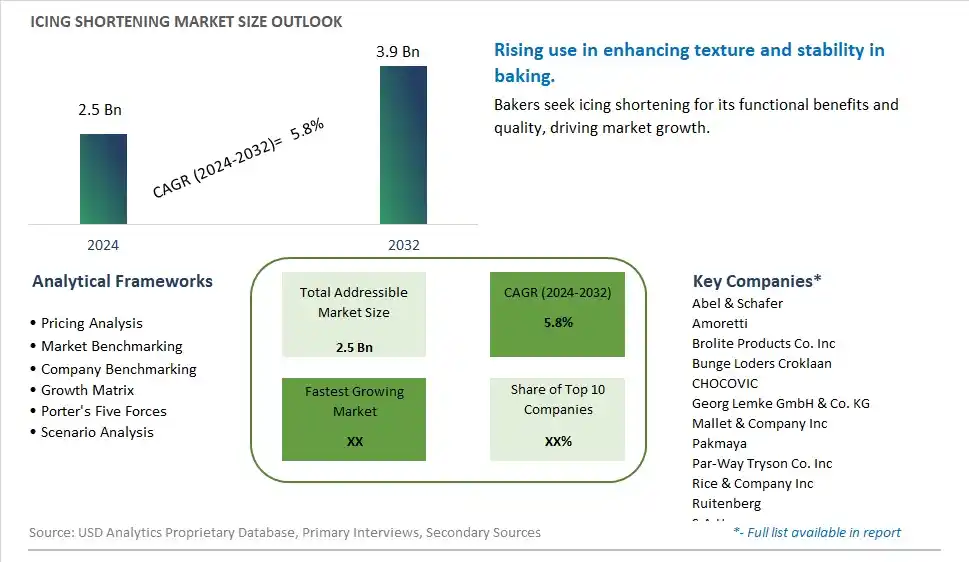
Global Icing Shortening Market Size is valued at $2.5 Billion in 2024 and is forecast to register a growth rate (CAGR) of 5.8% to reach $3.9 Billion by 2032.
The global Icing Shortening Market Comprehensive Study analyzes and forecasts the market size across 6 regions and 24 countries for diverse segments -By Product (PHO-based icing shortening, Non-PHO-based icing shortening), By Fat Type (Animal fat icing shortens, Plant-based fat icing shortening), By End-User (Bread, Cakes and pastries, Cookies and Biscuits, Muffins, Waffles, Pancakes, Others)
An Introduction to Icing Shortening Market
The icing shortening market in 2024 is expanding, driven by the increasing demand for high-quality baked goods and decorative confections. Icing shortening, crucial for achieving the desired texture and stability in frostings and icings, is benefiting from innovations in formulation, including trans-fat-free and plant-based options. The market is witnessing growth in the home baking segment, supported by the popularity of cooking shows and social media trends. Additionally, professional bakers and confectioners are seeking premium shortening products that deliver superior performance and consistent results.
Icing Shortening Competitive Landscape
The market report analyses the leading companies in the industry including Abel & Schafer, Amoretti, Brolite Products Co. Inc, Bunge Loders Croklaan, CHOCOVIC, Georg Lemke GmbH & Co. KG, Mallet & Company Inc, Pakmaya, Par-Way Tryson Co. Inc, Rice & Company Inc, Ruitenberg, S.A.U., Seven Seas Commodities (Pvt) Ltd, Stratas Foods, and Others.
Icing Shortening Market Dynamics
Icing Shortening Market Trend: Shift Towards Trans-Fat-Free and Healthier Alternatives
The most prominent trend in the Icing Shortening Market is the shift towards trans-fat-free and healthier alternatives. With increasing health concerns related to trans fats, consumers and regulatory bodies are pushing for the reduction or elimination of trans fats in food products. This trend is driving manufacturers to develop and offer trans-fat-free icing shortenings made from healthier oils such as palm oil, coconut oil, and high-oleic sunflower oil. The demand for healthier alternatives is reshaping the market as consumers prioritize their health while enjoying baked goods and confections.
Icing Shortening Market Driver: Growing Demand for Bakery and Confectionery Products
A key driver for the Icing Shortening Market is the growing demand for bakery and confectionery products. The increasing consumption of cakes, pastries, cookies, and other baked goods is driving the need for high-quality icing shortenings that enhance texture, stability, and taste. As the bakery and confectionery industries expand globally, manufacturers are focusing on developing icing shortenings that meet the specific requirements of these products. This growing demand is significantly driving the market as icing shortenings play a crucial role in achieving the desired quality and appeal of baked goods.
Icing Shortening Market Opportunity: Innovation in Clean Label and Natural Ingredients
One potential opportunity in the Icing Shortening Market lies in innovation in clean label and natural ingredients. As consumers increasingly seek transparency and natural ingredients in their food products, there is a substantial opportunity to develop icing shortenings made from clean label and minimally processed ingredients. By focusing on natural oils, non-GMO ingredients, and sustainable sourcing, manufacturers can cater to the health-conscious and environmentally aware consumer base. This focus on clean label and natural ingredients can drive market growth and enhance brand differentiation in the competitive icing shortening Market
Icing Shortening Market Share Analysis: Cakes and Pastries segment generated the highest revenue share in the industry
The largest segment in the Icing Shortening Market by end-user is Cakes and Pastries. This segment dominates due to the extensive use of icing shortening in the production of cakes, cupcakes, pastries, and other baked goods that require smooth and creamy icing for decoration and flavor enhancement. Icing shortening plays a crucial role in achieving the desired texture and consistency of icing, ensuring it spreads easily and sets well on baked products. The popularity of cakes and pastries across various occasions such as birthdays, weddings, and celebrations drives consistent demand for quality icing shortening products.
Icing Shortening Market Share Analysis: Cookies and Biscuits is the fastest growing segment over the forecast period to 2032
The fastest growing segment in the Icing Shortening Market by end-user is Cookies and Biscuits. This growth is propelled by the increasing consumer preference for indulgent and visually appealing cookies and biscuits, which often feature decorative icing. Icing shortening is essential in creating intricate designs, glazes, and coatings on cookies and biscuits, enhancing their appeal and marketability. As the demand for premium and artisanal cookies rises, manufacturers are focusing on incorporating high-quality icing shortening that meets health-conscious consumer preferences without compromising on taste or texture.
Icing Shortening Market Share Analysis: Bread segment generated the highest revenue share in the industry
The second largest segment in the Icing Shortening Market by end-user is Bread. Although traditionally associated with cakes and pastries, bread applications also utilize icing shortening for specialty breads that require enriched dough or sweet toppings. Icing shortening helps in improving the texture and crumb structure of bread while enhancing its flavor profile and shelf life. While not as dominant as cakes and pastries, the bread segment represents a significant market share due to the widespread consumption of bread products globally. The Icing Shortening Market showcases varied demand across different end-user segments, with cakes and pastries leading due to their extensive use of icing shortening for decoration and texture. Cookies and biscuits are witnessing rapid growth driven by the rising consumer preference for premium baked goods, followed closely by bread, which continues to rely on icing shortening for enhanced product appeal and quality.
Icing Shortening Market Segmentation
By Product
PHO-based icing shortening
Non-PHO-based icing shortening
By Fat Type
Animal fat icing shortens
Plant-based fat icing shortening
By End-User
Bread
Cakes and pastries
Cookies and Biscuits
Muffins
Waffles
Pancakes
Others
Countries Analyzed
North America (US, Canada, Mexico)
Europe (Germany, UK, France, Spain, Italy, Russia, Rest of Europe)
Asia Pacific (China, India, Japan, South Korea, Australia, South East Asia, Rest of Asia)
South America (Brazil, Argentina, Rest of South America)
Middle East and Africa (Saudi Arabia, UAE, Rest of Middle East, South Africa, Egypt, Rest of Africa)
Icing Shortening Companies Profiled in the Study
Abel & Schafer
Amoretti
Brolite Products Co. Inc
Bunge Loders Croklaan
CHOCOVIC
Georg Lemke GmbH & Co. KG
Mallet & Company Inc
Pakmaya
Par-Way Tryson Co. Inc
Rice & Company Inc
Ruitenberg
S.A.U.
Seven Seas Commodities (Pvt) Ltd
Stratas Foods
*- List Not Exhaustive
Chapter 1. TABLE OF CONTENTS
Chapter 2. Introduction to Icing Shortening Market
2.1. Market Overview
2.2. Key Statistics and Report Highlights
2.3. Scope of the Comprehensive Study
2.3.1. Market Definition
2.3.2 Countries and Regions Covered
2.3.3 Research Objective
2.3.4 Units, Currency, and Conversions
2.3.5 Industry Value Chain
2.4. Key Market Segments
2.5. Key Companies
2.6. Study Period
Chapter 3. Strategic Analysis Review
3.1. Icing Shortening Pricing Analysis and Forecast
3.2. Porter’s Five Forces
3.3. Market Ecosystem
3.4. SWOT Analysis
3.5. Regulatory Scenario
3.3. Effects of Inflation, Russia-Ukraine War, moderating economic growth, and other macroeconomic factors
Chapter 4. Competitive Landscape
4.1. Market Share Analysis
4.1.1. Global Icing Shortening Market Share by Company, 2023
4.1.2. Product Offerings of Leading Icing Shortening Companies
4.2. Market Entropy
4.2.1. New Product Launches in the Industry
4.2.2. Mergers, Acquisitions, Joint ventures, and Partnerships
4.3. Key Strategies and Best Practices
Chapter 5. Global Market Projections: Best, Reference, and Low Case Scenarios
5.1. Growth Analysis- Case Scenario Definitions
5.2. Low Growth Case Scenario Forecasts
5.3. Reference Growth Case Scenario Forecasts
5.4. High Growth Case Scenario Forecasts
Chapter 6. Market Dynamics
6.1. Icing Shortening Market Drivers
6.2. Icing Shortening Market Challenges
6.6. Icing Shortening Market Opportunities
6.4. Icing Shortening Market Trends
Chapter 7. Global Icing Shortening Market Outlook Trends
7.1. Global Icing Shortening Revenue (USD Million) and CAGR (%) by Type (2021-2032)
7.2. Global Icing Shortening Revenue (USD Million) and CAGR (%) by Application (2021-2032)
7.3. Global Icing Shortening Revenue (USD Million) and CAGR (%) by Product (2021-2032)
By Product
PHO-based icing shortening
Non-PHO-based icing shortening
By Fat Type
Animal fat icing shortens
Plant-based fat icing shortening
By End-User
Bread
Cakes and pastries
Cookies and Biscuits
Muffins
Waffles
Pancakes
Others
Chapter 8. Global Icing Shortening Regional Analysis and Outlook
8.1. Global Icing Shortening Revenue (USD Million) By Regions (2021- 2032)
8.2. North America Icing Shortening Revenue (USD Million) by Country (2021-2032)
8.2.1. United States Icing Shortening Regional Analysis and Outlook
8.2.2. Canada Icing Shortening Regional Analysis and Outlook
8.2.3. Mexico Icing Shortening Regional Analysis and Outlook
8.3. Europe Icing Shortening Revenue (USD Million), by Country (2021-2032)
8.3.1. Germany Icing Shortening Regional Analysis and Outlook
8.3.2. France Icing Shortening Regional Analysis and Outlook
8.3.3. United Kingdom Icing Shortening Regional Analysis and Outlook
8.3.4. Spain Icing Shortening Regional Analysis and Outlook
8.3.5. Italy Icing Shortening Regional Analysis and Outlook
8.3.6. Russia Icing Shortening Regional Analysis and Outlook
8.3.7. Rest of Europe Icing Shortening Regional Analysis and Outlook
8.4. Asia Pacific Icing Shortening Revenue (USD Million) by Country (2021-2032)
8.4.1. China Icing Shortening Regional Analysis and Outlook
8.4.2. Japan Icing Shortening Regional Analysis and Outlook
8.4.3. India Icing Shortening Regional Analysis and Outlook
8.4.4. South Korea Icing Shortening Regional Analysis and Outlook
8.4.5. Australia Icing Shortening Regional Analysis and Outlook
8.4.6. South East Asia Icing Shortening Regional Analysis and Outlook
8.4.7. Rest of Asia Pacific Icing Shortening Regional Analysis and Outlook
8.5. South America Icing Shortening Revenue (USD Million), by Country (2021-2032)
8.5.1. Brazil Icing Shortening Regional Analysis and Outlook
8.5.2. Argentina Icing Shortening Regional Analysis and Outlook
8.5.3. Rest of South America Icing Shortening Regional Analysis and Outlook
8.6. Middle East and Africa Icing Shortening Revenue (USD Million) by Country (2021-2032)
8.6.1. Middle East Icing Shortening Regional Analysis and Outlook
8.6.2. Africa Icing Shortening Regional Analysis and Outlook
Chapter 9. North America Icing Shortening Analysis and Outlook
9.1. North America Icing Shortening Revenue (USD Million) by Segments (2021-2032)
9.1.1. North America Icing Shortening Revenue (USD Million) by Type (2021-2032)
9.1.2. North America Icing Shortening Revenue (USD Million) by Application (2021-2032)
9.1.3. North America Icing Shortening Revenue (USD Million) by Product (2021-2032)
By Product
PHO-based icing shortening
Non-PHO-based icing shortening
By Fat Type
Animal fat icing shortens
Plant-based fat icing shortening
By End-User
Bread
Cakes and pastries
Cookies and Biscuits
Muffins
Waffles
Pancakes
Others
Chapter 10. Europe Icing Shortening Analysis and Outlook
10.1. Europe Icing Shortening Revenue (USD Million), by Segments (USD Million) (2021-2032)
10.1.1. Europe Icing Shortening Revenue (USD Million) by Type (2021-2032)
10.1.2. Europe Icing Shortening Revenue (USD Million) by Application (2021-2032)
10.1.3. Europe Icing Shortening Revenue (USD Million) by Product (2021-2032)
By Product
PHO-based icing shortening
Non-PHO-based icing shortening
By Fat Type
Animal fat icing shortens
Plant-based fat icing shortening
By End-User
Bread
Cakes and pastries
Cookies and Biscuits
Muffins
Waffles
Pancakes
Others
Chapter 11. Asia Pacific Icing Shortening Analysis and Outlook
11.1. Asia Pacific Icing Shortening Revenue (USD Million), and Revenue (USD Million) by Segments (2021-2032)
11.1.1. Asia Pacific Icing Shortening Revenue (USD Million) by Type (2021-2032)
11.1.2. Asia Pacific Icing Shortening Revenue (USD Million) by Application (2021-2032)
11.1.3. Asia Pacific Icing Shortening Revenue (USD Million) by Product (2021-2032)
By Product
PHO-based icing shortening
Non-PHO-based icing shortening
By Fat Type
Animal fat icing shortens
Plant-based fat icing shortening
By End-User
Bread
Cakes and pastries
Cookies and Biscuits
Muffins
Waffles
Pancakes
Others
Chapter 12. South America Icing Shortening Analysis and Outlook
12.1. South America Icing Shortening Revenue (USD Million), by Segments (2021-2032)
12.1.1. South America Icing Shortening Revenue (USD Million) by Type (2021-2032)
12.1.2. South America Icing Shortening Revenue (USD Million) by Application (2021-2032)
12.1.3. South America Icing Shortening Revenue (USD Million) by Product (2021-2032)
By Product
PHO-based icing shortening
Non-PHO-based icing shortening
By Fat Type
Animal fat icing shortens
Plant-based fat icing shortening
By End-User
Bread
Cakes and pastries
Cookies and Biscuits
Muffins
Waffles
Pancakes
Others
Chapter 13. Middle East and Africa Icing Shortening Analysis and Outlook
13.1. Middle East and Africa Icing Shortening Revenue (USD Million), by Segments (2021-2032)
13.1.1. Middle East and Africa Icing Shortening Revenue (USD Million) by Type (2021-2032)
13.1.2. Middle East and Africa Icing Shortening Revenue (USD Million) by Application (2021-2032)
13.1.3. Middle East and Africa Icing Shortening Revenue (USD Million) by Product (2021-2032)
By Product
PHO-based icing shortening
Non-PHO-based icing shortening
By Fat Type
Animal fat icing shortens
Plant-based fat icing shortening
By End-User
Bread
Cakes and pastries
Cookies and Biscuits
Muffins
Waffles
Pancakes
Others
Chapter 14. Icing Shortening Company Profiles
14.1 Business Overview
14.2 Product Profiles
14.3 SWOT Profiles
14.5 Recent Developments
14.6 Financial Profile
List of Companies
Abel & Schafer
Amoretti
Brolite Products Co. Inc
Bunge Loders Croklaan
CHOCOVIC
Georg Lemke GmbH & Co. KG
Mallet & Company Inc
Pakmaya
Par-Way Tryson Co. Inc
Rice & Company Inc
Ruitenberg
S.A.U.
Seven Seas Commodities (Pvt) Ltd
Stratas Foods
15. Methodology and Data Sources
15.1 Customization Offerings
15.2 Subscription Services
15.3 Related Reports
15.4 Publisher Expertise
LIST OF TABLES
Table 1 Market Segmentation Analysis
Table 2 Global Icing Shortening Market Share of Leading Companies, 2023
Table 3 Product Offerings of Leading Companies
Table 4 Low Growth Scenario Forecasts
Table 5 Reference Case Growth Scenario
Table 6 High Growth Case Scenario
Table 7 Global Icing Shortening Revenue (USD Million) And CAGR (%) By Type (2021-2032)
Table 8 Global Icing Shortening Revenue (USD Million) And CAGR (%) By Application (2021-2032)
Table 9 Global Icing Shortening Revenue (USD Million) And CAGR (%) By Product (2021-2032)
Table 10 Global Icing Shortening Market Revenue (USD Million) By Regions (2021-2032)
Table 11 Global Icing Shortening Market Share (%) By Regions (2021-2032)
Table 12 North America Icing Shortening Revenue (USD Million) By Country (2021-2032)
Table 13 Europe Icing Shortening Revenue (USD Million) By Country (2021-2032)
Table 14 Asia Pacific Icing Shortening Revenue (USD Million) By Country (2021-2032)
Table 15 South America Icing Shortening Revenue (USD Million) By Country (2021-2032)
Table 16 Middle East and Africa Icing Shortening Revenue (USD Million) By Region (2021-2032)
Table 17 North America Icing Shortening Revenue (USD Million) By Type (2021-2032)
Table 18 North America Icing Shortening Revenue (USD Million) By Application (2021-2032)
Table 19 North America Icing Shortening Revenue (USD Million) By Product (2021-2032)
Table 20 Europe Icing Shortening Revenue (USD Million) By Type (2021-2032)
Table 21 Europe Icing Shortening Revenue (USD Million) By Application (2021-2032)
Table 22 Europe Icing Shortening Revenue (USD Million) By Product (2021-2032)
Table 23 Asia Pacific Icing Shortening Revenue (USD Million) By Type (2021-2032)
Table 24 Asia Pacific Icing Shortening Revenue (USD Million) By Application (2021-2032)
Table 25 Asia Pacific Icing Shortening Revenue (USD Million) By Product (2021-2032)
Table 26 South America Icing Shortening Revenue (USD Million) By Type (2021-2032)
Table 27 South America Icing Shortening Revenue (USD Million) By Application (2021-2032)
Table 28 South America Icing Shortening Revenue (USD Million) By Product (2021-2032)
Table 29 Middle East and Africa Icing Shortening Revenue (USD Million) By Type (2021-2032)
Table 30 Middle East and Africa Icing Shortening Revenue (USD Million) By Application (2021-2032)
Table 31 Middle East and Africa Icing Shortening Revenue (USD Million) By Product (2021-2032)
LIST OF FIGURES
Figure 1. Market Scope
Figure 2. Pricing Forecasts Per Unit, 2023- 2032
Figure 3. Porter’s Five Forces
Figure 4. Global Icing Shortening Market Revenue (USD Million) By Regions (2021-2032)
Figure 5. Global Icing Shortening Market Share (%) By Regions (2023)
Figure 6. North America Icing Shortening Revenue (USD Million) By Country (2021-2032)
Figure 7. United States Icing Shortening Revenue (USD Million) By Country (2021-2032)
Figure 8. Canada Icing Shortening Revenue (USD Million) By Country (2021-2032)
Figure 9. Mexico Icing Shortening Revenue (USD Million) By Country (2021-2032)
Figure 10. Europe Icing Shortening Revenue (USD Million) By Country (2021-2032)
Figure 11. Germany Icing Shortening Revenue (USD Million) By Country (2021-2032)
Figure 12. France Icing Shortening Revenue (USD Million) By Country (2021-2032)
Figure 13. United Kingdom Icing Shortening Revenue (USD Million) By Country (2021-2032)
Figure 14. Spain Icing Shortening Revenue (USD Million) By Country (2021-2032)
Figure 15. Italy Icing Shortening Revenue (USD Million) By Country (2021-2032)
Figure 16. Russia Icing Shortening Revenue (USD Million) By Country (2021-2032)
Figure 17. Rest of Europe Icing Shortening Revenue (USD Million) By Country (2021-2032)
Figure 11. Asia Pacific Icing Shortening Revenue (USD Million) By Country (2021-2032)
Figure 12. China Icing Shortening Revenue (USD Million) By Country (2021-2032)
Figure 13. Japan Icing Shortening Revenue (USD Million) By Country (2021-2032)
Figure 14. India Icing Shortening Revenue (USD Million) By Country (2021-2032)
Figure 15. South Korea Icing Shortening Revenue (USD Million) By Country (2021-2032)
Figure 16. Australia Icing Shortening Revenue (USD Million) By Country (2021-2032)
Figure 17. South East Asia Icing Shortening Revenue (USD Million) By Country (2021-2032)
Figure 18. South America Icing Shortening Revenue (USD Million) By Country (2021-2032)
Figure 19. Brazil Icing Shortening Revenue (USD Million) By Country (2021-2032)
Figure 20. Argentina Icing Shortening Revenue (USD Million) By Country (2021-2032)
Figure 21. Rest of Asia Pacific Icing Shortening Revenue (USD Million) By Country (2021-2032)
Figure 22. Middle East and Africa Icing Shortening Revenue (USD Million) By Region (2021-2032)
Figure 23. Saudi Arabia Icing Shortening Revenue (USD Million) By Region (2021-2032)
Figure 24. The UAE Icing Shortening Revenue (USD Million) By Region (2021-2032)
Figure 25. Rest of Middle East Icing Shortening Revenue (USD Million) By Region (2021-2032)
Figure 26. South Africa Icing Shortening Revenue (USD Million) By Region (2021-2032)
Figure 27. Africa Icing Shortening Revenue (USD Million) By Region (2021-2032)
Figure 28. North America Icing Shortening Revenue (USD Million) By Type (2021-2032)
Figure 29. North America Icing Shortening Revenue (USD Million) By Application (2021-2032)
Figure 30. North America Icing Shortening Revenue (USD Million) By Product (2021-2032)
Figure 31. Europe Icing Shortening Revenue (USD Million) By Type (2021-2032)
Figure 32. Europe Icing Shortening Revenue (USD Million) By Application (2021-2032)
Figure 33. Europe Icing Shortening Revenue (USD Million) By Product (2021-2032)
Figure 34. Asia Pacific Icing Shortening Revenue (USD Million) By Type (2021-2032)
Figure 35. Asia Pacific Icing Shortening Revenue (USD Million) By Application (2021-2032)
Figure 36. Asia Pacific Icing Shortening Revenue (USD Million) By Product (2021-2032)
Figure 37. South America Icing Shortening Revenue (USD Million) By Type (2021-2032)
Figure 38. South America Icing Shortening Revenue (USD Million) By Application (2021-2032)
Figure 39. South America Icing Shortening Revenue (USD Million) By Product (2021-2032)
Figure 40. Middle East and Africa Icing Shortening Revenue (USD Million) By Type (2021-2032)
Figure 41. Middle East and Africa Icing Shortening Revenue (USD Million) By Application (2021-2032)
Figure 42. Middle East and Africa Icing Shortening Revenue (USD Million) By Product (2021-2032)
By Product
PHO-based icing shortening
Non-PHO-based icing shortening
By Fat Type
Animal fat icing shortens
Plant-based fat icing shortening
By End-User
Bread
Cakes and pastries
Cookies and Biscuits
Muffins
Waffles
Pancakes
Others
Countries Analyzed
North America (US, Canada, Mexico)
Europe (Germany, UK, France, Spain, Italy, Russia, Rest of Europe)
Asia Pacific (China, India, Japan, South Korea, Australia, South East Asia, Rest of Asia)
South America (Brazil, Argentina, Rest of South America)
Middle East and Africa (Saudi Arabia, UAE, Rest of Middle East, South Africa, Egypt, Rest of Africa)
