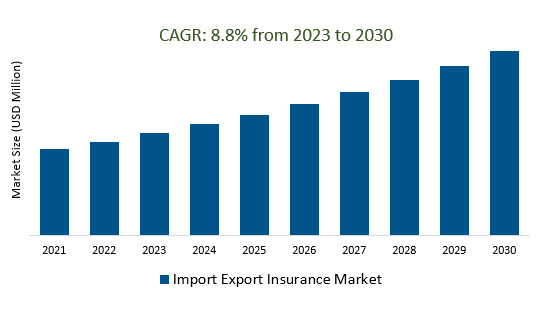
The Global Import Export Insurance Market Size is estimated to register high growth over the forecast period from 2023 to 2030.
The market growth is driven by the increasing growth of digital trade and online transactions have led to an increased need for insurance coverage against cyberattacks and data breaches. Leading companies that are focused on Digital Transformation, Data Analytics and AI, Customized Risk Assessment, Sustainability and ESG Integration, Supply Chain Resilience, Cross-Border E-commerce, Cybersecurity Insurance, Collaboration with Insurtech, Global Health Preparedness, and others to boost market shares in the industry.
Market Overview
The Import Export Insurance Market provides crucial coverage to businesses involved in international trade by mitigating financial risks, including non-payment by buyers, political instability, supply chain disruptions, and damage to goods during transit. Key players in this market include Euler Hermes, Atradius, and Coface, offering various types of insurance such as credit, political risk, cargo, and marine insurance trends include the growing use of digital technology, an emphasis on sustainability and ESG factors, increased focus on supply chain resilience, and heightened demand for coverage against geopolitical risks and the challenges posed by e-commerce and cross-border trade.
Market Dynamics
Market Trends - Import Export Insurance Market: Global Trade Dynamics Driving Demand
Global trade dynamics are a primary driver of the Import-Export Insurance Market, as it provides essential coverage for businesses engaged in international trade to mitigate financial risks such as non-payment, political uncertainty, supply chain disruptions, and transit damage. Key industry players like Euler Hermes, Atradius, and Coface offer specialized insurance products to meet the needs of exporters and importers. As global trade continues to grow and evolve, the demand for import-export insurance remains strong, making it a vital component of international commerce.
Market Driver- Trade Finance Integration Demand Import Export Insurance Market
The Import Export Insurance Market is witnessing increasing demand driven by the integration of trade finance services. The convergence of trade finance and insurance solutions is becoming crucial for businesses engaged in international trade. This integration provides comprehensive coverage, addressing financial and risk management aspects of cross-border transactions.
Market Opportunity-Introduction of Technological Advancements
Technological advancements, including blockchain for secure transactions and smart contracts, AI and machine learning for risk assessment and automation, IoT for real-time monitoring, data analytics for insights, digital platforms for convenience, geospatial tech for location-based risk assessment, cybersecurity measures, chatbots for customer service, AR and VR for training, RegTech for compliance, mobile apps for accessibility, and big data for predictive analytics, are revolutionizing the import-export insurance market, enhancing efficiency, transparency, and risk management for insurers, exporters, and importers alike.
Market Share Analysis- Export Credit Insurance Import Export Insurance Market will register the fastest growth
The Global Import Export Insurance Market is analyzed across Export Credit Insurance, Marine Insurance, Political Risk Insurance, International Product Liability, and others. Export Credit Insurance is poised to register the fastest growth. Export credit insurance, a vital aspect of the import-export insurance market, shields exporters from non-payment risks by overseas buyers, bolstering their global expansion efforts. Leveraging technology like AI, data analytics, and blockchain, export credit insurers expedite underwriting, improve risk evaluation, and streamline claims processing. This insurance fosters international trade by reducing financial uncertainties, encouraging businesses to explore new markets, and safeguarding their interests.
Market Share Analysis- Manufacturing held a significant market share in 2023
The Global Import Export Insurance Market is analyzed across various applications including Manufacturing, Agriculture, Energy, Retail, and others. Of these, Manufacturing held a significant market share in 2023. Manufacturing advancements, driven by technologies like Industry 4.0 and automation, significantly impact the import-export insurance market by improving production efficiency, supply chain management, and product quality. These advancements influence insurance premiums and coverage terms, as they reduce the risk of damage or loss during transit. Moreover, enhanced manufacturing capabilities enable quicker response to market demands, altering the nature and volume of products traded internationally, and ultimately shaping the risk profiles and insurance needs of businesses engaged in global trade.
Import Export Insurance Market Segmentation
By Type
- Export Credit Insurance
- Marine Insurance
- Political Risk Insurance
- International Product Liability
- Others
By Application
- Manufacturing
- Agriculture
- Energy
- Retail
- Others
By Organization Size
By Region
- North America (United States, Canada, Mexico)
- Europe (Germany, France, United Kingdom, Spain, Italy, Others)
- Asia Pacific (China, India, Japan, South Korea, Australia, Others)
- Latin America (Brazil, Argentina, Others)
- Middle East and Africa (Saudi Arabia, UAE, Kuwait, Other Middle East, South Africa, Nigeria, Other Africa)
Import Export Insurance Market Companies
- Tokio Marine Holdings (Japan)
- Euler Hermes (France)
- Coface (France)
- Atradius (Netherlands)
- Zurich Insurance Group (Switzerland)
- AIG (American International Group) (United States)
- Chubb Limited (Switzerland)
- Allianz SE (Germany)
- Liberty Mutual Insurance (United States)
- QBE Insurance Group (Australia)
- Sompo Holdings (Japan)
- AXA XL (France)
*List not exhaustive
Import Export Insurance Market Outlook 2023
1 Market Overview
1.1 Introduction to the Import Export Insurance Market
1.2 Scope of the Study
1.3 Research Objective
1.3.1 Key Market Scope and Segments
1.3.2 Players Covered
1.3.3 Years Considered
2 Executive Summary
2.1 2023 Import Export Insurance Industry- Market Statistics
3 Market Dynamics
3.1 Market Drivers
3.2 Market Challenges
3.3 Market Opportunities
3.4 Market Trends
4 Market Factor Analysis
4.1 Porter’s Five Forces
4.2 Market Entropy
4.2.1 Global Import Export Insurance Market Companies with Area Served
4.2.2 Products Offerings Global Import Export Insurance Market
5 COVID-19 Impact Analysis and Outlook Scenarios
5.1.1 Covid-19 Impact Analysis
5.1.2 Post-COVID-19 Scenario- Low Growth Case
5.1.3 Post-COVID-19 Scenario- Reference Growth Case
5.1.4 Post-COVID-19 Scenario- Low Growth Case
6 Global Import Export Insurance Market Trends
6.1 Global Import Export Insurance Revenue (USD Million) and CAGR (%) by Type (2018-2030)
6.2 Global Import Export Insurance Revenue (USD Million) and CAGR (%) by Applications (2018-2030)
6.3 Global Import Export Insurance Revenue (USD Million) and CAGR (%) by Regions (2018-2030)
7 Global Import Export Insurance Market Revenue (USD Million) by Type, and Applications (2018-2022)
7.1 Global Import Export Insurance Revenue (USD Million) by Type (2018-2022)
7.1.1 Global Import Export Insurance Revenue (USD Million), Market Share (%) by Type (2018-2022)
7.2 Global Import Export Insurance Revenue (USD Million) by Applications (2018-2022)
7.2.1 Global Import Export Insurance Revenue (USD Million), Market Share (%) by Applications (2018-2022)
8 Global Import Export Insurance Development Regional Status and Outlook
8.1 Global Import Export Insurance Revenue (USD Million) By Regions (2018-2022)
8.2 North America Import Export Insurance Revenue (USD Million) by Type, and Application (2018-2022)
8.2.1 North America Import Export Insurance Revenue (USD Million) by Country (2018-2022)
8.2.2 North America Import Export Insurance Revenue (USD Million) by Type (2018-2022)
8.2.3 North America Import Export Insurance Revenue (USD Million) by Applications (2018-2022)
8.3 Europe Import Export Insurance Revenue (USD Million), by Type, and Applications (USD Million) (2018-2022)
8.3.1 Europe Import Export Insurance Revenue (USD Million), by Country (2018-2022)
8.3.2 Europe Import Export Insurance Revenue (USD Million) by Type (2018-2022)
8.3.3 Europe Import Export Insurance Revenue (USD Million) by Applications (2018-2022)
8.4 Asia Pacific Import Export Insurance Revenue (USD Million), and Revenue (USD Million) by Type, and Applications (2018-2022)
8.4.1 Asia Pacific Import Export Insurance Revenue (USD Million) by Country (2018-2022)
8.4.2 Asia Pacific Import Export Insurance Revenue (USD Million) by Type (2018-2022)
8.4.3 Asia Pacific Import Export Insurance Revenue (USD Million) by Applications (2018-2022)
8.5 South America Import Export Insurance Revenue (USD Million), by Type, and Applications (2018-2022)
8.5.1 South America Import Export Insurance Revenue (USD Million), by Country (2018-2022)
8.5.2 South America Import Export Insurance Revenue (USD Million) by Type (2018-2022)
8.5.3 South America Import Export Insurance Revenue (USD Million) by Applications (2018-2022)
8.6 Middle East and Africa Import Export Insurance Revenue (USD Million), by Type, Technology, Application, Thickness (2018-2022)
8.6.1 Middle East and Africa Import Export Insurance Revenue (USD Million) by Country (2018-2022)
8.6.2 Middle East and Africa Import Export Insurance Revenue (USD Million) by Type (2018-2022)
8.6.3 Middle East and Africa Import Export Insurance Revenue (USD Million) by Applications (2018-2022)
9 Company Profiles
10 Global Import Export Insurance Market Revenue (USD Million), by Type, and Applications (2023-2030)
10.1 Global Import Export Insurance Revenue (USD Million) and Market Share (%) by Type (2023-2030)
10.1.1 Global Import Export Insurance Revenue (USD Million), and Market Share (%) by Type (2023-2030)
10.2 Global Import Export Insurance Revenue (USD Million) and Market Share (%) by Applications (2023-2030)
10.2.1 Global Import Export Insurance Revenue (USD Million), and Market Share (%) by Applications (2023-2030)
11 Global Import Export Insurance Development Regional Status and Outlook Forecast
11.1 Global Import Export Insurance Revenue (USD Million) By Regions (2023-2030)
11.2 North America Import Export Insurance Revenue (USD Million) by Type, and Applications (2023-2030)
11.2.1 North America Import Export Insurance Revenue (USD) Million by Country (2023-2030)
11.2.2 North America Import Export Insurance Revenue (USD Million), by Type (2023-2030)
11.2.3 North America Import Export Insurance Revenue (USD Million), Market Share (%) by Applications (2023-2030)
11.3 Europe Import Export Insurance Revenue (USD Million), by Type, and Applications (2023-2030)
11.3.1 Europe Import Export Insurance Revenue (USD Million), by Country (2023-2030)
11.3.2 Europe Import Export Insurance Revenue (USD Million), by Type (2023-2030)
11.3.3 Europe Import Export Insurance Revenue (USD Million), by Applications (2023-2030)
11.4 Asia Pacific Import Export Insurance Revenue (USD Million) by Type, and Applications (2023-2030)
11.4.1 Asia Pacific Import Export Insurance Revenue (USD Million), by Country (2023-2030)
11.4.2 Asia Pacific Import Export Insurance Revenue (USD Million), by Type (2023-2030)
11.4.3 Asia Pacific Import Export Insurance Revenue (USD Million), by Applications (2023-2030)
11.5 South America Import Export Insurance Revenue (USD Million), by Type, and Applications (2023-2030)
11.5.1 South America Import Export Insurance Revenue (USD Million), by Country (2023-2030)
11.5.2 South America Import Export Insurance Revenue (USD Million), by Type (2023-2030)
11.5.3 South America Import Export Insurance Revenue (USD Million), by Applications (2023-2030)
11.6 Middle East and Africa Import Export Insurance Revenue (USD Million), by Type, and Applications (2023-2030)
11.6.1 Middle East and Africa Import Export Insurance Revenue (USD Million), by Region (2023-2030)
11.6.2 Middle East and Africa Import Export Insurance Revenue (USD Million), by Type (2023-2030)
11.6.3 Middle East and Africa Import Export Insurance Revenue (USD Million), by Applications (2023-2030)
12 Methodology and Data Sources
12.1 Methodology/Research Approach
12.1.1 Research Programs/Design
12.1.2 Market Size Estimation
12.1.3 Market Breakdown and Data Triangulation
12.2 Data Sources
12.2.1 Secondary Sources
12.2.2 Primary Sources
12.3 Disclaimer
List of Tables
Table 1 Market Segmentation Analysis
Table 2 Global Import Export Insurance Market Companies with Areas Served
Table 3 Products Offerings Global Import Export Insurance Market
Table 4 Low Growth Scenario Forecasts
Table 5 Reference Case Growth Scenario
Table 6 High Growth Case Scenario
Table 7 Global Import Export Insurance Revenue (USD Million) And CAGR (%) By Type (2018-2030)
Table 8 Global Import Export Insurance Revenue (USD Million) And CAGR (%) By Applications (2018-2030)
Table 9 Global Import Export Insurance Revenue (USD Million) And CAGR (%) By Regions (2018-2030)
Table 10 Global Import Export Insurance Revenue (USD Million) By Type (2018-2022)
Table 11 Global Import Export Insurance Revenue Market Share (%) By Type (2018-2022)
Table 12 Global Import Export Insurance Revenue (USD Million) By Applications (2018-2022)
Table 13 Global Import Export Insurance Revenue Market Share (%) By Applications (2018-2022)
Table 14 Global Import Export Insurance Market Revenue (USD Million) By Regions (2018-2022)
Table 15 Global Import Export Insurance Market Share (%) By Regions (2018-2022)
Table 16 North America Import Export Insurance Revenue (USD Million) By Country (2018-2022)
Table 17 North America Import Export Insurance Revenue (USD Million) By Type (2018-2022)
Table 18 North America Import Export Insurance Revenue (USD Million) By Applications (2018-2022)
Table 19 Europe Import Export Insurance Revenue (USD Million) By Country (2018-2022)
Table 20 Europe Import Export Insurance Revenue (USD Million) By Type (2018-2022)
Table 21 Europe Import Export Insurance Revenue (USD Million) By Applications (2018-2022)
Table 22 Asia Pacific Import Export Insurance Revenue (USD Million) By Country (2018-2022)
Table 23 Asia Pacific Import Export Insurance Revenue (USD Million) By Type (2018-2022)
Table 24 Asia Pacific Import Export Insurance Revenue (USD Million) By Applications (2018-2022)
Table 25 South America Import Export Insurance Revenue (USD Million) By Country (2018-2022)
Table 26 South America Import Export Insurance Revenue (USD Million) By Type (2018-2022)
Table 27 South America Import Export Insurance Revenue (USD Million) By Applications (2018-2022)
Table 28 Middle East and Africa Import Export Insurance Revenue (USD Million) By Region (2018-2022)
Table 29 Middle East and Africa Import Export Insurance Revenue (USD Million) By Type (2018-2022)
Table 30 Middle East and Africa Import Export Insurance Revenue (USD Million) By Applications (2018-2022)
Table 31 Financial Analysis
Table 32 Global Import Export Insurance Revenue (USD Million) By Type (2023-2030)
Table 33 Global Import Export Insurance Revenue Market Share (%) By Type (2023-2030)
Table 34 Global Import Export Insurance Revenue (USD Million) By Applications (2023-2030)
Table 35 Global Import Export Insurance Revenue Market Share (%) By Applications (2023-2030)
Table 36 Global Import Export Insurance Market Revenue (USD Million), And Revenue (USD Million) By Regions (2023-2030)
Table 37 North America Import Export Insurance Revenue (USD)By Country (2023-2030)
Table 38 North America Import Export Insurance Revenue (USD Million) By Type (2023-2030)
Table 39 North America Import Export Insurance Revenue (USD Million) By Applications (2023-2030)
Table 40 Europe Import Export Insurance Revenue (USD Million) By Country (2023-2030)
Table 41 Europe Import Export Insurance Revenue (USD Million) By Type (2023-2030)
Table 42 Europe Import Export Insurance Revenue (USD Million) By Applications (2023-2030)
Table 43 Asia Pacific Import Export Insurance Revenue (USD Million) By Country (2023-2030)
Table 44 Asia Pacific Import Export Insurance Revenue (USD Million) By Type (2023-2030)
Table 45 Asia Pacific Import Export Insurance Revenue (USD Million) By Applications (2023-2030)
Table 46 South America Import Export Insurance Revenue (USD Million) By Country (2023-2030)
Table 47 South America Import Export Insurance Revenue (USD Million) By Type (2023-2030)
Table 48 South America Import Export Insurance Revenue (USD Million) By Applications (2023-2030)
Table 49 Middle East and Africa Import Export Insurance Revenue (USD Million) By Region (2023-2030)
Table 50 Middle East and Africa Import Export Insurance Revenue (USD Million) By Region (2023-2030)
Table 51 Middle East and Africa Import Export Insurance Revenue (USD Million) By Type (2023-2030)
Table 52 Middle East and Africa Import Export Insurance Revenue (USD Million) By Applications (2023-2030)
Table 53 Research Programs/Design for This Report
Table 54 Key Data Information from Secondary Sources
Table 55 Key Data Information from Primary Sources
List of Figures
Figure 1 Market Scope
Figure 2 Porter’s Five Forces
Figure 3 Global Import Export Insurance Revenue (USD Million) By Type (2018-2022)
Figure 4 Global Import Export Insurance Revenue Market Share (%) By Type (2022)
Figure 5 Global Import Export Insurance Revenue (USD Million) By Applications (2018-2022)
Figure 6 Global Import Export Insurance Revenue Market Share (%) By Applications (2022)
Figure 7 Global Import Export Insurance Market Revenue (USD Million) By Regions (2018-2022)
Figure 8 Global Import Export Insurance Market Share (%) By Regions (2022)
Figure 9 North America Import Export Insurance Revenue (USD Million) By Country (2018-2022)
Figure 10 North America Import Export Insurance Revenue (USD Million) By Type (2018-2022)
Figure 11 North America Import Export Insurance Revenue (USD Million) By Applications (2018-2022)
Figure 12 Europe Import Export Insurance Revenue (USD Million) By Country (2018-2022)
Figure 13 Europe Import Export Insurance Revenue (USD Million) By Type (2018-2022)
Figure 14 Europe Import Export Insurance Revenue (USD Million) By Applications (2018-2022)
Figure 15 Asia Pacific Import Export Insurance Revenue (USD Million) By Country (2018-2022)
Figure 16 Asia Pacific Import Export Insurance Revenue (USD Million) By Type (2018-2022)
Figure 17 Asia Pacific Import Export Insurance Revenue (USD Million) By Applications (2018-2022)
Figure 18 South America Import Export Insurance Revenue (USD Million) By Country (2018-2022)
Figure 19 South America Import Export Insurance Revenue (USD Million) By Type (2018-2022)
Figure 20 South America Import Export Insurance Revenue (USD Million) By Applications (2018-2022)
Figure 21 Middle East and Africa Import Export Insurance Revenue (USD Million) By Region (2018-2022)
Figure 22 Middle East and Africa Import Export Insurance Revenue (USD Million) By Type (2018-2022)
Figure 23 Middle East and Africa Import Export Insurance Revenue (USD Million) By Applications (2018-2022)
Figure 24 Global Import Export Insurance Revenue (USD Million) By Type (2023-2030)
Figure 25 Global Import Export Insurance Revenue Market Share (%) By Type (2030)
Figure 26 Global Import Export Insurance Revenue (USD Million) By Applications (2023-2030)
Figure 27 Global Import Export Insurance Revenue Market Share (%) By Applications (2030)
Figure 28 Global Import Export Insurance Market Revenue (USD Million) By Regions (2023-2030)
Figure 29 North America Import Export Insurance Revenue (USD Million) By Country (2023-2030)
Figure 30 North America Import Export Insurance Revenue (USD Million) By Type (2023-2030)
Figure 31 North America Import Export Insurance Revenue (USD Million) By Applications (2023-2030)
Figure 32 Europe Import Export Insurance Revenue (USD Million) By Country (2023-2030)
Figure 33 Europe Import Export Insurance Revenue (USD Million) By Type (2023-2030)
Figure 34 Europe Import Export Insurance Revenue (USD Million) By Applications (2023-2030)
Figure 35 Asia Pacific Import Export Insurance Revenue (USD Million) By Country (2023-2030)
Figure 36 Asia Pacific Import Export Insurance Revenue (USD Million) By Type (2023-2030)
Figure 37 Asia Pacific Import Export Insurance Revenue (USD Million) By Applications (2023-2030)
Figure 38 South America Import Export Insurance Revenue (USD Million) By Country (2023-2030)
Figure 39 South America Import Export Insurance Revenue (USD Million) By Type (2023-2030)
Figure 40 South America Import Export Insurance Revenue (USD Million) By Applications (2023-2030)
Figure 41 Middle East and Africa Import Export Insurance Revenue (USD Million) By Region (2023-2030)
Figure 42 Middle East and Africa Import Export Insurance Revenue (USD Million) By Region (2023-2030)
Figure 43 Middle East and Africa Import Export Insurance Revenue (USD Million) By Type (2023-2030)
Figure 44 Middle East and Africa Import Export Insurance Revenue (USD Million) By Applications (2023-2030)
Figure 45 Bottom-Up and Top-Down Approaches For This Report
Figure 46 Data Triangulation
