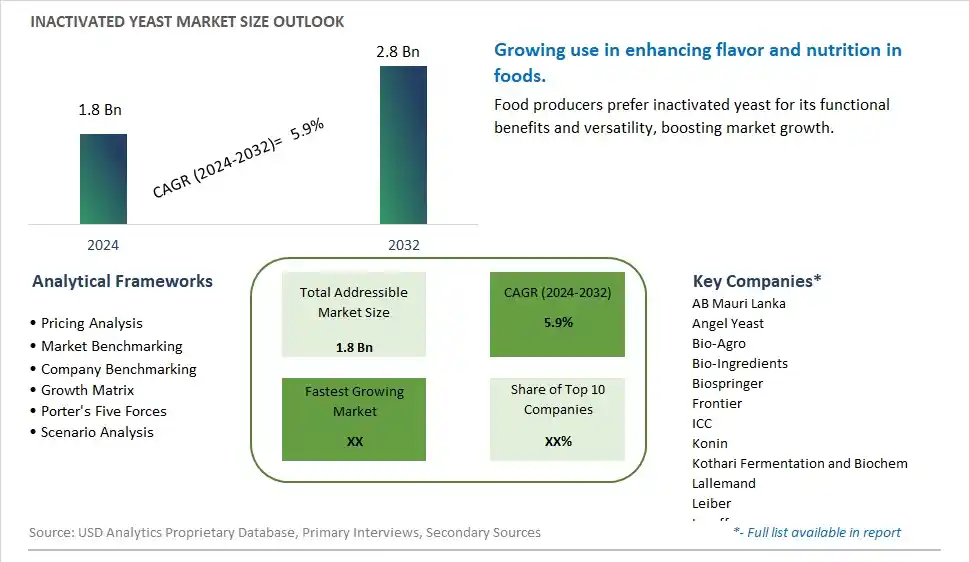
Global Inactivated Yeast Market Size is valued at $1.8 Billion in 2024 and is forecast to register a growth rate (CAGR) of 5.9% to reach $2.8 Billion by 2032.
The global Inactivated Yeast Market Comprehensive Study analyzes and forecasts the market size across 6 regions and 24 countries for diverse segments -By Type (Feed Grade, Food grade, Pharma grade), By Application (Food, Health, Feed)
An Introduction to Inactivated Yeast Market
In 2024, the inactivated yeast market is growing, driven by its versatile applications in food, beverage, and animal feed industries. Inactivated yeast, rich in nutrients and bioactive compounds, is used as a natural flavor enhancer, nutritional supplement, and functional ingredient. The market benefits from the increasing demand for clean label and natural ingredients, as well as the rising awareness of the health benefits associated with yeast-derived products. Innovations in production processes are improving the quality and functionality of inactivated yeast, making it a valuable addition to various formulations.
Inactivated Yeast Competitive Landscape
The market report analyses the leading companies in the industry including AB Mauri Lanka, Angel Yeast, Bio-Agro, Bio-Ingredients, Biospringer, Frontier, ICC, Konin, Kothari Fermentation and Biochem, Lallemand, Leiber, Lesaffre, Ohly, Sojuz Produkt Pitaniya, Titan Biotech Ltd, and Others.
Inactivated Yeast Market Dynamics
Inactivated Yeast Market Trend: Growing Use in Health and Nutritional Supplements
The most prominent trend in the Inactivated Yeast Market is the growing use of inactivated yeast in health and nutritional supplements. Inactivated yeast, known for its high nutritional content, is being increasingly incorporated into dietary supplements and functional foods to enhance their nutritional profile. This trend is driven by the rising consumer demand for natural and nutrient-dense ingredients that support overall health and wellness. The use of inactivated yeast in supplements for its protein, fiber, and essential nutrient content is gaining popularity, encouraging manufacturers to explore its potential in various health products.
Inactivated Yeast Market Driver: Increasing Demand for Natural Food Additives
A key driver for the Inactivated Yeast Market is the increasing demand for natural food additives. As consumers become more conscious of the ingredients in their food, there is a growing preference for natural and minimally processed additives. Inactivated yeast, used as a flavor enhancer, nutritional booster, and natural preservative, fits this demand perfectly. The trend towards clean label products and the desire for natural food solutions are significantly driving the market for inactivated yeast as manufacturers seek to meet consumer preferences for healthier and more transparent food options.
Inactivated Yeast Market Opportunity: Expansion into Pet Food and Animal Feed
One potential opportunity in the Inactivated Yeast Market lies in the expansion into pet food and animal feed. Inactivated yeast, with its high protein and nutrient content, can be used to enhance the nutritional value of pet food and animal feed products. As pet owners and livestock farmers seek high-quality and nutritious feed options, there is a growing opportunity to incorporate inactivated yeast into these products. This focus on improving animal nutrition can drive market growth and open new avenues for the application of inactivated yeast in the pet food and animal feed industries.
Inactivated Yeast Market Share Analysis: Food Grade segment generated the highest revenue share in the industry
The largest segment in the Inactivated Yeast Market by type is Food Grade. Food-grade inactivated yeast finds extensive application in the food industry due to its nutritional benefits, flavor enhancement properties, and as a natural source of vitamins and minerals. It is widely used as a flavoring agent, food additive, and nutritional supplement in various food products, including bakery goods, soups, sauces, snacks, and beverages. The food-grade variant is processed to maintain its nutritional content and flavor profile, making it suitable for enhancing the taste and nutritional value of a wide range of food items. Its popularity stems from consumers' increasing preference for natural ingredients and clean label products in their diets.
Inactivated Yeast Market Share Analysis: Health is the fastest growing segment over the forecast period to 2032
The fastest growing segment in the Inactivated Yeast Market by application is Health. Inactivated yeast is gaining traction in the health sector due to its rich nutrient profile, including high levels of proteins, vitamins, minerals, and beta-glucans, which are beneficial for immune support, gut health, and overall well-being. It is utilized in dietary supplements, functional foods, and nutraceutical products aimed at promoting immune function, managing cholesterol levels, and supporting digestive health. The growing consumer awareness about preventive healthcare and the demand for natural, functional ingredients drive the expansion of inactivated yeast applications in the health sector. As research continues to uncover its health benefits, the market for inactivated yeast in health applications is expected to experience significant growth in the coming years. Food Grade emerges as the largest segment in the Inactivated Yeast Market, driven by its widespread use in the food industry. Health applications represent the fastest growing segment, fueled by increasing consumer interest in functional foods and dietary supplements that offer health benefits beyond basic nutrition. These trends highlight the versatile applications and expanding market opportunities for inactivated yeast across various industries.
Inactivated Yeast Market Segmentation
By Type
Feed Grade
Food grade
Pharma grade
By Application
Food
Health
Feed
Countries Analyzed
North America (US, Canada, Mexico)
Europe (Germany, UK, France, Spain, Italy, Russia, Rest of Europe)
Asia Pacific (China, India, Japan, South Korea, Australia, South East Asia, Rest of Asia)
South America (Brazil, Argentina, Rest of South America)
Middle East and Africa (Saudi Arabia, UAE, Rest of Middle East, South Africa, Egypt, Rest of Africa)
Inactivated Yeast Companies Profiled in the Study
AB Mauri Lanka
Angel Yeast
Bio-Agro
Bio-Ingredients
Biospringer
Frontier
ICC
Konin
Kothari Fermentation and Biochem
Lallemand
Leiber
Lesaffre
Ohly
Sojuz Produkt Pitaniya
Titan Biotech Ltd
*- List Not Exhaustive
Chapter 1. TABLE OF CONTENTS
Chapter 2. Introduction to Inactivated Yeast Market
2.1. Market Overview
2.2. Key Statistics and Report Highlights
2.3. Scope of the Comprehensive Study
2.3.1. Market Definition
2.3.2 Countries and Regions Covered
2.3.3 Research Objective
2.3.4 Units, Currency, and Conversions
2.3.5 Industry Value Chain
2.4. Key Market Segments
2.5. Key Companies
2.6. Study Period
Chapter 3. Strategic Analysis Review
3.1. Inactivated Yeast Pricing Analysis and Forecast
3.2. Porter’s Five Forces
3.3. Market Ecosystem
3.4. SWOT Analysis
3.5. Regulatory Scenario
3.3. Effects of Inflation, Russia-Ukraine War, moderating economic growth, and other macroeconomic factors
Chapter 4. Competitive Landscape
4.1. Market Share Analysis
4.1.1. Global Inactivated Yeast Market Share by Company, 2023
4.1.2. Product Offerings of Leading Inactivated Yeast Companies
4.2. Market Entropy
4.2.1. New Product Launches in the Industry
4.2.2. Mergers, Acquisitions, Joint ventures, and Partnerships
4.3. Key Strategies and Best Practices
Chapter 5. Global Market Projections: Best, Reference, and Low Case Scenarios
5.1. Growth Analysis- Case Scenario Definitions
5.2. Low Growth Case Scenario Forecasts
5.3. Reference Growth Case Scenario Forecasts
5.4. High Growth Case Scenario Forecasts
Chapter 6. Market Dynamics
6.1. Inactivated Yeast Market Drivers
6.2. Inactivated Yeast Market Challenges
6.6. Inactivated Yeast Market Opportunities
6.4. Inactivated Yeast Market Trends
Chapter 7. Global Inactivated Yeast Market Outlook Trends
7.1. Global Inactivated Yeast Revenue (USD Million) and CAGR (%) by Type (2021-2032)
7.2. Global Inactivated Yeast Revenue (USD Million) and CAGR (%) by Application (2021-2032)
7.3. Global Inactivated Yeast Revenue (USD Million) and CAGR (%) by Product (2021-2032)
By Type
Feed Grade
Food grade
Pharma grade
By Application
Food
Health
Feed
Chapter 8. Global Inactivated Yeast Regional Analysis and Outlook
8.1. Global Inactivated Yeast Revenue (USD Million) By Regions (2021- 2032)
8.2. North America Inactivated Yeast Revenue (USD Million) by Country (2021-2032)
8.2.1. United States Inactivated Yeast Regional Analysis and Outlook
8.2.2. Canada Inactivated Yeast Regional Analysis and Outlook
8.2.3. Mexico Inactivated Yeast Regional Analysis and Outlook
8.3. Europe Inactivated Yeast Revenue (USD Million), by Country (2021-2032)
8.3.1. Germany Inactivated Yeast Regional Analysis and Outlook
8.3.2. France Inactivated Yeast Regional Analysis and Outlook
8.3.3. United Kingdom Inactivated Yeast Regional Analysis and Outlook
8.3.4. Spain Inactivated Yeast Regional Analysis and Outlook
8.3.5. Italy Inactivated Yeast Regional Analysis and Outlook
8.3.6. Russia Inactivated Yeast Regional Analysis and Outlook
8.3.7. Rest of Europe Inactivated Yeast Regional Analysis and Outlook
8.4. Asia Pacific Inactivated Yeast Revenue (USD Million) by Country (2021-2032)
8.4.1. China Inactivated Yeast Regional Analysis and Outlook
8.4.2. Japan Inactivated Yeast Regional Analysis and Outlook
8.4.3. India Inactivated Yeast Regional Analysis and Outlook
8.4.4. South Korea Inactivated Yeast Regional Analysis and Outlook
8.4.5. Australia Inactivated Yeast Regional Analysis and Outlook
8.4.6. South East Asia Inactivated Yeast Regional Analysis and Outlook
8.4.7. Rest of Asia Pacific Inactivated Yeast Regional Analysis and Outlook
8.5. South America Inactivated Yeast Revenue (USD Million), by Country (2021-2032)
8.5.1. Brazil Inactivated Yeast Regional Analysis and Outlook
8.5.2. Argentina Inactivated Yeast Regional Analysis and Outlook
8.5.3. Rest of South America Inactivated Yeast Regional Analysis and Outlook
8.6. Middle East and Africa Inactivated Yeast Revenue (USD Million) by Country (2021-2032)
8.6.1. Middle East Inactivated Yeast Regional Analysis and Outlook
8.6.2. Africa Inactivated Yeast Regional Analysis and Outlook
Chapter 9. North America Inactivated Yeast Analysis and Outlook
9.1. North America Inactivated Yeast Revenue (USD Million) by Segments (2021-2032)
9.1.1. North America Inactivated Yeast Revenue (USD Million) by Type (2021-2032)
9.1.2. North America Inactivated Yeast Revenue (USD Million) by Application (2021-2032)
9.1.3. North America Inactivated Yeast Revenue (USD Million) by Product (2021-2032)
By Type
Feed Grade
Food grade
Pharma grade
By Application
Food
Health
Feed
Chapter 10. Europe Inactivated Yeast Analysis and Outlook
10.1. Europe Inactivated Yeast Revenue (USD Million), by Segments (USD Million) (2021-2032)
10.1.1. Europe Inactivated Yeast Revenue (USD Million) by Type (2021-2032)
10.1.2. Europe Inactivated Yeast Revenue (USD Million) by Application (2021-2032)
10.1.3. Europe Inactivated Yeast Revenue (USD Million) by Product (2021-2032)
By Type
Feed Grade
Food grade
Pharma grade
By Application
Food
Health
Feed
Chapter 11. Asia Pacific Inactivated Yeast Analysis and Outlook
11.1. Asia Pacific Inactivated Yeast Revenue (USD Million), and Revenue (USD Million) by Segments (2021-2032)
11.1.1. Asia Pacific Inactivated Yeast Revenue (USD Million) by Type (2021-2032)
11.1.2. Asia Pacific Inactivated Yeast Revenue (USD Million) by Application (2021-2032)
11.1.3. Asia Pacific Inactivated Yeast Revenue (USD Million) by Product (2021-2032)
By Type
Feed Grade
Food grade
Pharma grade
By Application
Food
Health
Feed
Chapter 12. South America Inactivated Yeast Analysis and Outlook
12.1. South America Inactivated Yeast Revenue (USD Million), by Segments (2021-2032)
12.1.1. South America Inactivated Yeast Revenue (USD Million) by Type (2021-2032)
12.1.2. South America Inactivated Yeast Revenue (USD Million) by Application (2021-2032)
12.1.3. South America Inactivated Yeast Revenue (USD Million) by Product (2021-2032)
By Type
Feed Grade
Food grade
Pharma grade
By Application
Food
Health
Feed
Chapter 13. Middle East and Africa Inactivated Yeast Analysis and Outlook
13.1. Middle East and Africa Inactivated Yeast Revenue (USD Million), by Segments (2021-2032)
13.1.1. Middle East and Africa Inactivated Yeast Revenue (USD Million) by Type (2021-2032)
13.1.2. Middle East and Africa Inactivated Yeast Revenue (USD Million) by Application (2021-2032)
13.1.3. Middle East and Africa Inactivated Yeast Revenue (USD Million) by Product (2021-2032)
By Type
Feed Grade
Food grade
Pharma grade
By Application
Food
Health
Feed
Chapter 14. Inactivated Yeast Company Profiles
14.1 Business Overview
14.2 Product Profiles
14.3 SWOT Profiles
14.5 Recent Developments
14.6 Financial Profile
List of Companies
AB Mauri Lanka
Angel Yeast
Bio-Agro
Bio-Ingredients
Biospringer
Frontier
ICC
Konin
Kothari Fermentation and Biochem
Lallemand
Leiber
Lesaffre
Ohly
Sojuz Produkt Pitaniya
Titan Biotech Ltd
15. Methodology and Data Sources
15.1 Customization Offerings
15.2 Subscription Services
15.3 Related Reports
15.4 Publisher Expertise
LIST OF TABLES
Table 1 Market Segmentation Analysis
Table 2 Global Inactivated Yeast Market Share of Leading Companies, 2023
Table 3 Product Offerings of Leading Companies
Table 4 Low Growth Scenario Forecasts
Table 5 Reference Case Growth Scenario
Table 6 High Growth Case Scenario
Table 7 Global Inactivated Yeast Revenue (USD Million) And CAGR (%) By Type (2021-2032)
Table 8 Global Inactivated Yeast Revenue (USD Million) And CAGR (%) By Application (2021-2032)
Table 9 Global Inactivated Yeast Revenue (USD Million) And CAGR (%) By Product (2021-2032)
Table 10 Global Inactivated Yeast Market Revenue (USD Million) By Regions (2021-2032)
Table 11 Global Inactivated Yeast Market Share (%) By Regions (2021-2032)
Table 12 North America Inactivated Yeast Revenue (USD Million) By Country (2021-2032)
Table 13 Europe Inactivated Yeast Revenue (USD Million) By Country (2021-2032)
Table 14 Asia Pacific Inactivated Yeast Revenue (USD Million) By Country (2021-2032)
Table 15 South America Inactivated Yeast Revenue (USD Million) By Country (2021-2032)
Table 16 Middle East and Africa Inactivated Yeast Revenue (USD Million) By Region (2021-2032)
Table 17 North America Inactivated Yeast Revenue (USD Million) By Type (2021-2032)
Table 18 North America Inactivated Yeast Revenue (USD Million) By Application (2021-2032)
Table 19 North America Inactivated Yeast Revenue (USD Million) By Product (2021-2032)
Table 20 Europe Inactivated Yeast Revenue (USD Million) By Type (2021-2032)
Table 21 Europe Inactivated Yeast Revenue (USD Million) By Application (2021-2032)
Table 22 Europe Inactivated Yeast Revenue (USD Million) By Product (2021-2032)
Table 23 Asia Pacific Inactivated Yeast Revenue (USD Million) By Type (2021-2032)
Table 24 Asia Pacific Inactivated Yeast Revenue (USD Million) By Application (2021-2032)
Table 25 Asia Pacific Inactivated Yeast Revenue (USD Million) By Product (2021-2032)
Table 26 South America Inactivated Yeast Revenue (USD Million) By Type (2021-2032)
Table 27 South America Inactivated Yeast Revenue (USD Million) By Application (2021-2032)
Table 28 South America Inactivated Yeast Revenue (USD Million) By Product (2021-2032)
Table 29 Middle East and Africa Inactivated Yeast Revenue (USD Million) By Type (2021-2032)
Table 30 Middle East and Africa Inactivated Yeast Revenue (USD Million) By Application (2021-2032)
Table 31 Middle East and Africa Inactivated Yeast Revenue (USD Million) By Product (2021-2032)
LIST OF FIGURES
Figure 1. Market Scope
Figure 2. Pricing Forecasts Per Unit, 2023- 2032
Figure 3. Porter’s Five Forces
Figure 4. Global Inactivated Yeast Market Revenue (USD Million) By Regions (2021-2032)
Figure 5. Global Inactivated Yeast Market Share (%) By Regions (2023)
Figure 6. North America Inactivated Yeast Revenue (USD Million) By Country (2021-2032)
Figure 7. United States Inactivated Yeast Revenue (USD Million) By Country (2021-2032)
Figure 8. Canada Inactivated Yeast Revenue (USD Million) By Country (2021-2032)
Figure 9. Mexico Inactivated Yeast Revenue (USD Million) By Country (2021-2032)
Figure 10. Europe Inactivated Yeast Revenue (USD Million) By Country (2021-2032)
Figure 11. Germany Inactivated Yeast Revenue (USD Million) By Country (2021-2032)
Figure 12. France Inactivated Yeast Revenue (USD Million) By Country (2021-2032)
Figure 13. United Kingdom Inactivated Yeast Revenue (USD Million) By Country (2021-2032)
Figure 14. Spain Inactivated Yeast Revenue (USD Million) By Country (2021-2032)
Figure 15. Italy Inactivated Yeast Revenue (USD Million) By Country (2021-2032)
Figure 16. Russia Inactivated Yeast Revenue (USD Million) By Country (2021-2032)
Figure 17. Rest of Europe Inactivated Yeast Revenue (USD Million) By Country (2021-2032)
Figure 11. Asia Pacific Inactivated Yeast Revenue (USD Million) By Country (2021-2032)
Figure 12. China Inactivated Yeast Revenue (USD Million) By Country (2021-2032)
Figure 13. Japan Inactivated Yeast Revenue (USD Million) By Country (2021-2032)
Figure 14. India Inactivated Yeast Revenue (USD Million) By Country (2021-2032)
Figure 15. South Korea Inactivated Yeast Revenue (USD Million) By Country (2021-2032)
Figure 16. Australia Inactivated Yeast Revenue (USD Million) By Country (2021-2032)
Figure 17. South East Asia Inactivated Yeast Revenue (USD Million) By Country (2021-2032)
Figure 18. South America Inactivated Yeast Revenue (USD Million) By Country (2021-2032)
Figure 19. Brazil Inactivated Yeast Revenue (USD Million) By Country (2021-2032)
Figure 20. Argentina Inactivated Yeast Revenue (USD Million) By Country (2021-2032)
Figure 21. Rest of Asia Pacific Inactivated Yeast Revenue (USD Million) By Country (2021-2032)
Figure 22. Middle East and Africa Inactivated Yeast Revenue (USD Million) By Region (2021-2032)
Figure 23. Saudi Arabia Inactivated Yeast Revenue (USD Million) By Region (2021-2032)
Figure 24. The UAE Inactivated Yeast Revenue (USD Million) By Region (2021-2032)
Figure 25. Rest of Middle East Inactivated Yeast Revenue (USD Million) By Region (2021-2032)
Figure 26. South Africa Inactivated Yeast Revenue (USD Million) By Region (2021-2032)
Figure 27. Africa Inactivated Yeast Revenue (USD Million) By Region (2021-2032)
Figure 28. North America Inactivated Yeast Revenue (USD Million) By Type (2021-2032)
Figure 29. North America Inactivated Yeast Revenue (USD Million) By Application (2021-2032)
Figure 30. North America Inactivated Yeast Revenue (USD Million) By Product (2021-2032)
Figure 31. Europe Inactivated Yeast Revenue (USD Million) By Type (2021-2032)
Figure 32. Europe Inactivated Yeast Revenue (USD Million) By Application (2021-2032)
Figure 33. Europe Inactivated Yeast Revenue (USD Million) By Product (2021-2032)
Figure 34. Asia Pacific Inactivated Yeast Revenue (USD Million) By Type (2021-2032)
Figure 35. Asia Pacific Inactivated Yeast Revenue (USD Million) By Application (2021-2032)
Figure 36. Asia Pacific Inactivated Yeast Revenue (USD Million) By Product (2021-2032)
Figure 37. South America Inactivated Yeast Revenue (USD Million) By Type (2021-2032)
Figure 38. South America Inactivated Yeast Revenue (USD Million) By Application (2021-2032)
Figure 39. South America Inactivated Yeast Revenue (USD Million) By Product (2021-2032)
Figure 40. Middle East and Africa Inactivated Yeast Revenue (USD Million) By Type (2021-2032)
Figure 41. Middle East and Africa Inactivated Yeast Revenue (USD Million) By Application (2021-2032)
Figure 42. Middle East and Africa Inactivated Yeast Revenue (USD Million) By Product (2021-2032)
By Type
Feed Grade
Food grade
Pharma grade
By Application
Food
Health
Feed
Countries Analyzed
North America (US, Canada, Mexico)
Europe (Germany, UK, France, Spain, Italy, Russia, Rest of Europe)
Asia Pacific (China, India, Japan, South Korea, Australia, South East Asia, Rest of Asia)
South America (Brazil, Argentina, Rest of South America)
Middle East and Africa (Saudi Arabia, UAE, Rest of Middle East, South Africa, Egypt, Rest of Africa)
