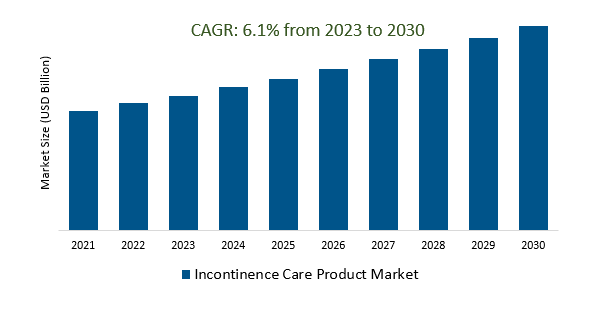
The Global Incontinence Care Product Market Size is estimated to register 6.1% growth over the forecast period from 2023 to 2030.
An increasing adoption of telehealth services drives the market growth and remote patient monitoring has influenced the incontinence care product market. Telehealth platforms enable healthcare professionals to remotely assess and manage incontinence issues, influencing the recommendation and purchase of related products. Leading Companies focusing on smart and Connected Products, Customization and Personalization, Innovations in Biofeedback and Rehabilitation, Inclusion of Nutritional and Lifestyle Components, Integration with Virtual Reality (VR) for Therapy, Global Expansion and Accessibility, and others to boost market shares in the industry.
Market Overview
The Incontinence Care Product Market provides solutions for managing urinary and fecal incontinence, catering to hospitals, home care settings, and consumers through products like disposable adult diapers, reusable undergarments, and absorbent pads. Market growth is driven by factors such as the aging population, technological advancements improving product effectiveness, and increased awareness, while challenges include cost considerations and a shift toward eco-friendly alternatives. The market is dynamic, responding to evolving demographic trends, technological innovations, and environmental concerns.
Market Dynamics
Market Trends- The aging population is increasing the demand for incontinence care products.
The aging global population is driving a substantial increase in demand for incontinence care products. This demographic shift has created lucrative market opportunities for healthcare manufacturers, prompting innovations in product technology to cater to the specific needs of the elderly. The economic implications of this trend underscore the importance of addressing the unique healthcare requirements of an aging society. Public health initiatives and policies must prioritize access to quality incontinence care products to enhance the overall quality of life for the elderly. Additionally, the integration of technology in these products reflects a broader focus on supporting aging in place and ensuring proactive, personalized care approaches. This trend is not confined to specific regions, emphasizing the global nature of the demand for incontinence care solutions.
Market Driver- Advancements in product technology are fueling demand for incontinence care products.
Advancements in incontinence care product technology, including innovative materials, smart features, and user-friendly designs, are driving increased consumer demand. The integration of sensors and connectivity features in smart products allows for real-time monitoring and connectivity to healthcare professionals. Beyond functionality, focusing on eco-friendly and sustainable materials aligns with environmentally conscious consumer preferences. Additionally, technological advancements play a key role in expanding the reach of incontinence care solutions through telehealth and remote monitoring. The market is evolving with the integration of artificial intelligence, contributing to personalized and adaptive solutions for more effective incontinence management.
Market Opportunity- Growing awareness and acceptance of incontinence care products is driving demand.
Growing awareness and acceptance of incontinence care products are propelling demand, signaling a cultural shift that reduces stigma and encourages open dialogue. Educational initiatives and healthcare awareness campaigns empower consumers with information, fostering informed decision-making and a proactive approach to personal health. The demand surge is further driven by the diversity of product offerings and customization options, reflecting a competitive market that caters to varied consumer needs. The normalization of these products in mainstream retail and e-commerce platforms contributes to increased accessibility, while their integration with broader personal care and wellness practices underscores their acceptance as a crucial component of overall well-being.
Market Share Analysis- Absorbents the Incontinence Care Product Market will register the fastest growth
The Global Incontinence Care Product Market is analyzed across Absorbents, non-absorbents, and others. Absorbents are poised to register the fastest growth. In the Incontinence Care Product Market, absorbents are crucial components, encompassing disposable adult diapers, reusable undergarments, and absorbent pads. These products play a vital role in discreetly managing urinary or fecal incontinence, driven by ongoing technological advancements improving absorbency, comfort, and overall effectiveness. A notable trend is the increasing demand for environmentally friendly and sustainable absorbent materials. The absorbents segment reflects a commitment to innovation and meeting diverse needs in the incontinence care product market.
Market Share Analysis- Disposable held a significant market share in 2023
The Global Incontinence Care Product Market is analyzed across various Organizations including· Disposable, Reusable, and others. Of these, Disposable held a significant market share in 2023. The Disposable Incontinence Care Product Market focuses on single-use solutions such as disposable adult diapers and absorbent pads to manage urinary and fecal incontinence. Driven by the aging population and technological advancements, these products offer convenience and hygiene, with a growing trend towards eco-friendly materials. This dynamic segment adapts to changing consumer preferences and healthcare trends within the broader incontinence care market.
Incontinence Care Product Market News
TENA introduces Sensitive Care™ Pads featuring the SkinComfort Formula.
Hanes is launching an affordably-priced line of period underwear called Comfort, Period. This new line is designed to provide consumers with comfort and confidence during periods, including during sleep, offering high-quality period protection at an accessible price point.
Incontinence Care Product Market Segmentation
By Type
- Absorbents
- Non-absorbents
By Usage
By Gender
By Distribution Channel
- E-Commerce
- Retail Pharmacies
- Hospital Pharmacies
By Region
- North America (United States, Canada, Mexico)
- Europe (Germany, France, United Kingdom, Spain, Italy, Others)
- Asia Pacific (China, India, Japan, South Korea, Australia, Others)
- Latin America (Brazil, Argentina, Others)
- Middle East and Africa (Saudi Arabia, UAE, Kuwait, Other Middle East, South Africa, Nigeria, Other Africa)
Incontinence Care Product Market Companies
- The Procter & Gamble Company (US)
- Kimberly-Clark Corporation (US),
- Essity Aktiebolag (Sweden)
- HARTMANN (Germany)
- Ontex BV (Belgium)
- Unicharm Corporation
- First Quality Enterprises Inc
- Coloplast
- Medline Industries
- Domtar Corp
- Svenska Cellulosa
*List not exhaustive
Incontinence Care Product Market Outlook 2023
1 Market Overview
1.1 Introduction to the Incontinence Care Product Market
1.2 Scope of the Study
1.3 Research Objective
1.3.1 Key Market Scope and Segments
1.3.2 Players Covered
1.3.3 Years Considered
2 Executive Summary
2.1 2023 Incontinence Care Product Industry- Market Statistics
3 Market Dynamics
3.1 Market Drivers
3.2 Market Challenges
3.3 Market Opportunities
3.4 Market Trends
4 Market Factor Analysis
4.1 Porter’s Five Forces
4.2 Market Entropy
4.2.1 Global Incontinence Care Product Market Companies with Area Served
4.2.2 Products Offerings Global Incontinence Care Product Market
5 COVID-19 Impact Analysis and Outlook Scenarios
5.1.1 Covid-19 Impact Analysis
5.1.2 Post-COVID-19 Scenario- Low Growth Case
5.1.3 Post-COVID-19 Scenario- Reference Growth Case
5.1.4 Post-COVID-19 Scenario- Low Growth Case
6 Global Incontinence Care Product Market Trends
6.1 Global Incontinence Care Product Revenue (USD Million) and CAGR (%) by Type (2018-2030)
6.2 Global Incontinence Care Product Revenue (USD Million) and CAGR (%) by Applications (2018-2030)
6.3 Global Incontinence Care Product Revenue (USD Million) and CAGR (%) by Regions (2018-2030)
7 Global Incontinence Care Product Market Revenue (USD Million) by Type, and Applications (2018-2022)
7.1 Global Incontinence Care Product Revenue (USD Million) by Type (2018-2022)
7.1.1 Global Incontinence Care Product Revenue (USD Million), Market Share (%) by Type (2018-2022)
7.2 Global Incontinence Care Product Revenue (USD Million) by Applications (2018-2022)
7.2.1 Global Incontinence Care Product Revenue (USD Million), Market Share (%) by Applications (2018-2022)
8 Global Incontinence Care Product Development Regional Status and Outlook
8.1 Global Incontinence Care Product Revenue (USD Million) By Regions (2018-2022)
8.2 North America Incontinence Care Product Revenue (USD Million) by Type, and Application (2018-2022)
8.2.1 North America Incontinence Care Product Revenue (USD Million) by Country (2018-2022)
8.2.2 North America Incontinence Care Product Revenue (USD Million) by Type (2018-2022)
8.2.3 North America Incontinence Care Product Revenue (USD Million) by Applications (2018-2022)
8.3 Europe Incontinence Care Product Revenue (USD Million), by Type, and Applications (USD Million) (2018-2022)
8.3.1 Europe Incontinence Care Product Revenue (USD Million), by Country (2018-2022)
8.3.2 Europe Incontinence Care Product Revenue (USD Million) by Type (2018-2022)
8.3.3 Europe Incontinence Care Product Revenue (USD Million) by Applications (2018-2022)
8.4 Asia Pacific Incontinence Care Product Revenue (USD Million), and Revenue (USD Million) by Type, and Applications (2018-2022)
8.4.1 Asia Pacific Incontinence Care Product Revenue (USD Million) by Country (2018-2022)
8.4.2 Asia Pacific Incontinence Care Product Revenue (USD Million) by Type (2018-2022)
8.4.3 Asia Pacific Incontinence Care Product Revenue (USD Million) by Applications (2018-2022)
8.5 South America Incontinence Care Product Revenue (USD Million), by Type, and Applications (2018-2022)
8.5.1 South America Incontinence Care Product Revenue (USD Million), by Country (2018-2022)
8.5.2 South America Incontinence Care Product Revenue (USD Million) by Type (2018-2022)
8.5.3 South America Incontinence Care Product Revenue (USD Million) by Applications (2018-2022)
8.6 Middle East and Africa Incontinence Care Product Revenue (USD Million), by Type, Technology, Application, Thickness (2018-2022)
8.6.1 Middle East and Africa Incontinence Care Product Revenue (USD Million) by Country (2018-2022)
8.6.2 Middle East and Africa Incontinence Care Product Revenue (USD Million) by Type (2018-2022)
8.6.3 Middle East and Africa Incontinence Care Product Revenue (USD Million) by Applications (2018-2022)
9 Company Profiles
10 Global Incontinence Care Product Market Revenue (USD Million), by Type, and Applications (2023-2030)
10.1 Global Incontinence Care Product Revenue (USD Million) and Market Share (%) by Type (2023-2030)
10.1.1 Global Incontinence Care Product Revenue (USD Million), and Market Share (%) by Type (2023-2030)
10.2 Global Incontinence Care Product Revenue (USD Million) and Market Share (%) by Applications (2023-2030)
10.2.1 Global Incontinence Care Product Revenue (USD Million), and Market Share (%) by Applications (2023-2030)
11 Global Incontinence Care Product Development Regional Status and Outlook Forecast
11.1 Global Incontinence Care Product Revenue (USD Million) By Regions (2023-2030)
11.2 North America Incontinence Care Product Revenue (USD Million) by Type, and Applications (2023-2030)
11.2.1 North America Incontinence Care Product Revenue (USD) Million by Country (2023-2030)
11.2.2 North America Incontinence Care Product Revenue (USD Million), by Type (2023-2030)
11.2.3 North America Incontinence Care Product Revenue (USD Million), Market Share (%) by Applications (2023-2030)
11.3 Europe Incontinence Care Product Revenue (USD Million), by Type, and Applications (2023-2030)
11.3.1 Europe Incontinence Care Product Revenue (USD Million), by Country (2023-2030)
11.3.2 Europe Incontinence Care Product Revenue (USD Million), by Type (2023-2030)
11.3.3 Europe Incontinence Care Product Revenue (USD Million), by Applications (2023-2030)
11.4 Asia Pacific Incontinence Care Product Revenue (USD Million) by Type, and Applications (2023-2030)
11.4.1 Asia Pacific Incontinence Care Product Revenue (USD Million), by Country (2023-2030)
11.4.2 Asia Pacific Incontinence Care Product Revenue (USD Million), by Type (2023-2030)
11.4.3 Asia Pacific Incontinence Care Product Revenue (USD Million), by Applications (2023-2030)
11.5 South America Incontinence Care Product Revenue (USD Million), by Type, and Applications (2023-2030)
11.5.1 South America Incontinence Care Product Revenue (USD Million), by Country (2023-2030)
11.5.2 South America Incontinence Care Product Revenue (USD Million), by Type (2023-2030)
11.5.3 South America Incontinence Care Product Revenue (USD Million), by Applications (2023-2030)
11.6 Middle East and Africa Incontinence Care Product Revenue (USD Million), by Type, and Applications (2023-2030)
11.6.1 Middle East and Africa Incontinence Care Product Revenue (USD Million), by Region (2023-2030)
11.6.2 Middle East and Africa Incontinence Care Product Revenue (USD Million), by Type (2023-2030)
11.6.3 Middle East and Africa Incontinence Care Product Revenue (USD Million), by Applications (2023-2030)
12 Methodology and Data Sources
12.1 Methodology/Research Approach
12.1.1 Research Programs/Design
12.1.2 Market Size Estimation
12.1.3 Market Breakdown and Data Triangulation
12.2 Data Sources
12.2.1 Secondary Sources
12.2.2 Primary Sources
12.3 Disclaimer
List of Tables
Table 1 Market Segmentation Analysis
Table 2 Global Incontinence Care Product Market Companies with Areas Served
Table 3 Products Offerings Global Incontinence Care Product Market
Table 4 Low Growth Scenario Forecasts
Table 5 Reference Case Growth Scenario
Table 6 High Growth Case Scenario
Table 7 Global Incontinence Care Product Revenue (USD Million) And CAGR (%) By Type (2018-2030)
Table 8 Global Incontinence Care Product Revenue (USD Million) And CAGR (%) By Applications (2018-2030)
Table 9 Global Incontinence Care Product Revenue (USD Million) And CAGR (%) By Regions (2018-2030)
Table 10 Global Incontinence Care Product Revenue (USD Million) By Type (2018-2022)
Table 11 Global Incontinence Care Product Revenue Market Share (%) By Type (2018-2022)
Table 12 Global Incontinence Care Product Revenue (USD Million) By Applications (2018-2022)
Table 13 Global Incontinence Care Product Revenue Market Share (%) By Applications (2018-2022)
Table 14 Global Incontinence Care Product Market Revenue (USD Million) By Regions (2018-2022)
Table 15 Global Incontinence Care Product Market Share (%) By Regions (2018-2022)
Table 16 North America Incontinence Care Product Revenue (USD Million) By Country (2018-2022)
Table 17 North America Incontinence Care Product Revenue (USD Million) By Type (2018-2022)
Table 18 North America Incontinence Care Product Revenue (USD Million) By Applications (2018-2022)
Table 19 Europe Incontinence Care Product Revenue (USD Million) By Country (2018-2022)
Table 20 Europe Incontinence Care Product Revenue (USD Million) By Type (2018-2022)
Table 21 Europe Incontinence Care Product Revenue (USD Million) By Applications (2018-2022)
Table 22 Asia Pacific Incontinence Care Product Revenue (USD Million) By Country (2018-2022)
Table 23 Asia Pacific Incontinence Care Product Revenue (USD Million) By Type (2018-2022)
Table 24 Asia Pacific Incontinence Care Product Revenue (USD Million) By Applications (2018-2022)
Table 25 South America Incontinence Care Product Revenue (USD Million) By Country (2018-2022)
Table 26 South America Incontinence Care Product Revenue (USD Million) By Type (2018-2022)
Table 27 South America Incontinence Care Product Revenue (USD Million) By Applications (2018-2022)
Table 28 Middle East and Africa Incontinence Care Product Revenue (USD Million) By Region (2018-2022)
Table 29 Middle East and Africa Incontinence Care Product Revenue (USD Million) By Type (2018-2022)
Table 30 Middle East and Africa Incontinence Care Product Revenue (USD Million) By Applications (2018-2022)
Table 31 Financial Analysis
Table 32 Global Incontinence Care Product Revenue (USD Million) By Type (2023-2030)
Table 33 Global Incontinence Care Product Revenue Market Share (%) By Type (2023-2030)
Table 34 Global Incontinence Care Product Revenue (USD Million) By Applications (2023-2030)
Table 35 Global Incontinence Care Product Revenue Market Share (%) By Applications (2023-2030)
Table 36 Global Incontinence Care Product Market Revenue (USD Million), And Revenue (USD Million) By Regions (2023-2030)
Table 37 North America Incontinence Care Product Revenue (USD)By Country (2023-2030)
Table 38 North America Incontinence Care Product Revenue (USD Million) By Type (2023-2030)
Table 39 North America Incontinence Care Product Revenue (USD Million) By Applications (2023-2030)
Table 40 Europe Incontinence Care Product Revenue (USD Million) By Country (2023-2030)
Table 41 Europe Incontinence Care Product Revenue (USD Million) By Type (2023-2030)
Table 42 Europe Incontinence Care Product Revenue (USD Million) By Applications (2023-2030)
Table 43 Asia Pacific Incontinence Care Product Revenue (USD Million) By Country (2023-2030)
Table 44 Asia Pacific Incontinence Care Product Revenue (USD Million) By Type (2023-2030)
Table 45 Asia Pacific Incontinence Care Product Revenue (USD Million) By Applications (2023-2030)
Table 46 South America Incontinence Care Product Revenue (USD Million) By Country (2023-2030)
Table 47 South America Incontinence Care Product Revenue (USD Million) By Type (2023-2030)
Table 48 South America Incontinence Care Product Revenue (USD Million) By Applications (2023-2030)
Table 49 Middle East and Africa Incontinence Care Product Revenue (USD Million) By Region (2023-2030)
Table 50 Middle East and Africa Incontinence Care Product Revenue (USD Million) By Region (2023-2030)
Table 51 Middle East and Africa Incontinence Care Product Revenue (USD Million) By Type (2023-2030)
Table 52 Middle East and Africa Incontinence Care Product Revenue (USD Million) By Applications (2023-2030)
Table 53 Research Programs/Design for This Report
Table 54 Key Data Information from Secondary Sources
Table 55 Key Data Information from Primary Sources
List of Figures
Figure 1 Market Scope
Figure 2 Porter’s Five Forces
Figure 3 Global Incontinence Care Product Revenue (USD Million) By Type (2018-2022)
Figure 4 Global Incontinence Care Product Revenue Market Share (%) By Type (2022)
Figure 5 Global Incontinence Care Product Revenue (USD Million) By Applications (2018-2022)
Figure 6 Global Incontinence Care Product Revenue Market Share (%) By Applications (2022)
Figure 7 Global Incontinence Care Product Market Revenue (USD Million) By Regions (2018-2022)
Figure 8 Global Incontinence Care Product Market Share (%) By Regions (2022)
Figure 9 North America Incontinence Care Product Revenue (USD Million) By Country (2018-2022)
Figure 10 North America Incontinence Care Product Revenue (USD Million) By Type (2018-2022)
Figure 11 North America Incontinence Care Product Revenue (USD Million) By Applications (2018-2022)
Figure 12 Europe Incontinence Care Product Revenue (USD Million) By Country (2018-2022)
Figure 13 Europe Incontinence Care Product Revenue (USD Million) By Type (2018-2022)
Figure 14 Europe Incontinence Care Product Revenue (USD Million) By Applications (2018-2022)
Figure 15 Asia Pacific Incontinence Care Product Revenue (USD Million) By Country (2018-2022)
Figure 16 Asia Pacific Incontinence Care Product Revenue (USD Million) By Type (2018-2022)
Figure 17 Asia Pacific Incontinence Care Product Revenue (USD Million) By Applications (2018-2022)
Figure 18 South America Incontinence Care Product Revenue (USD Million) By Country (2018-2022)
Figure 19 South America Incontinence Care Product Revenue (USD Million) By Type (2018-2022)
Figure 20 South America Incontinence Care Product Revenue (USD Million) By Applications (2018-2022)
Figure 21 Middle East and Africa Incontinence Care Product Revenue (USD Million) By Region (2018-2022)
Figure 22 Middle East and Africa Incontinence Care Product Revenue (USD Million) By Type (2018-2022)
Figure 23 Middle East and Africa Incontinence Care Product Revenue (USD Million) By Applications (2018-2022)
Figure 24 Global Incontinence Care Product Revenue (USD Million) By Type (2023-2030)
Figure 25 Global Incontinence Care Product Revenue Market Share (%) By Type (2030)
Figure 26 Global Incontinence Care Product Revenue (USD Million) By Applications (2023-2030)
Figure 27 Global Incontinence Care Product Revenue Market Share (%) By Applications (2030)
Figure 28 Global Incontinence Care Product Market Revenue (USD Million) By Regions (2023-2030)
Figure 29 North America Incontinence Care Product Revenue (USD Million) By Country (2023-2030)
Figure 30 North America Incontinence Care Product Revenue (USD Million) By Type (2023-2030)
Figure 31 North America Incontinence Care Product Revenue (USD Million) By Applications (2023-2030)
Figure 32 Europe Incontinence Care Product Revenue (USD Million) By Country (2023-2030)
Figure 33 Europe Incontinence Care Product Revenue (USD Million) By Type (2023-2030)
Figure 34 Europe Incontinence Care Product Revenue (USD Million) By Applications (2023-2030)
Figure 35 Asia Pacific Incontinence Care Product Revenue (USD Million) By Country (2023-2030)
Figure 36 Asia Pacific Incontinence Care Product Revenue (USD Million) By Type (2023-2030)
Figure 37 Asia Pacific Incontinence Care Product Revenue (USD Million) By Applications (2023-2030)
Figure 38 South America Incontinence Care Product Revenue (USD Million) By Country (2023-2030)
Figure 39 South America Incontinence Care Product Revenue (USD Million) By Type (2023-2030)
Figure 40 South America Incontinence Care Product Revenue (USD Million) By Applications (2023-2030)
Figure 41 Middle East and Africa Incontinence Care Product Revenue (USD Million) By Region (2023-2030)
Figure 42 Middle East and Africa Incontinence Care Product Revenue (USD Million) By Region (2023-2030)
Figure 43 Middle East and Africa Incontinence Care Product Revenue (USD Million) By Type (2023-2030)
Figure 44 Middle East and Africa Incontinence Care Product Revenue (USD Million) By Applications (2023-2030)
Figure 45 Bottom-Up and Top-Down Approaches For This Report
Figure 46 Data Triangulation
