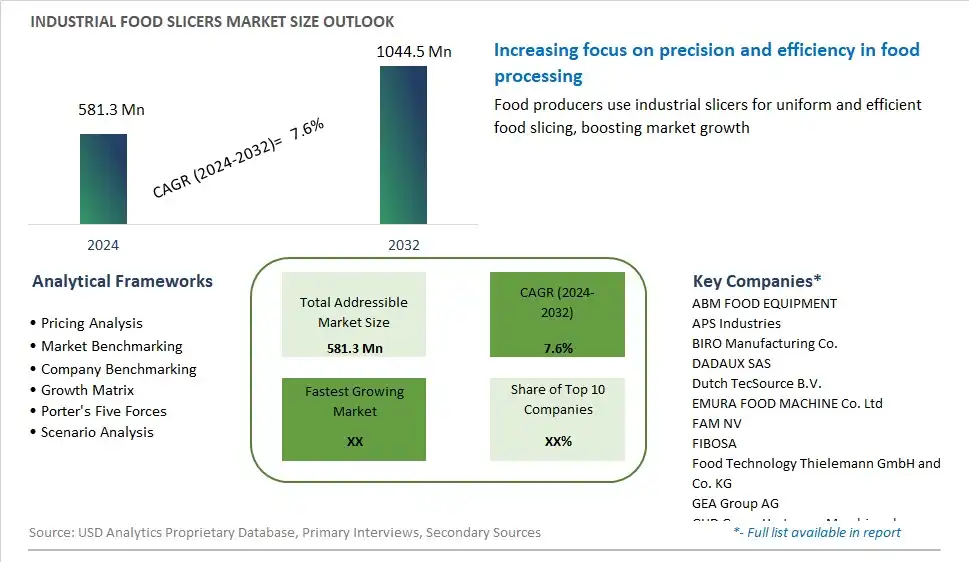
Global Industrial Food Slicers Market Size is valued at $581.3 Million in 2024 and is forecast to register a growth rate (CAGR) of 7.6% to reach $1044.5 Million by 2032.
The global Industrial Food Slicers Market Comprehensive Study analyzes and forecasts the market size across 6 regions and 24 countries for diverse segments -By Application (Fruits And Vegetables, Meat And Poultry, Potatoes, Others)
An Introduction to Industrial Food Slicers Market
In 2024, the market for industrial food slicers continues to evolve as food manufacturers prioritize efficiency, precision, and safety in their food processing operations. Industrial food slicers, also known as meat slicers or deli slicers, are specialized machines used to slice, portion, and prepare various food products, including meats, cheeses, fruits, and vegetables, with consistency and accuracy. With advancements in slicing technology, manufacturers can achieve precise control over slicing thickness, speed, and blade configurations to meet diverse production requirements and product specifications. Moreover, the integration of automation, robotics, and sanitation features has enhanced the efficiency, reliability, and hygiene standards of industrial food slicers, reducing labor costs and minimizing the risk of cross-contamination in food processing facilities. As consumers demand convenient and ready-to-eat food options, the market for industrial food slicers is poised for continued growth and innovation, offering opportunities for customization, automation, and integration with other food processing equipment to optimize production efficiency and meet evolving consumer preferences for sliced foods in retail, foodservice, and convenience store sectors.
Industrial Food Slicers Competitive Landscape
The market report analyses the leading companies in the industry including ABM FOOD EQUIPMENT, APS Industries, BIRO Manufacturing Co., DADAUX SAS, Dutch TecSource B.V., EMURA FOOD MACHINE Co. Ltd, FAM NV, FIBOSA, Food Technology Thielemann GmbH and Co. KG, GEA Group AG, GHD Georg Hartmann Maschinenbau GmbH, Grasselli Spa, Havantec Food Equipment BV, holac Maschinenbau GmbH, ITW Food Equipment Group, JBT FTNON BV, KRONEN GmbH, Marel TREIF GmbH, Urschel Laboratories Inc, Weber Maschinenbau GmbH, and Others.
Industrial Food Slicers Market Dynamics
Industrial Food Slicers Market Trend: Demand for Precision and Efficiency in Food Processing
The market for industrial food slicers is witnessing a prominent trend towards the demand for precision and efficiency in food processing, driven by the need for consistency, quality, and cost-effectiveness in the manufacturing of sliced food products. As food manufacturers strive to meet consumer expectations for uniformity in sliced foods such as deli meats, cheeses, fruits, and vegetables, there is a growing preference for industrial food slicers that offer advanced slicing technology, automation, and customization options. This trend is fueled by factors such as increasing consumption of pre-sliced and packaged foods, advancements in slicing equipment, and the emphasis on food safety and hygiene standards in the food industry, driving market growth and innovation in industrial food slicer solutions.
Market Driver: Automation and Labor Efficiency
A key driver propelling the market for industrial food slicers is the adoption of automation and labor efficiency solutions by food manufacturers to streamline production processes, reduce labor costs, and increase productivity. As companies seek to improve operational efficiency and throughput in food processing facilities, there is a growing demand for industrial food slicers that offer automated slicing, portioning, and stacking capabilities, minimizing manual intervention and maximizing throughput rates. This driver is further fueled by labor shortages, rising wages, and the need for consistent product quality and yield optimization, driving market growth and investment in advanced slicing equipment and automation technologies.
Market Opportunity: Integration of Smart and Hygienic Features
An opportunity exists for manufacturers of industrial food slicers to differentiate their products by integrating smart and hygienic features that enhance performance, safety, and ease of use in food processing operations. By incorporating technologies such as sensors, artificial intelligence, and Internet of Things (IoT) connectivity into industrial food slicers, manufacturers can offer solutions that monitor slicing parameters, detect anomalies, and provide real-time data insights to operators for proactive maintenance and quality control. Moreover, focusing on hygienic design principles such as easy-to-clean surfaces, antimicrobial coatings, and sanitation protocols can help address food safety concerns and regulatory compliance requirements, providing added value to customers in the food industry. This opportunity allows manufacturers to position their industrial food slicers as innovative, reliable, and hygienic solutions that meet the evolving needs of food processors for efficient and safe food slicing operations.
Industrial Food Slicers Market Share Analysis: Meat and Poultry held the dominant market share in 2024
In the Industrial Food Slicers Market, the segment focused on Meat and Poultry is the largest, propelled by the ubiquitous use of slicers in meat processing facilities and foodservice establishments. With the meat and poultry industry experiencing steady growth globally, industrial food slicers play a crucial role in streamlining production processes and ensuring consistent product quality. These slicers are tailored to meet the specific requirements of slicing various cuts of meat and poultry, including deli meats, bacon, sausage, and poultry breasts, with precision and efficiency. Further, the demand for pre-sliced and portioned meat and poultry products in supermarkets, delis, and restaurants further drives the adoption of industrial food slicers in this segment. Additionally, advancements in slicing technology, such as automated slicing systems and customizable slicing options, enhance productivity and yield, consolidating the dominance of the Meat and Poultry segment in the industrial food slicers market. As meat consumption continues to rise globally, industrial food slicers remain indispensable tools for meat processors and foodservice operators, shaping the landscape of the industry.
Industrial Food Slicers Market Segmentation
By Application
Fruits And Vegetables
Meat And Poultry
Potatoes
Others
Countries Analyzed
North America (US, Canada, Mexico)
Europe (Germany, UK, France, Spain, Italy, Russia, Rest of Europe)
Asia Pacific (China, India, Japan, South Korea, Australia, South East Asia, Rest of Asia)
South America (Brazil, Argentina, Rest of South America)
Middle East and Africa (Saudi Arabia, UAE, Rest of Middle East, South Africa, Egypt, Rest of Africa)
Industrial Food Slicers Companies Profiled in the Study
ABM FOOD EQUIPMENT
APS Industries
BIRO Manufacturing Co.
DADAUX SAS
Dutch TecSource B.V.
EMURA FOOD MACHINE Co. Ltd
FAM NV
FIBOSA
Food Technology Thielemann GmbH and Co. KG
GEA Group AG
GHD Georg Hartmann Maschinenbau GmbH
Grasselli Spa
Havantec Food Equipment BV
holac Maschinenbau GmbH
ITW Food Equipment Group
JBT FTNON BV
KRONEN GmbH
Marel TREIF GmbH
Urschel Laboratories Inc
Weber Maschinenbau GmbH
*- List Not Exhaustive
Chapter 1. TABLE OF CONTENTS
Chapter 2. Introduction to Industrial Food Slicers Market
2.1. Market Overview
2.2. Key Statistics and Report Highlights
2.3. Scope of the Comprehensive Study
2.3.1. Market Definition
2.3.2 Countries and Regions Covered
2.3.3 Research Objective
2.3.4 Units, Currency, and Conversions
2.3.5 Industry Value Chain
2.4. Key Market Segments
2.5. Key Companies
2.6. Study Period
Chapter 3. Strategic Analysis Review
3.1. Industrial Food Slicers Pricing Analysis and Forecast
3.2. Porter’s Five Forces
3.3. Market Ecosystem
3.4. SWOT Analysis
3.5. Regulatory Scenario
3.3. Effects of Inflation, Russia-Ukraine War, moderating economic growth, and other macroeconomic factors
Chapter 4. Competitive Landscape
4.1. Market Share Analysis
4.1.1. Global Industrial Food Slicers Market Share by Company, 2023
4.1.2. Product Offerings of Leading Industrial Food Slicers Companies
4.2. Market Entropy
4.2.1. New Product Launches in the Industry
4.2.2. Mergers, Acquisitions, Joint ventures, and Partnerships
4.3. Key Strategies and Best Practices
Chapter 5. Global Market Projections: Best, Reference, and Low Case Scenarios
5.1. Growth Analysis- Case Scenario Definitions
5.2. Low Growth Case Scenario Forecasts
5.3. Reference Growth Case Scenario Forecasts
5.4. High Growth Case Scenario Forecasts
Chapter 6. Market Dynamics
6.1. Industrial Food Slicers Market Drivers
6.2. Industrial Food Slicers Market Challenges
6.6. Industrial Food Slicers Market Opportunities
6.4. Industrial Food Slicers Market Trends
Chapter 7. Global Industrial Food Slicers Market Outlook Trends
7.1. Global Industrial Food Slicers Revenue (USD Million) and CAGR (%) by Type (2021-2032)
7.2. Global Industrial Food Slicers Revenue (USD Million) and CAGR (%) by Application (2021-2032)
7.3. Global Industrial Food Slicers Revenue (USD Million) and CAGR (%) by Product (2021-2032)
By Application
Fruits And Vegetables
Meat And Poultry
Potatoes
Others
Chapter 8. Global Industrial Food Slicers Regional Analysis and Outlook
8.1. Global Industrial Food Slicers Revenue (USD Million) By Regions (2021- 2032)
8.2. North America Industrial Food Slicers Revenue (USD Million) by Country (2021-2032)
8.2.1. United States Industrial Food Slicers Regional Analysis and Outlook
8.2.2. Canada Industrial Food Slicers Regional Analysis and Outlook
8.2.3. Mexico Industrial Food Slicers Regional Analysis and Outlook
8.3. Europe Industrial Food Slicers Revenue (USD Million), by Country (2021-2032)
8.3.1. Germany Industrial Food Slicers Regional Analysis and Outlook
8.3.2. France Industrial Food Slicers Regional Analysis and Outlook
8.3.3. United Kingdom Industrial Food Slicers Regional Analysis and Outlook
8.3.4. Spain Industrial Food Slicers Regional Analysis and Outlook
8.3.5. Italy Industrial Food Slicers Regional Analysis and Outlook
8.3.6. Russia Industrial Food Slicers Regional Analysis and Outlook
8.3.7. Rest of Europe Industrial Food Slicers Regional Analysis and Outlook
8.4. Asia Pacific Industrial Food Slicers Revenue (USD Million) by Country (2021-2032)
8.4.1. China Industrial Food Slicers Regional Analysis and Outlook
8.4.2. Japan Industrial Food Slicers Regional Analysis and Outlook
8.4.3. India Industrial Food Slicers Regional Analysis and Outlook
8.4.4. South Korea Industrial Food Slicers Regional Analysis and Outlook
8.4.5. Australia Industrial Food Slicers Regional Analysis and Outlook
8.4.6. South East Asia Industrial Food Slicers Regional Analysis and Outlook
8.4.7. Rest of Asia Pacific Industrial Food Slicers Regional Analysis and Outlook
8.5. South America Industrial Food Slicers Revenue (USD Million), by Country (2021-2032)
8.5.1. Brazil Industrial Food Slicers Regional Analysis and Outlook
8.5.2. Argentina Industrial Food Slicers Regional Analysis and Outlook
8.5.3. Rest of South America Industrial Food Slicers Regional Analysis and Outlook
8.6. Middle East and Africa Industrial Food Slicers Revenue (USD Million) by Country (2021-2032)
8.6.1. Middle East Industrial Food Slicers Regional Analysis and Outlook
8.6.2. Africa Industrial Food Slicers Regional Analysis and Outlook
Chapter 9. North America Industrial Food Slicers Analysis and Outlook
9.1. North America Industrial Food Slicers Revenue (USD Million) by Segments (2021-2032)
9.1.1. North America Industrial Food Slicers Revenue (USD Million) by Type (2021-2032)
9.1.2. North America Industrial Food Slicers Revenue (USD Million) by Application (2021-2032)
9.1.3. North America Industrial Food Slicers Revenue (USD Million) by Product (2021-2032)
By Application
Fruits And Vegetables
Meat And Poultry
Potatoes
Others
Chapter 10. Europe Industrial Food Slicers Analysis and Outlook
10.1. Europe Industrial Food Slicers Revenue (USD Million), by Segments (USD Million) (2021-2032)
10.1.1. Europe Industrial Food Slicers Revenue (USD Million) by Type (2021-2032)
10.1.2. Europe Industrial Food Slicers Revenue (USD Million) by Application (2021-2032)
10.1.3. Europe Industrial Food Slicers Revenue (USD Million) by Product (2021-2032)
By Application
Fruits And Vegetables
Meat And Poultry
Potatoes
Others
Chapter 11. Asia Pacific Industrial Food Slicers Analysis and Outlook
11.1. Asia Pacific Industrial Food Slicers Revenue (USD Million), and Revenue (USD Million) by Segments (2021-2032)
11.1.1. Asia Pacific Industrial Food Slicers Revenue (USD Million) by Type (2021-2032)
11.1.2. Asia Pacific Industrial Food Slicers Revenue (USD Million) by Application (2021-2032)
11.1.3. Asia Pacific Industrial Food Slicers Revenue (USD Million) by Product (2021-2032)
By Application
Fruits And Vegetables
Meat And Poultry
Potatoes
Others
Chapter 12. South America Industrial Food Slicers Analysis and Outlook
12.1. South America Industrial Food Slicers Revenue (USD Million), by Segments (2021-2032)
12.1.1. South America Industrial Food Slicers Revenue (USD Million) by Type (2021-2032)
12.1.2. South America Industrial Food Slicers Revenue (USD Million) by Application (2021-2032)
12.1.3. South America Industrial Food Slicers Revenue (USD Million) by Product (2021-2032)
By Application
Fruits And Vegetables
Meat And Poultry
Potatoes
Others
Chapter 13. Middle East and Africa Industrial Food Slicers Analysis and Outlook
13.1. Middle East and Africa Industrial Food Slicers Revenue (USD Million), by Segments (2021-2032)
13.1.1. Middle East and Africa Industrial Food Slicers Revenue (USD Million) by Type (2021-2032)
13.1.2. Middle East and Africa Industrial Food Slicers Revenue (USD Million) by Application (2021-2032)
13.1.3. Middle East and Africa Industrial Food Slicers Revenue (USD Million) by Product (2021-2032)
By Application
Fruits And Vegetables
Meat And Poultry
Potatoes
Others
Chapter 14. Industrial Food Slicers Company Profiles
14.1 Business Overview
14.2 Product Profiles
14.3 SWOT Profiles
14.5 Recent Developments
14.6 Financial Profile
List of Companies
ABM FOOD EQUIPMENT
APS Industries
BIRO Manufacturing Co.
DADAUX SAS
Dutch TecSource B.V.
EMURA FOOD MACHINE Co. Ltd
FAM NV
FIBOSA
Food Technology Thielemann GmbH and Co. KG
GEA Group AG
GHD Georg Hartmann Maschinenbau GmbH
Grasselli Spa
Havantec Food Equipment BV
holac Maschinenbau GmbH
ITW Food Equipment Group
JBT FTNON BV
KRONEN GmbH
Marel TREIF GmbH
Urschel Laboratories Inc
Weber Maschinenbau GmbH
15. Methodology and Data Sources
15.1 Customization Offerings
15.2 Subscription Services
15.3 Related Reports
15.4 Publisher Expertise
LIST OF TABLES
Table 1 Market Segmentation Analysis
Table 2 Global Industrial Food Slicers Market Share of Leading Companies, 2023
Table 3 Product Offerings of Leading Companies
Table 4 Low Growth Scenario Forecasts
Table 5 Reference Case Growth Scenario
Table 6 High Growth Case Scenario
Table 7 Global Industrial Food Slicers Revenue (USD Million) And CAGR (%) By Type (2021-2032)
Table 8 Global Industrial Food Slicers Revenue (USD Million) And CAGR (%) By Application (2021-2032)
Table 9 Global Industrial Food Slicers Revenue (USD Million) And CAGR (%) By Product (2021-2032)
Table 10 Global Industrial Food Slicers Market Revenue (USD Million) By Regions (2021-2032)
Table 11 Global Industrial Food Slicers Market Share (%) By Regions (2021-2032)
Table 12 North America Industrial Food Slicers Revenue (USD Million) By Country (2021-2032)
Table 13 Europe Industrial Food Slicers Revenue (USD Million) By Country (2021-2032)
Table 14 Asia Pacific Industrial Food Slicers Revenue (USD Million) By Country (2021-2032)
Table 15 South America Industrial Food Slicers Revenue (USD Million) By Country (2021-2032)
Table 16 Middle East and Africa Industrial Food Slicers Revenue (USD Million) By Region (2021-2032)
Table 17 North America Industrial Food Slicers Revenue (USD Million) By Type (2021-2032)
Table 18 North America Industrial Food Slicers Revenue (USD Million) By Application (2021-2032)
Table 19 North America Industrial Food Slicers Revenue (USD Million) By Product (2021-2032)
Table 20 Europe Industrial Food Slicers Revenue (USD Million) By Type (2021-2032)
Table 21 Europe Industrial Food Slicers Revenue (USD Million) By Application (2021-2032)
Table 22 Europe Industrial Food Slicers Revenue (USD Million) By Product (2021-2032)
Table 23 Asia Pacific Industrial Food Slicers Revenue (USD Million) By Type (2021-2032)
Table 24 Asia Pacific Industrial Food Slicers Revenue (USD Million) By Application (2021-2032)
Table 25 Asia Pacific Industrial Food Slicers Revenue (USD Million) By Product (2021-2032)
Table 26 South America Industrial Food Slicers Revenue (USD Million) By Type (2021-2032)
Table 27 South America Industrial Food Slicers Revenue (USD Million) By Application (2021-2032)
Table 28 South America Industrial Food Slicers Revenue (USD Million) By Product (2021-2032)
Table 29 Middle East and Africa Industrial Food Slicers Revenue (USD Million) By Type (2021-2032)
Table 30 Middle East and Africa Industrial Food Slicers Revenue (USD Million) By Application (2021-2032)
Table 31 Middle East and Africa Industrial Food Slicers Revenue (USD Million) By Product (2021-2032)
LIST OF FIGURES
Figure 1. Market Scope
Figure 2. Pricing Forecasts Per Unit, 2023- 2032
Figure 3. Porter’s Five Forces
Figure 4. Global Industrial Food Slicers Market Revenue (USD Million) By Regions (2021-2032)
Figure 5. Global Industrial Food Slicers Market Share (%) By Regions (2023)
Figure 6. North America Industrial Food Slicers Revenue (USD Million) By Country (2021-2032)
Figure 7. United States Industrial Food Slicers Revenue (USD Million) By Country (2021-2032)
Figure 8. Canada Industrial Food Slicers Revenue (USD Million) By Country (2021-2032)
Figure 9. Mexico Industrial Food Slicers Revenue (USD Million) By Country (2021-2032)
Figure 10. Europe Industrial Food Slicers Revenue (USD Million) By Country (2021-2032)
Figure 11. Germany Industrial Food Slicers Revenue (USD Million) By Country (2021-2032)
Figure 12. France Industrial Food Slicers Revenue (USD Million) By Country (2021-2032)
Figure 13. United Kingdom Industrial Food Slicers Revenue (USD Million) By Country (2021-2032)
Figure 14. Spain Industrial Food Slicers Revenue (USD Million) By Country (2021-2032)
Figure 15. Italy Industrial Food Slicers Revenue (USD Million) By Country (2021-2032)
Figure 16. Russia Industrial Food Slicers Revenue (USD Million) By Country (2021-2032)
Figure 17. Rest of Europe Industrial Food Slicers Revenue (USD Million) By Country (2021-2032)
Figure 11. Asia Pacific Industrial Food Slicers Revenue (USD Million) By Country (2021-2032)
Figure 12. China Industrial Food Slicers Revenue (USD Million) By Country (2021-2032)
Figure 13. Japan Industrial Food Slicers Revenue (USD Million) By Country (2021-2032)
Figure 14. India Industrial Food Slicers Revenue (USD Million) By Country (2021-2032)
Figure 15. South Korea Industrial Food Slicers Revenue (USD Million) By Country (2021-2032)
Figure 16. Australia Industrial Food Slicers Revenue (USD Million) By Country (2021-2032)
Figure 17. South East Asia Industrial Food Slicers Revenue (USD Million) By Country (2021-2032)
Figure 18. South America Industrial Food Slicers Revenue (USD Million) By Country (2021-2032)
Figure 19. Brazil Industrial Food Slicers Revenue (USD Million) By Country (2021-2032)
Figure 20. Argentina Industrial Food Slicers Revenue (USD Million) By Country (2021-2032)
Figure 21. Rest of Asia Pacific Industrial Food Slicers Revenue (USD Million) By Country (2021-2032)
Figure 22. Middle East and Africa Industrial Food Slicers Revenue (USD Million) By Region (2021-2032)
Figure 23. Saudi Arabia Industrial Food Slicers Revenue (USD Million) By Region (2021-2032)
Figure 24. The UAE Industrial Food Slicers Revenue (USD Million) By Region (2021-2032)
Figure 25. Rest of Middle East Industrial Food Slicers Revenue (USD Million) By Region (2021-2032)
Figure 26. South Africa Industrial Food Slicers Revenue (USD Million) By Region (2021-2032)
Figure 27. Africa Industrial Food Slicers Revenue (USD Million) By Region (2021-2032)
Figure 28. North America Industrial Food Slicers Revenue (USD Million) By Type (2021-2032)
Figure 29. North America Industrial Food Slicers Revenue (USD Million) By Application (2021-2032)
Figure 30. North America Industrial Food Slicers Revenue (USD Million) By Product (2021-2032)
Figure 31. Europe Industrial Food Slicers Revenue (USD Million) By Type (2021-2032)
Figure 32. Europe Industrial Food Slicers Revenue (USD Million) By Application (2021-2032)
Figure 33. Europe Industrial Food Slicers Revenue (USD Million) By Product (2021-2032)
Figure 34. Asia Pacific Industrial Food Slicers Revenue (USD Million) By Type (2021-2032)
Figure 35. Asia Pacific Industrial Food Slicers Revenue (USD Million) By Application (2021-2032)
Figure 36. Asia Pacific Industrial Food Slicers Revenue (USD Million) By Product (2021-2032)
Figure 37. South America Industrial Food Slicers Revenue (USD Million) By Type (2021-2032)
Figure 38. South America Industrial Food Slicers Revenue (USD Million) By Application (2021-2032)
Figure 39. South America Industrial Food Slicers Revenue (USD Million) By Product (2021-2032)
Figure 40. Middle East and Africa Industrial Food Slicers Revenue (USD Million) By Type (2021-2032)
Figure 41. Middle East and Africa Industrial Food Slicers Revenue (USD Million) By Application (2021-2032)
Figure 42. Middle East and Africa Industrial Food Slicers Revenue (USD Million) By Product (2021-2032)
By Application
Fruits And Vegetables
Meat And Poultry
Potatoes
Others
Countries Analyzed
North America (US, Canada, Mexico)
Europe (Germany, UK, France, Spain, Italy, Russia, Rest of Europe)
Asia Pacific (China, India, Japan, South Korea, Australia, South East Asia, Rest of Asia)
South America (Brazil, Argentina, Rest of South America)
Middle East and Africa (Saudi Arabia, UAE, Rest of Middle East, South Africa, Egypt, Rest of Africa)
