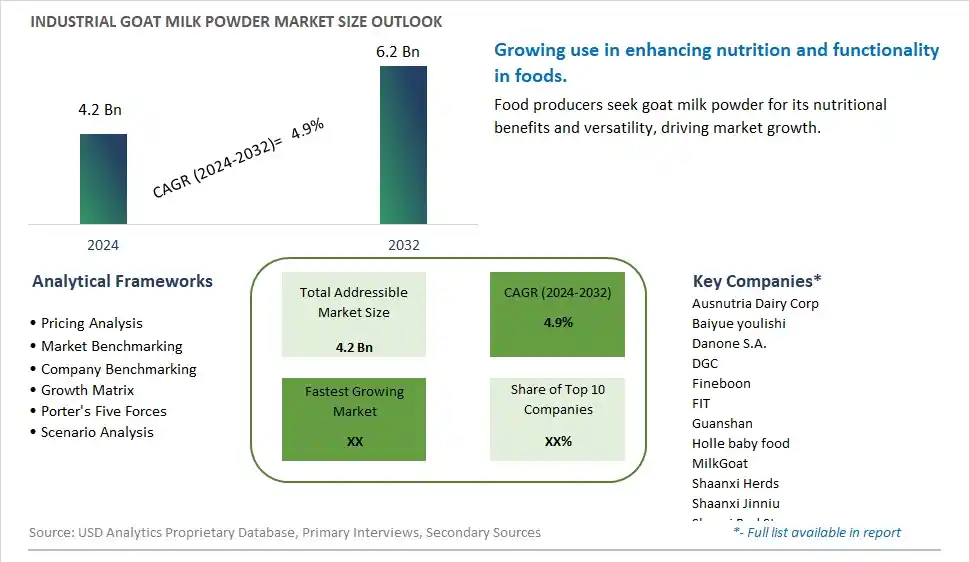
Global Industrial Goat Milk Powder Market Size is valued at $4.2 Billion in 2024 and is forecast to register a growth rate (CAGR) of 4.9% to reach $6.2 Billion by 2032.
The global Industrial Goat Milk Powder Market Comprehensive Study analyzes and forecasts the market size across 6 regions and 24 countries for diverse segments -By Type (First Class, Second Class, Third Class), By Application (Dairy Product, Milk Food, Others)
An Introduction to Industrial Goat Milk Powder Market
The industrial goat milk powder market in 2024 is expanding, fueled by the rising demand for alternative dairy products and their nutritional benefits. Goat milk powder is valued for its digestibility, nutritional profile, and hypoallergenic properties, making it a preferred ingredient in infant formula, dietary supplements, and specialized food products. The market is seeing advancements in processing technologies that improve the quality and shelf life of goat milk powder. Additionally, the growing trend towards natural and organic products is driving demand in both developed and emerging markets.
Industrial Goat Milk Powder Competitive Landscape
The market report analyses the leading companies in the industry including Ausnutria Dairy Corp, Baiyue youlishi, Danone S.A., DGC, Fineboon, FIT, Guanshan, Holle baby food, MilkGoat, Shaanxi Herds, Shaanxi Jinniu, Shanxi Red Star, ShengTangRuYe, Vitagermine, Yanglin Shengfei, YaTai-Precious, and Others.
Industrial Goat Milk Powder Market Dynamics
Industrial Goat Milk Powder Market Trend: Growing Demand for Nutritional and Specialty Dairy Products
The most prominent trend in the Industrial Goat Milk Powder Market is the growing demand for nutritional and specialty dairy products. Consumers are increasingly seeking dairy alternatives that offer unique nutritional benefits, such as higher digestibility and lower allergenicity compared to cow's milk. Goat milk powder is gaining popularity as a specialty dairy product that caters to health-conscious and lactose-intolerant consumers. This trend is driving the market as manufacturers develop goat milk-based products that meet the specific dietary needs and preferences of a diverse consumer base.
Industrial Goat Milk Powder Market Driver: Increasing Use in Infant Formula and Nutritional Supplements
A key driver for the Industrial Goat Milk Powder Market is the increasing use of goat milk powder in infant formula and nutritional supplements. Goat milk is considered a suitable alternative to cow's milk for infants with cow milk allergies or sensitivities. Its nutritional profile, which includes essential vitamins, minerals, and proteins, makes it an attractive ingredient in infant nutrition. Additionally, the demand for nutritional supplements that incorporate goat milk powder is rising as consumers seek natural and wholesome ingredients. This increasing use in infant formula and supplements is significantly driving the market for industrial goat milk powder.
Industrial Goat Milk Powder Market Opportunity: Expansion into Emerging Markets and Developing Regions
One potential opportunity in the Industrial Goat Milk Powder Market lies in the expansion into emerging markets and developing regions. As disposable incomes rise and consumer awareness of the health benefits of goat milk products increases, there is a growing demand for goat milk powder in regions such as Asia-Pacific, Latin America, and Africa. By focusing on these emerging markets, manufacturers can tap into a large and expanding consumer base that is increasingly prioritizing nutrition and wellness. This focus on geographic expansion can drive market growth and enhance the global reach of goat milk powder products.
Industrial Goat Milk Powder Market Share Analysis: First Class segment generated the highest revenue share in the industry
Among the types of Industrial Goat Milk Powder, the First Class segment is the largest. First Class goat milk powder represents products that meet the highest quality standards, often sourced from premium goat milk sources and processed using advanced manufacturing techniques. This segment commands a significant share of the market due to increasing consumer preference for high-quality dairy products and growing awareness of the nutritional benefits of goat milk over cow milk in certain demographics. Factors such as improved digestibility, higher protein content, and lower lactose levels compared to cow milk contribute to the popularity of First Class goat milk powder among health-conscious consumers globally.
Industrial Goat Milk Powder Market Share Analysis: Dairy Product is the fastest growing segment over the forecast period to 2032
The Dairy Product application segment is expected to be the fastest-growing in the Industrial Goat Milk Powder Market through 2032. This growth is driven by rising consumer demand for goat milk-based dairy products, including cheese, yogurt, and ice cream. Goat milk is increasingly recognized for its unique flavor profile and potential health benefits, such as easier digestibility for lactose-intolerant individuals and higher calcium absorption rates. Manufacturers are innovating with goat milk powder formulations to enhance product offerings and cater to diverse dietary preferences and nutritional needs. Regulatory support and expanding distribution channels further contribute to the segment's rapid growth in the global dairy market landscape.
Industrial Goat Milk Powder Market Segmentation
By Type
First Class
Second Class
Third Class
By Application
Dairy Product
Milk Food
Others
Countries Analyzed
North America (US, Canada, Mexico)
Europe (Germany, UK, France, Spain, Italy, Russia, Rest of Europe)
Asia Pacific (China, India, Japan, South Korea, Australia, South East Asia, Rest of Asia)
South America (Brazil, Argentina, Rest of South America)
Middle East and Africa (Saudi Arabia, UAE, Rest of Middle East, South Africa, Egypt, Rest of Africa)
Industrial Goat Milk Powder Companies Profiled in the Study
Ausnutria Dairy Corp
Baiyue youlishi
Danone S.A.
DGC
Fineboon
FIT
Guanshan
Holle baby food
MilkGoat
Shaanxi Herds
Shaanxi Jinniu
Shanxi Red Star
ShengTangRuYe
Vitagermine
Yanglin Shengfei
YaTai-Precious
*- List Not Exhaustive
Chapter 1. TABLE OF CONTENTS
Chapter 2. Introduction to Industrial Goat Milk Powder Market
2.1. Market Overview
2.2. Key Statistics and Report Highlights
2.3. Scope of the Comprehensive Study
2.3.1. Market Definition
2.3.2 Countries and Regions Covered
2.3.3 Research Objective
2.3.4 Units, Currency, and Conversions
2.3.5 Industry Value Chain
2.4. Key Market Segments
2.5. Key Companies
2.6. Study Period
Chapter 3. Strategic Analysis Review
3.1. Industrial Goat Milk Powder Pricing Analysis and Forecast
3.2. Porter’s Five Forces
3.3. Market Ecosystem
3.4. SWOT Analysis
3.5. Regulatory Scenario
3.3. Effects of Inflation, Russia-Ukraine War, moderating economic growth, and other macroeconomic factors
Chapter 4. Competitive Landscape
4.1. Market Share Analysis
4.1.1. Global Industrial Goat Milk Powder Market Share by Company, 2023
4.1.2. Product Offerings of Leading Industrial Goat Milk Powder Companies
4.2. Market Entropy
4.2.1. New Product Launches in the Industry
4.2.2. Mergers, Acquisitions, Joint ventures, and Partnerships
4.3. Key Strategies and Best Practices
Chapter 5. Global Market Projections: Best, Reference, and Low Case Scenarios
5.1. Growth Analysis- Case Scenario Definitions
5.2. Low Growth Case Scenario Forecasts
5.3. Reference Growth Case Scenario Forecasts
5.4. High Growth Case Scenario Forecasts
Chapter 6. Market Dynamics
6.1. Industrial Goat Milk Powder Market Drivers
6.2. Industrial Goat Milk Powder Market Challenges
6.6. Industrial Goat Milk Powder Market Opportunities
6.4. Industrial Goat Milk Powder Market Trends
Chapter 7. Global Industrial Goat Milk Powder Market Outlook Trends
7.1. Global Industrial Goat Milk Powder Revenue (USD Million) and CAGR (%) by Type (2021-2032)
7.2. Global Industrial Goat Milk Powder Revenue (USD Million) and CAGR (%) by Application (2021-2032)
7.3. Global Industrial Goat Milk Powder Revenue (USD Million) and CAGR (%) by Product (2021-2032)
By Type
First Class
Second Class
Third Class
By Application
Dairy Product
Milk Food
Others
Chapter 8. Global Industrial Goat Milk Powder Regional Analysis and Outlook
8.1. Global Industrial Goat Milk Powder Revenue (USD Million) By Regions (2021- 2032)
8.2. North America Industrial Goat Milk Powder Revenue (USD Million) by Country (2021-2032)
8.2.1. United States Industrial Goat Milk Powder Regional Analysis and Outlook
8.2.2. Canada Industrial Goat Milk Powder Regional Analysis and Outlook
8.2.3. Mexico Industrial Goat Milk Powder Regional Analysis and Outlook
8.3. Europe Industrial Goat Milk Powder Revenue (USD Million), by Country (2021-2032)
8.3.1. Germany Industrial Goat Milk Powder Regional Analysis and Outlook
8.3.2. France Industrial Goat Milk Powder Regional Analysis and Outlook
8.3.3. United Kingdom Industrial Goat Milk Powder Regional Analysis and Outlook
8.3.4. Spain Industrial Goat Milk Powder Regional Analysis and Outlook
8.3.5. Italy Industrial Goat Milk Powder Regional Analysis and Outlook
8.3.6. Russia Industrial Goat Milk Powder Regional Analysis and Outlook
8.3.7. Rest of Europe Industrial Goat Milk Powder Regional Analysis and Outlook
8.4. Asia Pacific Industrial Goat Milk Powder Revenue (USD Million) by Country (2021-2032)
8.4.1. China Industrial Goat Milk Powder Regional Analysis and Outlook
8.4.2. Japan Industrial Goat Milk Powder Regional Analysis and Outlook
8.4.3. India Industrial Goat Milk Powder Regional Analysis and Outlook
8.4.4. South Korea Industrial Goat Milk Powder Regional Analysis and Outlook
8.4.5. Australia Industrial Goat Milk Powder Regional Analysis and Outlook
8.4.6. South East Asia Industrial Goat Milk Powder Regional Analysis and Outlook
8.4.7. Rest of Asia Pacific Industrial Goat Milk Powder Regional Analysis and Outlook
8.5. South America Industrial Goat Milk Powder Revenue (USD Million), by Country (2021-2032)
8.5.1. Brazil Industrial Goat Milk Powder Regional Analysis and Outlook
8.5.2. Argentina Industrial Goat Milk Powder Regional Analysis and Outlook
8.5.3. Rest of South America Industrial Goat Milk Powder Regional Analysis and Outlook
8.6. Middle East and Africa Industrial Goat Milk Powder Revenue (USD Million) by Country (2021-2032)
8.6.1. Middle East Industrial Goat Milk Powder Regional Analysis and Outlook
8.6.2. Africa Industrial Goat Milk Powder Regional Analysis and Outlook
Chapter 9. North America Industrial Goat Milk Powder Analysis and Outlook
9.1. North America Industrial Goat Milk Powder Revenue (USD Million) by Segments (2021-2032)
9.1.1. North America Industrial Goat Milk Powder Revenue (USD Million) by Type (2021-2032)
9.1.2. North America Industrial Goat Milk Powder Revenue (USD Million) by Application (2021-2032)
9.1.3. North America Industrial Goat Milk Powder Revenue (USD Million) by Product (2021-2032)
By Type
First Class
Second Class
Third Class
By Application
Dairy Product
Milk Food
Others
Chapter 10. Europe Industrial Goat Milk Powder Analysis and Outlook
10.1. Europe Industrial Goat Milk Powder Revenue (USD Million), by Segments (USD Million) (2021-2032)
10.1.1. Europe Industrial Goat Milk Powder Revenue (USD Million) by Type (2021-2032)
10.1.2. Europe Industrial Goat Milk Powder Revenue (USD Million) by Application (2021-2032)
10.1.3. Europe Industrial Goat Milk Powder Revenue (USD Million) by Product (2021-2032)
By Type
First Class
Second Class
Third Class
By Application
Dairy Product
Milk Food
Others
Chapter 11. Asia Pacific Industrial Goat Milk Powder Analysis and Outlook
11.1. Asia Pacific Industrial Goat Milk Powder Revenue (USD Million), and Revenue (USD Million) by Segments (2021-2032)
11.1.1. Asia Pacific Industrial Goat Milk Powder Revenue (USD Million) by Type (2021-2032)
11.1.2. Asia Pacific Industrial Goat Milk Powder Revenue (USD Million) by Application (2021-2032)
11.1.3. Asia Pacific Industrial Goat Milk Powder Revenue (USD Million) by Product (2021-2032)
By Type
First Class
Second Class
Third Class
By Application
Dairy Product
Milk Food
Others
Chapter 12. South America Industrial Goat Milk Powder Analysis and Outlook
12.1. South America Industrial Goat Milk Powder Revenue (USD Million), by Segments (2021-2032)
12.1.1. South America Industrial Goat Milk Powder Revenue (USD Million) by Type (2021-2032)
12.1.2. South America Industrial Goat Milk Powder Revenue (USD Million) by Application (2021-2032)
12.1.3. South America Industrial Goat Milk Powder Revenue (USD Million) by Product (2021-2032)
By Type
First Class
Second Class
Third Class
By Application
Dairy Product
Milk Food
Others
Chapter 13. Middle East and Africa Industrial Goat Milk Powder Analysis and Outlook
13.1. Middle East and Africa Industrial Goat Milk Powder Revenue (USD Million), by Segments (2021-2032)
13.1.1. Middle East and Africa Industrial Goat Milk Powder Revenue (USD Million) by Type (2021-2032)
13.1.2. Middle East and Africa Industrial Goat Milk Powder Revenue (USD Million) by Application (2021-2032)
13.1.3. Middle East and Africa Industrial Goat Milk Powder Revenue (USD Million) by Product (2021-2032)
By Type
First Class
Second Class
Third Class
By Application
Dairy Product
Milk Food
Others
Chapter 14. Industrial Goat Milk Powder Company Profiles
14.1 Business Overview
14.2 Product Profiles
14.3 SWOT Profiles
14.5 Recent Developments
14.6 Financial Profile
List of Companies
Ausnutria Dairy Corp
Baiyue youlishi
Danone S.A.
DGC
Fineboon
FIT
Guanshan
Holle baby food
MilkGoat
Shaanxi Herds
Shaanxi Jinniu
Shanxi Red Star
ShengTangRuYe
Vitagermine
Yanglin Shengfei
YaTai-Precious
15. Methodology and Data Sources
15.1 Customization Offerings
15.2 Subscription Services
15.3 Related Reports
15.4 Publisher Expertise
LIST OF TABLES
Table 1 Market Segmentation Analysis
Table 2 Global Industrial Goat Milk Powder Market Share of Leading Companies, 2023
Table 3 Product Offerings of Leading Companies
Table 4 Low Growth Scenario Forecasts
Table 5 Reference Case Growth Scenario
Table 6 High Growth Case Scenario
Table 7 Global Industrial Goat Milk Powder Revenue (USD Million) And CAGR (%) By Type (2021-2032)
Table 8 Global Industrial Goat Milk Powder Revenue (USD Million) And CAGR (%) By Application (2021-2032)
Table 9 Global Industrial Goat Milk Powder Revenue (USD Million) And CAGR (%) By Product (2021-2032)
Table 10 Global Industrial Goat Milk Powder Market Revenue (USD Million) By Regions (2021-2032)
Table 11 Global Industrial Goat Milk Powder Market Share (%) By Regions (2021-2032)
Table 12 North America Industrial Goat Milk Powder Revenue (USD Million) By Country (2021-2032)
Table 13 Europe Industrial Goat Milk Powder Revenue (USD Million) By Country (2021-2032)
Table 14 Asia Pacific Industrial Goat Milk Powder Revenue (USD Million) By Country (2021-2032)
Table 15 South America Industrial Goat Milk Powder Revenue (USD Million) By Country (2021-2032)
Table 16 Middle East and Africa Industrial Goat Milk Powder Revenue (USD Million) By Region (2021-2032)
Table 17 North America Industrial Goat Milk Powder Revenue (USD Million) By Type (2021-2032)
Table 18 North America Industrial Goat Milk Powder Revenue (USD Million) By Application (2021-2032)
Table 19 North America Industrial Goat Milk Powder Revenue (USD Million) By Product (2021-2032)
Table 20 Europe Industrial Goat Milk Powder Revenue (USD Million) By Type (2021-2032)
Table 21 Europe Industrial Goat Milk Powder Revenue (USD Million) By Application (2021-2032)
Table 22 Europe Industrial Goat Milk Powder Revenue (USD Million) By Product (2021-2032)
Table 23 Asia Pacific Industrial Goat Milk Powder Revenue (USD Million) By Type (2021-2032)
Table 24 Asia Pacific Industrial Goat Milk Powder Revenue (USD Million) By Application (2021-2032)
Table 25 Asia Pacific Industrial Goat Milk Powder Revenue (USD Million) By Product (2021-2032)
Table 26 South America Industrial Goat Milk Powder Revenue (USD Million) By Type (2021-2032)
Table 27 South America Industrial Goat Milk Powder Revenue (USD Million) By Application (2021-2032)
Table 28 South America Industrial Goat Milk Powder Revenue (USD Million) By Product (2021-2032)
Table 29 Middle East and Africa Industrial Goat Milk Powder Revenue (USD Million) By Type (2021-2032)
Table 30 Middle East and Africa Industrial Goat Milk Powder Revenue (USD Million) By Application (2021-2032)
Table 31 Middle East and Africa Industrial Goat Milk Powder Revenue (USD Million) By Product (2021-2032)
LIST OF FIGURES
Figure 1. Market Scope
Figure 2. Pricing Forecasts Per Unit, 2023- 2032
Figure 3. Porter’s Five Forces
Figure 4. Global Industrial Goat Milk Powder Market Revenue (USD Million) By Regions (2021-2032)
Figure 5. Global Industrial Goat Milk Powder Market Share (%) By Regions (2023)
Figure 6. North America Industrial Goat Milk Powder Revenue (USD Million) By Country (2021-2032)
Figure 7. United States Industrial Goat Milk Powder Revenue (USD Million) By Country (2021-2032)
Figure 8. Canada Industrial Goat Milk Powder Revenue (USD Million) By Country (2021-2032)
Figure 9. Mexico Industrial Goat Milk Powder Revenue (USD Million) By Country (2021-2032)
Figure 10. Europe Industrial Goat Milk Powder Revenue (USD Million) By Country (2021-2032)
Figure 11. Germany Industrial Goat Milk Powder Revenue (USD Million) By Country (2021-2032)
Figure 12. France Industrial Goat Milk Powder Revenue (USD Million) By Country (2021-2032)
Figure 13. United Kingdom Industrial Goat Milk Powder Revenue (USD Million) By Country (2021-2032)
Figure 14. Spain Industrial Goat Milk Powder Revenue (USD Million) By Country (2021-2032)
Figure 15. Italy Industrial Goat Milk Powder Revenue (USD Million) By Country (2021-2032)
Figure 16. Russia Industrial Goat Milk Powder Revenue (USD Million) By Country (2021-2032)
Figure 17. Rest of Europe Industrial Goat Milk Powder Revenue (USD Million) By Country (2021-2032)
Figure 11. Asia Pacific Industrial Goat Milk Powder Revenue (USD Million) By Country (2021-2032)
Figure 12. China Industrial Goat Milk Powder Revenue (USD Million) By Country (2021-2032)
Figure 13. Japan Industrial Goat Milk Powder Revenue (USD Million) By Country (2021-2032)
Figure 14. India Industrial Goat Milk Powder Revenue (USD Million) By Country (2021-2032)
Figure 15. South Korea Industrial Goat Milk Powder Revenue (USD Million) By Country (2021-2032)
Figure 16. Australia Industrial Goat Milk Powder Revenue (USD Million) By Country (2021-2032)
Figure 17. South East Asia Industrial Goat Milk Powder Revenue (USD Million) By Country (2021-2032)
Figure 18. South America Industrial Goat Milk Powder Revenue (USD Million) By Country (2021-2032)
Figure 19. Brazil Industrial Goat Milk Powder Revenue (USD Million) By Country (2021-2032)
Figure 20. Argentina Industrial Goat Milk Powder Revenue (USD Million) By Country (2021-2032)
Figure 21. Rest of Asia Pacific Industrial Goat Milk Powder Revenue (USD Million) By Country (2021-2032)
Figure 22. Middle East and Africa Industrial Goat Milk Powder Revenue (USD Million) By Region (2021-2032)
Figure 23. Saudi Arabia Industrial Goat Milk Powder Revenue (USD Million) By Region (2021-2032)
Figure 24. The UAE Industrial Goat Milk Powder Revenue (USD Million) By Region (2021-2032)
Figure 25. Rest of Middle East Industrial Goat Milk Powder Revenue (USD Million) By Region (2021-2032)
Figure 26. South Africa Industrial Goat Milk Powder Revenue (USD Million) By Region (2021-2032)
Figure 27. Africa Industrial Goat Milk Powder Revenue (USD Million) By Region (2021-2032)
Figure 28. North America Industrial Goat Milk Powder Revenue (USD Million) By Type (2021-2032)
Figure 29. North America Industrial Goat Milk Powder Revenue (USD Million) By Application (2021-2032)
Figure 30. North America Industrial Goat Milk Powder Revenue (USD Million) By Product (2021-2032)
Figure 31. Europe Industrial Goat Milk Powder Revenue (USD Million) By Type (2021-2032)
Figure 32. Europe Industrial Goat Milk Powder Revenue (USD Million) By Application (2021-2032)
Figure 33. Europe Industrial Goat Milk Powder Revenue (USD Million) By Product (2021-2032)
Figure 34. Asia Pacific Industrial Goat Milk Powder Revenue (USD Million) By Type (2021-2032)
Figure 35. Asia Pacific Industrial Goat Milk Powder Revenue (USD Million) By Application (2021-2032)
Figure 36. Asia Pacific Industrial Goat Milk Powder Revenue (USD Million) By Product (2021-2032)
Figure 37. South America Industrial Goat Milk Powder Revenue (USD Million) By Type (2021-2032)
Figure 38. South America Industrial Goat Milk Powder Revenue (USD Million) By Application (2021-2032)
Figure 39. South America Industrial Goat Milk Powder Revenue (USD Million) By Product (2021-2032)
Figure 40. Middle East and Africa Industrial Goat Milk Powder Revenue (USD Million) By Type (2021-2032)
Figure 41. Middle East and Africa Industrial Goat Milk Powder Revenue (USD Million) By Application (2021-2032)
Figure 42. Middle East and Africa Industrial Goat Milk Powder Revenue (USD Million) By Product (2021-2032)
By Type
First Class
Second Class
Third Class
By Application
Dairy Product
Milk Food
Others
Countries Analyzed
North America (US, Canada, Mexico)
Europe (Germany, UK, France, Spain, Italy, Russia, Rest of Europe)
Asia Pacific (China, India, Japan, South Korea, Australia, South East Asia, Rest of Asia)
South America (Brazil, Argentina, Rest of South America)
Middle East and Africa (Saudi Arabia, UAE, Rest of Middle East, South Africa, Egypt, Rest of Africa)
