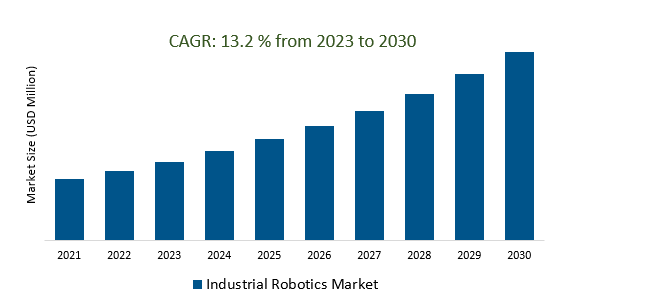
The Global Industrial Robotics Market Size is estimated to register 13.2 growth over the forecast period from 2023 to 2030.
The market growth is driven by an increasing growth of e-commerce is driving demand for robotics in fulfillment centers and logistics. Robots are used for tasks like order picking, packing, and inventory management to meet the increasing demand for rapid and accurate order processing. Leading Companies focusing on Expanded Application Areas, Collaborative Robotics (Cobots), AI and Machine Learning Integration, IoT Connectivity and Data Analytics, Sustainability, Green Robotics, and others to boost market shares in the industry.
Market Overview
The global industrial robotics market was characterized by significant growth driven by automation and Industry 4.0 principles. Key trends included the rise of collaborative robotics (cobots), integration of AI and machine learning, sensor and vision system enhancements, IoT connectivity, customization, sustainability, and cost reduction. Major players in the market included ABB, FANUC, KUKA, Yaskawa Electric, and Universal Robots. Challenges included high initial costs and the need for skilled technicians. The market's future outlook was positive, with expanding applications across industries and a focus on supply chain resilience, particularly in the wake of the COVID-19 pandemic.
Market Dynamics
Market Trends- Automation is driving the growth of the industrial robotics market by increasing the demand for robots to perform a wide range of tasks in manufacturing and other industries.
Automation is the driving force behind the rapid growth of the industrial robotics market, with rising demand for robots across manufacturing and various industries. These versatile machines are redefining the way businesses operate, enhancing productivity, quality control, and adaptability. They are key players in Industry 4.0, facilitating the integration of automation, data exchange, and smart manufacturing. Collaborative robots (cobots) are gaining popularity for safe human-robot interaction, expanding their use in multiple sectors. With advancements in AI and machine learning, robots are becoming smarter and more adaptable, capable of learning from their environment and performing complex tasks with precision, promising a future where they revolutionize industries and work processes.
Market Driver- The increasing demand for sensors and vision systems in industrial robots is driven by the need for more precise and efficient automation.
The increasing demand for sensors and vision systems in industrial robots is a response to the growing need for precision and efficiency in automation. These technologies, including advanced sensors and vision systems with machine learning, empower robots to perceive and adapt to their environment, navigate complex surroundings, and execute tasks with greater accuracy. This integration enhances the safety and reliability of automation while broadening the range of applications across various industries, from manufacturing to healthcare and agriculture.
Market Opportunity- The introduction of IoT connectivity in the industrial robotics market is enabling robots to communicate and collaborate with each other and with other devices in real-time, leading to more efficient and intelligent manufacturing processes.
IoT (Internet of Things) connectivity in the industrial robotics market marks a pivotal transformation, as it empowers robots to communicate and collaborate seamlessly with each other and with a broader network of devices in real time. This interconnected ecosystem has revolutionized manufacturing processes, enhancing efficiency and intelligence. Industrial robots equipped with IoT capabilities can share critical data and insights instantaneously, optimizing their performance and productivity. This real-time communication enables predictive maintenance, where robots can proactively address issues before they lead to downtime. Additionally, it fosters dynamic adaptability, as robots can adjust their actions based on real-time data, leading to more flexible and responsive manufacturing operations.
Market Share Analysis- Collaborative Robots Industrial Robotics Market will register the fastest growth
The Global Industrial Robotics Market is analyzed across Articulated Robots, Cartesian Robots, Parallel Robots, Cylindrical Robots, Collaborative Robots, and others. Collaborative Robots are poised to register the fastest growth. Collaborative robots, or cobots, represent a significant and growing segment in the industrial robotics market, known for their safe and cooperative human-robot interaction. Their versatility makes them valuable in industries like manufacturing, healthcare, and logistics, where they perform tasks alongside humans. The cobot market is driven by the need for flexible and safe automation, continually evolving with technological advancements and expanding applications.
Market Share Analysis- Software and Programming held a significant market share in 2023
The Global Industrial Robotics Market is analyzed across various Components including Robot Arms, Robot Accessories, Additional Robotic Hardware, System Engineering, Software and Programming, and others. Of these, Software and Programming held a significant market share in 2023. Software and programming are integral to the industrial robotics market, enabling precise control and functionality of robotic systems. These tools are pivotal in defining robotic actions, movements, and responses. The market emphasizes user-friendly programming interfaces to simplify robot setup and operation, and advanced software tools like simulation and offline programming are increasingly used for process design and optimization, enhancing efficiency and adaptability in various industries and applications.
Industrial Robotics Market Segmentation
By Type
- Articulated Robots
- Cartesian Robots
- Parallel Robots
- Cylindrical Robots
- Collaborative Robots
- Others
By Payload
- Up to 16.00 kg
- 16.01 to 60.00 kg
- 60.01 to 225.00 kg
- Above 225.00 kg
By Component
- Robot Arm
- Robot Accessories
- Additional Robotic Hardware
- System Engineering
- Software and Programming
By Application
- Handling
- Assembling & disassembling
- Welding & Soldering
- Cleanroom
- Dispensing
- Processing
- Others
By End-User
- Automotive
- Electrical and Electronics
- Metals and Heavy Machinery
- Chemical, Rubber, and Plastics
- Food
- Others
By Region
- North America (United States, Canada, Mexico)
- Europe (Germany, France, United Kingdom, Spain, Italy, Others)
- Asia Pacific (China, India, Japan, South Korea, Australia, Others)
- Latin America (Brazil, Argentina, Others)
- Middle East and Africa (Saudi Arabia, UAE, Kuwait, Other Middle East, South Africa, Nigeria, Other Africa)
Industrial Robotics Market Companies
- Mitsubishi Electric (Japan)
- Denso Corporation (Japan)
- Yaskawa Electric Corporation (Japan)
- FANUC Corp (Japan)
- ABB (Switzerland)
- KUKA AG (Germany)
- Kawasaki Heavy Industries (Japan)
- Nachi-Fujikoshi (Japan)
- Seiko Epson Corporation (Japan)
- Dürr AG (Germnay)
- Yamaha Motor Pvt Ltd (Japan)
- Estun Automation (China)
- Shibaura Machine Co. Ltd (Japan)
- Dover Corporation (US)
- Aurotek Corporation (Taiwan)
- Hirata Corporation (Japan)
- Rethink Robotics GmbH (Germany)
- Franka Emika (Germnay)
- Techman Robot Inc. (Taiwan)
- Bosch Rexroth AG (Germany)
- Universal Robots (Denmark)
- Omron Adept Technologies Inc. (US)
- RobotWorx (US)
- Comau (Italy)
- b+m Surface Systems (Germnay)
- ICR Services (US)
- Stäubli (Switzerland)
- Hyundai Robotics (South Korea)
- Siasun Robotics (China)
- IRS Robotics (Netherlands)
*List not exhaustive
Industrial Robotics Market Outlook 2023
1 Market Overview
1.1 Introduction to the Industrial Robotics Market
1.2 Scope of the Study
1.3 Research Objective
1.3.1 Key Market Scope and Segments
1.3.2 Players Covered
1.3.3 Years Considered
2 Executive Summary
2.1 2023 Industrial Robotics Industry- Market Statistics
3 Market Dynamics
3.1 Market Drivers
3.2 Market Challenges
3.3 Market Opportunities
3.4 Market Trends
4 Market Factor Analysis
4.1 Porter’s Five Forces
4.2 Market Entropy
4.2.1 Global Industrial Robotics Market Companies with Area Served
4.2.2 Products Offerings Global Industrial Robotics Market
5 COVID-19 Impact Analysis and Outlook Scenarios
5.1.1 Covid-19 Impact Analysis
5.1.2 post-COVID-19 Scenario- Low Growth Case
5.1.3 post-COVID-19 Scenario- Reference Growth Case
5.1.4 post-COVID-19 Scenario- Low Growth Case
6 Global Industrial Robotics Market Trends
6.1 Global Industrial Robotics Revenue (USD Million) and CAGR (%) by Type (2018-2030)
6.2 Global Industrial Robotics Revenue (USD Million) and CAGR (%) by Applications (2018-2030)
6.3 Global Industrial Robotics Revenue (USD Million) and CAGR (%) by regions (2018-2030)
7 Global Industrial Robotics Market Revenue (USD Million) by Type, and Applications (2018-2022)
7.1 Global Industrial Robotics Revenue (USD Million) by Type (2018-2022)
7.1.1 Global Industrial Robotics Revenue (USD Million), Market Share (%) by Type (2018-2022)
7.2 Global Industrial Robotics Revenue (USD Million) by Applications (2018-2022)
7.2.1 Global Industrial Robotics Revenue (USD Million), Market Share (%) by Applications (2018-2022)
8 Global Industrial Robotics Development Regional Status and Outlook
8.1 Global Industrial Robotics Revenue (USD Million) By Regions (2018-2022)
8.2 North America Industrial Robotics Revenue (USD Million) by Type, and Application (2018-2022)
8.2.1 North America Industrial Robotics Revenue (USD Million) by Country (2018-2022)
8.2.2 North America Industrial Robotics Revenue (USD Million) by Type (2018-2022)
8.2.3 North America Industrial Robotics Revenue (USD Million) by Applications (2018-2022)
8.3 Europe Industrial Robotics Revenue (USD Million), by Type, and Applications (USD Million) (2018-2022)
8.3.1 Europe Industrial Robotics Revenue (USD Million), by Country (2018-2022)
8.3.2 Europe Industrial Robotics Revenue (USD Million) by Type (2018-2022)
8.3.3 Europe Industrial Robotics Revenue (USD Million) by Applications (2018-2022)
8.4 Asia Pacific Industrial Robotics Revenue (USD Million), and Revenue (USD Million) by Type, and Applications (2018-2022)
8.4.1 Asia Pacific Industrial Robotics Revenue (USD Million) by Country (2018-2022)
8.4.2 Asia Pacific Industrial Robotics Revenue (USD Million) by Type (2018-2022)
8.4.3 Asia Pacific Industrial Robotics Revenue (USD Million) by Applications (2018-2022)
8.5 South America Industrial Robotics Revenue (USD Million), by Type, and Applications (2018-2022)
8.5.1 South America Industrial Robotics Revenue (USD Million), by Country (2018-2022)
8.5.2 South America Industrial Robotics Revenue (USD Million) by Type (2018-2022)
8.5.3 South America Industrial Robotics Revenue (USD Million) by Applications (2018-2022)
8.6 Middle East and Africa Industrial Robotics Revenue (USD Million), by Type, Technology, Application, Thickness (2018-2022)
8.6.1 Middle East and Africa Industrial Robotics Revenue (USD Million) by Country (2018-2022)
8.6.2 Middle East and Africa Industrial Robotics Revenue (USD Million) by Type (2018-2022)
8.6.3 Middle East and Africa Industrial Robotics Revenue (USD Million) by Applications (2018-2022)
9 Company Profiles
10 Global Industrial Robotics Market Revenue (USD Million), by Type, and Applications (2023-2030)
10.1 Global Industrial Robotics Revenue (USD Million) and Market Share (%) by Type (2023-2030)
10.1.1 Global Industrial Robotics Revenue (USD Million), and Market Share (%) by Type (2023-2030)
10.2 Global Industrial Robotics Revenue (USD Million) and Market Share (%) by Applications (2023-2030)
10.2.1 Global Industrial Robotics Revenue (USD Million), and Market Share (%) by Applications (2023-2030)
11 Global Industrial Robotics Development Regional Status and Outlook Forecast
11.1 Global Industrial Robotics Revenue (USD Million) By Regions (2023-2030)
11.2 North America Industrial Robotics Revenue (USD Million) by Type, and Applications (2023-2030)
11.2.1 North America Industrial Robotics Revenue (USD) Million by Country (2023-2030)
11.2.2 North America Industrial Robotics Revenue (USD Million), by Type (2023-2030)
11.2.3 North America Industrial Robotics Revenue (USD Million), Market Share (%) by Applications (2023-2030)
11.3 Europe Industrial Robotics Revenue (USD Million), by Type, and Applications (2023-2030)
11.3.1 Europe Industrial Robotics Revenue (USD Million), by Country (2023-2030)
11.3.2 Europe Industrial Robotics Revenue (USD Million), by Type (2023-2030)
11.3.3 Europe Industrial Robotics Revenue (USD Million), by Applications (2023-2030)
11.4 Asia Pacific Industrial Robotics Revenue (USD Million) by Type, and Applications (2023-2030)
11.4.1 Asia Pacific Industrial Robotics Revenue (USD Million), by Country (2023-2030)
11.4.2 Asia Pacific Industrial Robotics Revenue (USD Million), by Type (2023-2030)
11.4.3 Asia Pacific Industrial Robotics Revenue (USD Million), by Applications (2023-2030)
11.5 South America Industrial Robotics Revenue (USD Million), by Type, and Applications (2023-2030)
11.5.1 South America Industrial Robotics Revenue (USD Million), by Country (2023-2030)
11.5.2 South America Industrial Robotics Revenue (USD Million), by Type (2023-2030)
11.5.3 South America Industrial Robotics Revenue (USD Million), by Applications (2023-2030)
11.6 Middle East and Africa Industrial Robotics Revenue (USD Million), by Type, and Applications (2023-2030)
11.6.1 Middle East and Africa Industrial Robotics Revenue (USD Million), by region (2023-2030)
11.6.2 Middle East and Africa Industrial Robotics Revenue (USD Million), by Type (2023-2030)
11.6.3 Middle East and Africa Industrial Robotics Revenue (USD Million), by Applications (2023-2030)
12 Methodology and Data Sources
12.1 Methodology/Research Approach
12.1.1 Research Programs/Design
12.1.2 Market Size Estimation
12.1.3 Market Breakdown and Data Triangulation
12.2 Data Sources
12.2.1 Secondary Sources
12.2.2 Primary Sources
12.3 Disclaimer
List of Tables
Table 1 Market Segmentation Analysis
Table 2 Global Industrial Robotics Market Companies with Areas Served
Table 3 Products Offerings Global Industrial Robotics Market
Table 4 Low Growth Scenario Forecasts
Table 5 Reference Case Growth Scenario
Table 6 High Growth Case Scenario
Table 7 Global Industrial Robotics Revenue (USD Million) And CAGR (%) By Type (2018-2030)
Table 8 Global Industrial Robotics Revenue (USD Million) And CAGR (%) By Applications (2018-2030)
Table 9 Global Industrial Robotics Revenue (USD Million) And CAGR (%) By Regions (2018-2030)
Table 10 Global Industrial Robotics Revenue (USD Million) By Type (2018-2022)
Table 11 Global Industrial Robotics Revenue Market Share (%) By Type (2018-2022)
Table 12 Global Industrial Robotics Revenue (USD Million) By Applications (2018-2022)
Table 13 Global Industrial Robotics Revenue Market Share (%) By Applications (2018-2022)
Table 14 Global Industrial Robotics Market Revenue (USD Million) By Regions (2018-2022)
Table 15 Global Industrial Robotics Market Share (%) By Regions (2018-2022)
Table 16 North America Industrial Robotics Revenue (USD Million) By Country (2018-2022)
Table 17 North America Industrial Robotics Revenue (USD Million) By Type (2018-2022)
Table 18 North America Industrial Robotics Revenue (USD Million) By Applications (2018-2022)
Table 19 Europe Industrial Robotics Revenue (USD Million) By Country (2018-2022)
Table 20 Europe Industrial Robotics Revenue (USD Million) By Type (2018-2022)
Table 21 Europe Industrial Robotics Revenue (USD Million) By Applications (2018-2022)
Table 22 Asia Pacific Industrial Robotics Revenue (USD Million) By Country (2018-2022)
Table 23 Asia Pacific Industrial Robotics Revenue (USD Million) By Type (2018-2022)
Table 24 Asia Pacific Industrial Robotics Revenue (USD Million) By Applications (2018-2022)
Table 25 South America Industrial Robotics Revenue (USD Million) By Country (2018-2022)
Table 26 South America Industrial Robotics Revenue (USD Million) By Type (2018-2022)
Table 27 South America Industrial Robotics Revenue (USD Million) By Applications (2018-2022)
Table 28 Middle East and Africa Industrial Robotics Revenue (USD Million) By Region (2018-2022)
Table 29 Middle East and Africa Industrial Robotics Revenue (USD Million) By Type (2018-2022)
Table 30 Middle East and Africa Industrial Robotics Revenue (USD Million) By Applications (2018-2022)
Table 31 Financial Analysis
Table 32 Global Industrial Robotics Revenue (USD Million) By Type (2023-2030)
Table 33 Global Industrial Robotics Revenue Market Share (%) By Type (2023-2030)
Table 34 Global Industrial Robotics Revenue (USD Million) By Applications (2023-2030)
Table 35 Global Industrial Robotics Revenue Market Share (%) By Applications (2023-2030)
Table 36 Global Industrial Robotics Market Revenue (USD Million), And Revenue (USD Million) By Regions (2023-2030)
Table 37 North America Industrial Robotics Revenue (USD)By Country (2023-2030)
Table 38 North America Industrial Robotics Revenue (USD Million) By Type (2023-2030)
Table 39 North America Industrial Robotics Revenue (USD Million) By Applications (2023-2030)
Table 40 Europe Industrial Robotics Revenue (USD Million) By Country (2023-2030)
Table 41 Europe Industrial Robotics Revenue (USD Million) By Type (2023-2030)
Table 42 Europe Industrial Robotics Revenue (USD Million) By Applications (2023-2030)
Table 43 Asia Pacific Industrial Robotics Revenue (USD Million) By Country (2023-2030)
Table 44 Asia Pacific Industrial Robotics Revenue (USD Million) By Type (2023-2030)
Table 45 Asia Pacific Industrial Robotics Revenue (USD Million) By Applications (2023-2030)
Table 46 South America Industrial Robotics Revenue (USD Million) By Country (2023-2030)
Table 47 South America Industrial Robotics Revenue (USD Million) By Type (2023-2030)
Table 48 South America Industrial Robotics Revenue (USD Million) By Applications (2023-2030)
Table 49 Middle East and Africa Industrial Robotics Revenue (USD Million) By Region (2023-2030)
Table 50 Middle East and Africa Industrial Robotics Revenue (USD Million) By Region (2023-2030)
Table 51 Middle East and Africa Industrial Robotics Revenue (USD Million) By Type (2023-2030)
Table 52 Middle East and Africa Industrial Robotics Revenue (USD Million) By Applications (2023-2030)
Table 53 Research Programs/Design for This Report
Table 54 Key Data Information from Secondary Sources
Table 55 Key Data Information from Primary Sources
List of Figures
Figure 1 Market Scope
Figure 2 Porter’s Five Forces
Figure 3 Global Industrial Robotics Revenue (USD Million) By Type (2018-2022)
Figure 4 Global Industrial Robotics Revenue Market Share (%) By Type (2022)
Figure 5 Global Industrial Robotics Revenue (USD Million) By Applications (2018-2022)
Figure 6 Global Industrial Robotics Revenue Market Share (%) By Applications (2022)
Figure 7 Global Industrial Robotics Market Revenue (USD Million) By Regions (2018-2022)
Figure 8 Global Industrial Robotics Market Share (%) By Regions (2022)
Figure 9 North America Industrial Robotics Revenue (USD Million) By Country (2018-2022)
Figure 10 North America Industrial Robotics Revenue (USD Million) By Type (2018-2022)
Figure 11 North America Industrial Robotics Revenue (USD Million) By Applications (2018-2022)
Figure 12 Europe Industrial Robotics Revenue (USD Million) By Country (2018-2022)
Figure 13 Europe Industrial Robotics Revenue (USD Million) By Type (2018-2022)
Figure 14 Europe Industrial Robotics Revenue (USD Million) By Applications (2018-2022)
Figure 15 Asia Pacific Industrial Robotics Revenue (USD Million) By Country (2018-2022)
Figure 16 Asia Pacific Industrial Robotics Revenue (USD Million) By Type (2018-2022)
Figure 17 Asia Pacific Industrial Robotics Revenue (USD Million) By Applications (2018-2022)
Figure 18 South America Industrial Robotics Revenue (USD Million) By Country (2018-2022)
Figure 19 South America Industrial Robotics Revenue (USD Million) By Type (2018-2022)
Figure 20 South America Industrial Robotics Revenue (USD Million) By Applications (2018-2022)
Figure 21 Middle East and Africa Industrial Robotics Revenue (USD Million) By Region (2018-2022)
Figure 22 Middle East and Africa Industrial Robotics Revenue (USD Million) By Type (2018-2022)
Figure 23 Middle East and Africa Industrial Robotics Revenue (USD Million) By Applications (2018-2022)
Figure 24 Global Industrial Robotics Revenue (USD Million) By Type (2023-2030)
Figure 25 Global Industrial Robotics Revenue Market Share (%) By Type (2030)
Figure 26 Global Industrial Robotics Revenue (USD Million) By Applications (2023-2030)
Figure 27 Global Industrial Robotics Revenue Market Share (%) By Applications (2030)
Figure 28 Global Industrial Robotics Market Revenue (USD Million) By Regions (2023-2030)
Figure 29 North America Industrial Robotics Revenue (USD Million) By Country (2023-2030)
Figure 30 North America Industrial Robotics Revenue (USD Million) By Type (2023-2030)
Figure 31 North America Industrial Robotics Revenue (USD Million) By Applications (2023-2030)
Figure 32 Europe Industrial Robotics Revenue (USD Million) By Country (2023-2030)
Figure 33 Europe Industrial Robotics Revenue (USD Million) By Type (2023-2030)
Figure 34 Europe Industrial Robotics Revenue (USD Million) By Applications (2023-2030)
Figure 35 Asia Pacific Industrial Robotics Revenue (USD Million) By Country (2023-2030)
Figure 36 Asia Pacific Industrial Robotics Revenue (USD Million) By Type (2023-2030)
Figure 37 Asia Pacific Industrial Robotics Revenue (USD Million) By Applications (2023-2030)
Figure 38 South America Industrial Robotics Revenue (USD Million) By Country (2023-2030)
Figure 39 South America Industrial Robotics Revenue (USD Million) By Type (2023-2030)
Figure 40 South America Industrial Robotics Revenue (USD Million) By Applications (2023-2030)
Figure 41 Middle East and Africa Industrial Robotics Revenue (USD Million) By Region (2023-2030)
Figure 42 Middle East and Africa Industrial Robotics Revenue (USD Million) By Region (2023-2030)
Figure 43 Middle East and Africa Industrial Robotics Revenue (USD Million) By Type (2023-2030)
Figure 44 Middle East and Africa Industrial Robotics Revenue (USD Million) By Applications (2023-2030)
Figure 45 Bottom-Up and Top-Down Approaches for This Report
Figure 46 Data Triangulation
