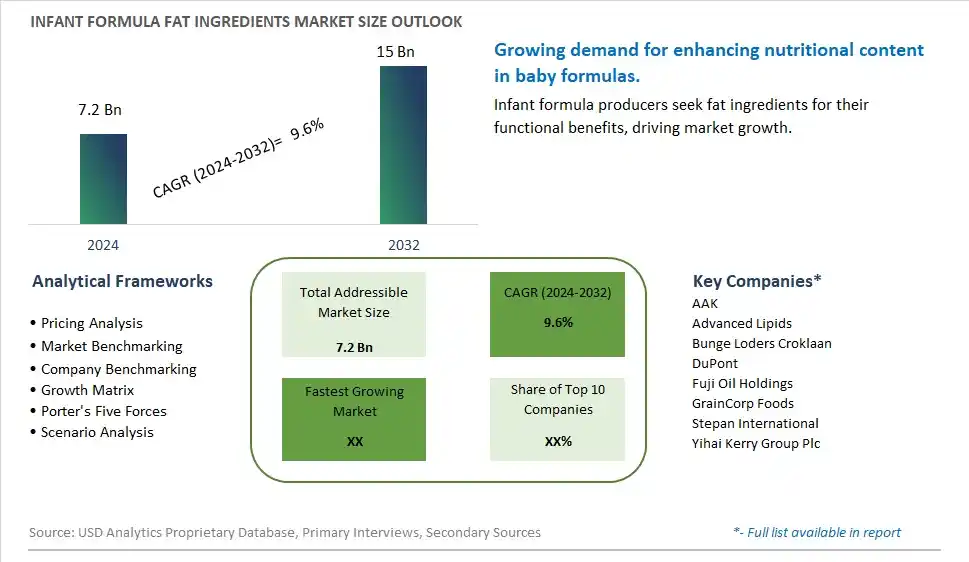
Global Infant Formula Fat Ingredients Market Size is valued at $7.2 Billion in 2024 and is forecast to register a growth rate (CAGR) of 9.6% to reach $15 Billion by 2032.
The global Infant Formula Fat Ingredients Market Comprehensive Study analyzes and forecasts the market size across 6 regions and 24 countries for diverse segments -By Type (Palm Oil, Soy Oil, Coconut Oil), By Application (0 to 6 Months, 6 to 12 Months, 12 to 24 Months), By Channel (Direct Sales, Distribution Channel)
An Introduction to Infant Formula Fat Ingredients Market
The infant formula fat ingredient market in 2024 is growing, driven by the need for high-quality, nutritionally balanced infant formulas. Fat ingredients, crucial for brain development and energy provision, are being optimized for better absorption and health benefits. The market is seeing innovations in ingredient formulations, including the use of structured lipids and omega-3 fatty acids. Regulatory standards and scientific advancements are ensuring the safety and efficacy of these fat ingredients, supporting the growth of the infant formula market.
Infant Formula Fat Ingredient Competitive Landscape
The market report analyses the leading companies in the industry including AAK, Advanced Lipids, Bunge Loders Croklaan, DuPont, Fuji Oil Holdings, GrainCorp Foods, Stepan International, Yihai Kerry Group Plc, and Others.
Infant Formula Fat Ingredient Market Dynamics
Infant Formula Fat Ingredient Market Trend: Shift Towards High-Quality and Functional Fat Ingredients
The most prominent trend in the Infant Formula Fat Ingredient Market is the shift towards high-quality and functional fat ingredients. As research on infant nutrition advances, there is a growing emphasis on the role of specific fat components in supporting infant health and development. Ingredients such as DHA, ARA, and MCTs are being increasingly incorporated into infant formulas to enhance brain development, immune function, and overall growth. This trend is driven by the desire to provide the best possible nutrition for infants, leading to the demand for premium and functional fat ingredients in infant formulas.
Infant Formula Fat Ingredient Market Driver: Rising Awareness of the Importance of Essential Fatty Acids
A key driver for the Infant Formula Fat Ingredient Market is the rising awareness of the importance of essential fatty acids in infant nutrition. Parents and healthcare providers are increasingly recognizing the critical role that fats play in supporting cognitive development, vision, and overall health in infants. The demand for infant formulas enriched with essential fatty acids such as DHA and ARA is growing as they are vital for the development of the brain and nervous system. This increasing awareness and focus on providing optimal nutrition for infants are significantly driving the market for high-quality fat ingredients in infant formulas.
Infant Formula Fat Ingredient Market Opportunity: Innovation in Plant-Based and Sustainable Fat Sources
One potential opportunity in the Infant Formula Fat Ingredient Market lies in innovation in plant-based and sustainable fat sources. As consumers become more environmentally conscious, there is a growing demand for infant formulas that use sustainably sourced and plant-based fat ingredients. By developing fat ingredients derived from sources such as algae, flaxseed, and other plant-based oils, manufacturers can cater to the demand for eco-friendly and sustainable nutrition solutions. This focus on sustainability and plant-based innovation can drive market growth and enhance the appeal of infant formulas to environmentally conscious parents.
Infant Formula Fat Ingredients Market Share Analysis- Largest Segment by Type
The Palm Oil segment is the largest in the Infant Formula Fat Ingredients Market by type. This dominance is driven by the widespread use of palm oil in infant formula due to its cost-effectiveness, availability, and nutritional properties that closely mimic the fat composition of human breast milk. Palm oil is rich in palmitic acid, which is essential for the growth and development of infants. The continuous innovation in palm oil formulations, including the development of sustainable and high-quality variants, enhances their appeal. Additionally, the growing trend of premium and specialty infant formulas supports the significant market share of the palm oil segment, as manufacturers seek to provide balanced nutrition for infants. The extensive availability of palm oil in the food industry and its inclusion in various infant formula brands further boosts its accessibility to a broad consumer base. The strong preference for palm oil as a key ingredient in infant formulas reinforces its dominant position in the market.
Infant Formula Fat Ingredients Market Share Analysis- Fastest Growing Segment by Application
The 6 to 12 Months segment is poised to grow the fastest in the Infant Formula Fat Ingredients Market by application over the next five years. This rapid growth is driven by the increasing nutritional needs of infants during this critical developmental period, where fat intake is crucial for brain development, energy provision, and overall growth. As infants transition to more solid foods, the demand for enriched formula that complements their diet increases. The continuous innovation in infant formula formulations, including the addition of specialized fat ingredients that mimic breast milk, supports the fast growth of this segment. Additionally, the growing awareness among parents about the importance of balanced nutrition during the 6 to 12 months age range further drives demand. The influence of pediatricians and healthcare professionals advocating for enhanced nutrition in this developmental stage also contributes to the rapid growth of the 6 to 12 months segment.
Infant Formula Fat Ingredients Market Share Analysis- Largest Segment by Channel
The Distribution Channel segment is the largest in the Infant Formula Fat Ingredients Market by channel. This dominance is driven by the extensive reach and efficiency of distribution networks that ensure the availability of infant formula fat ingredients to a broad range of manufacturers and retailers. Distribution channels, including wholesalers and specialized distributors, facilitate the timely and efficient supply of ingredients to infant formula producers, ensuring consistent product quality and availability. The continuous innovation in supply chain management and logistics, including improved storage and transportation solutions, enhances the appeal of distribution channels. Additionally, the growing trend of globalization in the infant formula market supports the significant market share of the distribution channel segment, as it enables manufacturers to source high-quality ingredients from various regions. The extensive network and established relationships between distributors and manufacturers reinforce the dominant position of the distribution channel segment in the market.
Infant Formula Fat Ingredient Market Segmentation
By Type
Palm Oil
Soy Oil
Coconut Oil
By Application
0 to 6 Months
6 to 12 Months
12 to 24 Months
By Channel
Direct Sales
Distribution Channel
Countries Analyzed
North America (US, Canada, Mexico)
Europe (Germany, UK, France, Spain, Italy, Russia, Rest of Europe)
Asia Pacific (China, India, Japan, South Korea, Australia, South East Asia, Rest of Asia)
South America (Brazil, Argentina, Rest of South America)
Middle East and Africa (Saudi Arabia, UAE, Rest of Middle East, South Africa, Egypt, Rest of Africa)
Infant Formula Fat Ingredient Companies Profiled in the Study
AAK
Advanced Lipids
Bunge Loders Croklaan
DuPont
Fuji Oil Holdings
GrainCorp Foods
Stepan International
Yihai Kerry Group Plc
*- List Not Exhaustive
Chapter 1. TABLE OF CONTENTS
Chapter 2. Introduction to Infant Formula Fat Ingredient Market
2.1. Market Overview
2.2. Key Statistics and Report Highlights
2.3. Scope of the Comprehensive Study
2.3.1. Market Definition
2.3.2 Countries and Regions Covered
2.3.3 Research Objective
2.3.4 Units, Currency, and Conversions
2.3.5 Industry Value Chain
2.4. Key Market Segments
2.5. Key Companies
2.6. Study Period
Chapter 3. Strategic Analysis Review
3.1. Infant Formula Fat Ingredient Pricing Analysis and Forecast
3.2. Porter’s Five Forces
3.3. Market Ecosystem
3.4. SWOT Analysis
3.5. Regulatory Scenario
3.3. Effects of Inflation, Russia-Ukraine War, moderating economic growth, and other macroeconomic factors
Chapter 4. Competitive Landscape
4.1. Market Share Analysis
4.1.1. Global Infant Formula Fat Ingredient Market Share by Company, 2023
4.1.2. Product Offerings of Leading Infant Formula Fat Ingredient Companies
4.2. Market Entropy
4.2.1. New Product Launches in the Industry
4.2.2. Mergers, Acquisitions, Joint ventures, and Partnerships
4.3. Key Strategies and Best Practices
Chapter 5. Global Market Projections: Best, Reference, and Low Case Scenarios
5.1. Growth Analysis- Case Scenario Definitions
5.2. Low Growth Case Scenario Forecasts
5.3. Reference Growth Case Scenario Forecasts
5.4. High Growth Case Scenario Forecasts
Chapter 6. Market Dynamics
6.1. Infant Formula Fat Ingredient Market Drivers
6.2. Infant Formula Fat Ingredient Market Challenges
6.6. Infant Formula Fat Ingredient Market Opportunities
6.4. Infant Formula Fat Ingredient Market Trends
Chapter 7. Global Infant Formula Fat Ingredient Market Outlook Trends
7.1. Global Infant Formula Fat Ingredient Revenue (USD Million) and CAGR (%) by Type (2021-2032)
7.2. Global Infant Formula Fat Ingredient Revenue (USD Million) and CAGR (%) by Application (2021-2032)
7.3. Global Infant Formula Fat Ingredient Revenue (USD Million) and CAGR (%) by Product (2021-2032)
By Type
Palm Oil
Soy Oil
Coconut Oil
By Application
0 to 6 Months
6 to 12 Months
12 to 24 Months
By Channel
Direct Sales
Distribution Channel
Chapter 8. Global Infant Formula Fat Ingredient Regional Analysis and Outlook
8.1. Global Infant Formula Fat Ingredient Revenue (USD Million) By Regions (2021- 2032)
8.2. North America Infant Formula Fat Ingredient Revenue (USD Million) by Country (2021-2032)
8.2.1. United States Infant Formula Fat Ingredient Regional Analysis and Outlook
8.2.2. Canada Infant Formula Fat Ingredient Regional Analysis and Outlook
8.2.3. Mexico Infant Formula Fat Ingredient Regional Analysis and Outlook
8.3. Europe Infant Formula Fat Ingredient Revenue (USD Million), by Country (2021-2032)
8.3.1. Germany Infant Formula Fat Ingredient Regional Analysis and Outlook
8.3.2. France Infant Formula Fat Ingredient Regional Analysis and Outlook
8.3.3. United Kingdom Infant Formula Fat Ingredient Regional Analysis and Outlook
8.3.4. Spain Infant Formula Fat Ingredient Regional Analysis and Outlook
8.3.5. Italy Infant Formula Fat Ingredient Regional Analysis and Outlook
8.3.6. Russia Infant Formula Fat Ingredient Regional Analysis and Outlook
8.3.7. Rest of Europe Infant Formula Fat Ingredient Regional Analysis and Outlook
8.4. Asia Pacific Infant Formula Fat Ingredient Revenue (USD Million) by Country (2021-2032)
8.4.1. China Infant Formula Fat Ingredient Regional Analysis and Outlook
8.4.2. Japan Infant Formula Fat Ingredient Regional Analysis and Outlook
8.4.3. India Infant Formula Fat Ingredient Regional Analysis and Outlook
8.4.4. South Korea Infant Formula Fat Ingredient Regional Analysis and Outlook
8.4.5. Australia Infant Formula Fat Ingredient Regional Analysis and Outlook
8.4.6. South East Asia Infant Formula Fat Ingredient Regional Analysis and Outlook
8.4.7. Rest of Asia Pacific Infant Formula Fat Ingredient Regional Analysis and Outlook
8.5. South America Infant Formula Fat Ingredient Revenue (USD Million), by Country (2021-2032)
8.5.1. Brazil Infant Formula Fat Ingredient Regional Analysis and Outlook
8.5.2. Argentina Infant Formula Fat Ingredient Regional Analysis and Outlook
8.5.3. Rest of South America Infant Formula Fat Ingredient Regional Analysis and Outlook
8.6. Middle East and Africa Infant Formula Fat Ingredient Revenue (USD Million) by Country (2021-2032)
8.6.1. Middle East Infant Formula Fat Ingredient Regional Analysis and Outlook
8.6.2. Africa Infant Formula Fat Ingredient Regional Analysis and Outlook
Chapter 9. North America Infant Formula Fat Ingredient Analysis and Outlook
9.1. North America Infant Formula Fat Ingredient Revenue (USD Million) by Segments (2021-2032)
9.1.1. North America Infant Formula Fat Ingredient Revenue (USD Million) by Type (2021-2032)
9.1.2. North America Infant Formula Fat Ingredient Revenue (USD Million) by Application (2021-2032)
9.1.3. North America Infant Formula Fat Ingredient Revenue (USD Million) by Product (2021-2032)
By Type
Palm Oil
Soy Oil
Coconut Oil
By Application
0 to 6 Months
6 to 12 Months
12 to 24 Months
By Channel
Direct Sales
Distribution Channel
Chapter 10. Europe Infant Formula Fat Ingredient Analysis and Outlook
10.1. Europe Infant Formula Fat Ingredient Revenue (USD Million), by Segments (USD Million) (2021-2032)
10.1.1. Europe Infant Formula Fat Ingredient Revenue (USD Million) by Type (2021-2032)
10.1.2. Europe Infant Formula Fat Ingredient Revenue (USD Million) by Application (2021-2032)
10.1.3. Europe Infant Formula Fat Ingredient Revenue (USD Million) by Product (2021-2032)
By Type
Palm Oil
Soy Oil
Coconut Oil
By Application
0 to 6 Months
6 to 12 Months
12 to 24 Months
By Channel
Direct Sales
Distribution Channel
Chapter 11. Asia Pacific Infant Formula Fat Ingredient Analysis and Outlook
11.1. Asia Pacific Infant Formula Fat Ingredient Revenue (USD Million), and Revenue (USD Million) by Segments (2021-2032)
11.1.1. Asia Pacific Infant Formula Fat Ingredient Revenue (USD Million) by Type (2021-2032)
11.1.2. Asia Pacific Infant Formula Fat Ingredient Revenue (USD Million) by Application (2021-2032)
11.1.3. Asia Pacific Infant Formula Fat Ingredient Revenue (USD Million) by Product (2021-2032)
By Type
Palm Oil
Soy Oil
Coconut Oil
By Application
0 to 6 Months
6 to 12 Months
12 to 24 Months
By Channel
Direct Sales
Distribution Channel
Chapter 12. South America Infant Formula Fat Ingredient Analysis and Outlook
12.1. South America Infant Formula Fat Ingredient Revenue (USD Million), by Segments (2021-2032)
12.1.1. South America Infant Formula Fat Ingredient Revenue (USD Million) by Type (2021-2032)
12.1.2. South America Infant Formula Fat Ingredient Revenue (USD Million) by Application (2021-2032)
12.1.3. South America Infant Formula Fat Ingredient Revenue (USD Million) by Product (2021-2032)
By Type
Palm Oil
Soy Oil
Coconut Oil
By Application
0 to 6 Months
6 to 12 Months
12 to 24 Months
By Channel
Direct Sales
Distribution Channel
Chapter 13. Middle East and Africa Infant Formula Fat Ingredient Analysis and Outlook
13.1. Middle East and Africa Infant Formula Fat Ingredient Revenue (USD Million), by Segments (2021-2032)
13.1.1. Middle East and Africa Infant Formula Fat Ingredient Revenue (USD Million) by Type (2021-2032)
13.1.2. Middle East and Africa Infant Formula Fat Ingredient Revenue (USD Million) by Application (2021-2032)
13.1.3. Middle East and Africa Infant Formula Fat Ingredient Revenue (USD Million) by Product (2021-2032)
By Type
Palm Oil
Soy Oil
Coconut Oil
By Application
0 to 6 Months
6 to 12 Months
12 to 24 Months
By Channel
Direct Sales
Distribution Channel
Chapter 14. Infant Formula Fat Ingredient Company Profiles
14.1 Business Overview
14.2 Product Profiles
14.3 SWOT Profiles
14.5 Recent Developments
14.6 Financial Profile
List of Companies
AAK
Advanced Lipids
Bunge Loders Croklaan
DuPont
Fuji Oil Holdings
GrainCorp Foods
Stepan International
Yihai Kerry Group Plc
15. Methodology and Data Sources
15.1 Customization Offerings
15.2 Subscription Services
15.3 Related Reports
15.4 Publisher Expertise
LIST OF TABLES
Table 1 Market Segmentation Analysis
Table 2 Global Infant Formula Fat Ingredient Market Share of Leading Companies, 2023
Table 3 Product Offerings of Leading Companies
Table 4 Low Growth Scenario Forecasts
Table 5 Reference Case Growth Scenario
Table 6 High Growth Case Scenario
Table 7 Global Infant Formula Fat Ingredient Revenue (USD Million) And CAGR (%) By Type (2021-2032)
Table 8 Global Infant Formula Fat Ingredient Revenue (USD Million) And CAGR (%) By Application (2021-2032)
Table 9 Global Infant Formula Fat Ingredient Revenue (USD Million) And CAGR (%) By Product (2021-2032)
Table 10 Global Infant Formula Fat Ingredient Market Revenue (USD Million) By Regions (2021-2032)
Table 11 Global Infant Formula Fat Ingredient Market Share (%) By Regions (2021-2032)
Table 12 North America Infant Formula Fat Ingredient Revenue (USD Million) By Country (2021-2032)
Table 13 Europe Infant Formula Fat Ingredient Revenue (USD Million) By Country (2021-2032)
Table 14 Asia Pacific Infant Formula Fat Ingredient Revenue (USD Million) By Country (2021-2032)
Table 15 South America Infant Formula Fat Ingredient Revenue (USD Million) By Country (2021-2032)
Table 16 Middle East and Africa Infant Formula Fat Ingredient Revenue (USD Million) By Region (2021-2032)
Table 17 North America Infant Formula Fat Ingredient Revenue (USD Million) By Type (2021-2032)
Table 18 North America Infant Formula Fat Ingredient Revenue (USD Million) By Application (2021-2032)
Table 19 North America Infant Formula Fat Ingredient Revenue (USD Million) By Product (2021-2032)
Table 20 Europe Infant Formula Fat Ingredient Revenue (USD Million) By Type (2021-2032)
Table 21 Europe Infant Formula Fat Ingredient Revenue (USD Million) By Application (2021-2032)
Table 22 Europe Infant Formula Fat Ingredient Revenue (USD Million) By Product (2021-2032)
Table 23 Asia Pacific Infant Formula Fat Ingredient Revenue (USD Million) By Type (2021-2032)
Table 24 Asia Pacific Infant Formula Fat Ingredient Revenue (USD Million) By Application (2021-2032)
Table 25 Asia Pacific Infant Formula Fat Ingredient Revenue (USD Million) By Product (2021-2032)
Table 26 South America Infant Formula Fat Ingredient Revenue (USD Million) By Type (2021-2032)
Table 27 South America Infant Formula Fat Ingredient Revenue (USD Million) By Application (2021-2032)
Table 28 South America Infant Formula Fat Ingredient Revenue (USD Million) By Product (2021-2032)
Table 29 Middle East and Africa Infant Formula Fat Ingredient Revenue (USD Million) By Type (2021-2032)
Table 30 Middle East and Africa Infant Formula Fat Ingredient Revenue (USD Million) By Application (2021-2032)
Table 31 Middle East and Africa Infant Formula Fat Ingredient Revenue (USD Million) By Product (2021-2032)
LIST OF FIGURES
Figure 1. Market Scope
Figure 2. Pricing Forecasts Per Unit, 2023- 2032
Figure 3. Porter’s Five Forces
Figure 4. Global Infant Formula Fat Ingredient Market Revenue (USD Million) By Regions (2021-2032)
Figure 5. Global Infant Formula Fat Ingredient Market Share (%) By Regions (2023)
Figure 6. North America Infant Formula Fat Ingredient Revenue (USD Million) By Country (2021-2032)
Figure 7. United States Infant Formula Fat Ingredient Revenue (USD Million) By Country (2021-2032)
Figure 8. Canada Infant Formula Fat Ingredient Revenue (USD Million) By Country (2021-2032)
Figure 9. Mexico Infant Formula Fat Ingredient Revenue (USD Million) By Country (2021-2032)
Figure 10. Europe Infant Formula Fat Ingredient Revenue (USD Million) By Country (2021-2032)
Figure 11. Germany Infant Formula Fat Ingredient Revenue (USD Million) By Country (2021-2032)
Figure 12. France Infant Formula Fat Ingredient Revenue (USD Million) By Country (2021-2032)
Figure 13. United Kingdom Infant Formula Fat Ingredient Revenue (USD Million) By Country (2021-2032)
Figure 14. Spain Infant Formula Fat Ingredient Revenue (USD Million) By Country (2021-2032)
Figure 15. Italy Infant Formula Fat Ingredient Revenue (USD Million) By Country (2021-2032)
Figure 16. Russia Infant Formula Fat Ingredient Revenue (USD Million) By Country (2021-2032)
Figure 17. Rest of Europe Infant Formula Fat Ingredient Revenue (USD Million) By Country (2021-2032)
Figure 11. Asia Pacific Infant Formula Fat Ingredient Revenue (USD Million) By Country (2021-2032)
Figure 12. China Infant Formula Fat Ingredient Revenue (USD Million) By Country (2021-2032)
Figure 13. Japan Infant Formula Fat Ingredient Revenue (USD Million) By Country (2021-2032)
Figure 14. India Infant Formula Fat Ingredient Revenue (USD Million) By Country (2021-2032)
Figure 15. South Korea Infant Formula Fat Ingredient Revenue (USD Million) By Country (2021-2032)
Figure 16. Australia Infant Formula Fat Ingredient Revenue (USD Million) By Country (2021-2032)
Figure 17. South East Asia Infant Formula Fat Ingredient Revenue (USD Million) By Country (2021-2032)
Figure 18. South America Infant Formula Fat Ingredient Revenue (USD Million) By Country (2021-2032)
Figure 19. Brazil Infant Formula Fat Ingredient Revenue (USD Million) By Country (2021-2032)
Figure 20. Argentina Infant Formula Fat Ingredient Revenue (USD Million) By Country (2021-2032)
Figure 21. Rest of Asia Pacific Infant Formula Fat Ingredient Revenue (USD Million) By Country (2021-2032)
Figure 22. Middle East and Africa Infant Formula Fat Ingredient Revenue (USD Million) By Region (2021-2032)
Figure 23. Saudi Arabia Infant Formula Fat Ingredient Revenue (USD Million) By Region (2021-2032)
Figure 24. The UAE Infant Formula Fat Ingredient Revenue (USD Million) By Region (2021-2032)
Figure 25. Rest of Middle East Infant Formula Fat Ingredient Revenue (USD Million) By Region (2021-2032)
Figure 26. South Africa Infant Formula Fat Ingredient Revenue (USD Million) By Region (2021-2032)
Figure 27. Africa Infant Formula Fat Ingredient Revenue (USD Million) By Region (2021-2032)
Figure 28. North America Infant Formula Fat Ingredient Revenue (USD Million) By Type (2021-2032)
Figure 29. North America Infant Formula Fat Ingredient Revenue (USD Million) By Application (2021-2032)
Figure 30. North America Infant Formula Fat Ingredient Revenue (USD Million) By Product (2021-2032)
Figure 31. Europe Infant Formula Fat Ingredient Revenue (USD Million) By Type (2021-2032)
Figure 32. Europe Infant Formula Fat Ingredient Revenue (USD Million) By Application (2021-2032)
Figure 33. Europe Infant Formula Fat Ingredient Revenue (USD Million) By Product (2021-2032)
Figure 34. Asia Pacific Infant Formula Fat Ingredient Revenue (USD Million) By Type (2021-2032)
Figure 35. Asia Pacific Infant Formula Fat Ingredient Revenue (USD Million) By Application (2021-2032)
Figure 36. Asia Pacific Infant Formula Fat Ingredient Revenue (USD Million) By Product (2021-2032)
Figure 37. South America Infant Formula Fat Ingredient Revenue (USD Million) By Type (2021-2032)
Figure 38. South America Infant Formula Fat Ingredient Revenue (USD Million) By Application (2021-2032)
Figure 39. South America Infant Formula Fat Ingredient Revenue (USD Million) By Product (2021-2032)
Figure 40. Middle East and Africa Infant Formula Fat Ingredient Revenue (USD Million) By Type (2021-2032)
Figure 41. Middle East and Africa Infant Formula Fat Ingredient Revenue (USD Million) By Application (2021-2032)
Figure 42. Middle East and Africa Infant Formula Fat Ingredient Revenue (USD Million) By Product (2021-2032)
By Type
Palm Oil
Soy Oil
Coconut Oil
By Application
0 to 6 Months
6 to 12 Months
12 to 24 Months
By Channel
Direct Sales
Distribution Channel
Countries Analyzed
North America (US, Canada, Mexico)
Europe (Germany, UK, France, Spain, Italy, Russia, Rest of Europe)
Asia Pacific (China, India, Japan, South Korea, Australia, South East Asia, Rest of Asia)
South America (Brazil, Argentina, Rest of South America)
Middle East and Africa (Saudi Arabia, UAE, Rest of Middle East, South Africa, Egypt, Rest of Africa)
