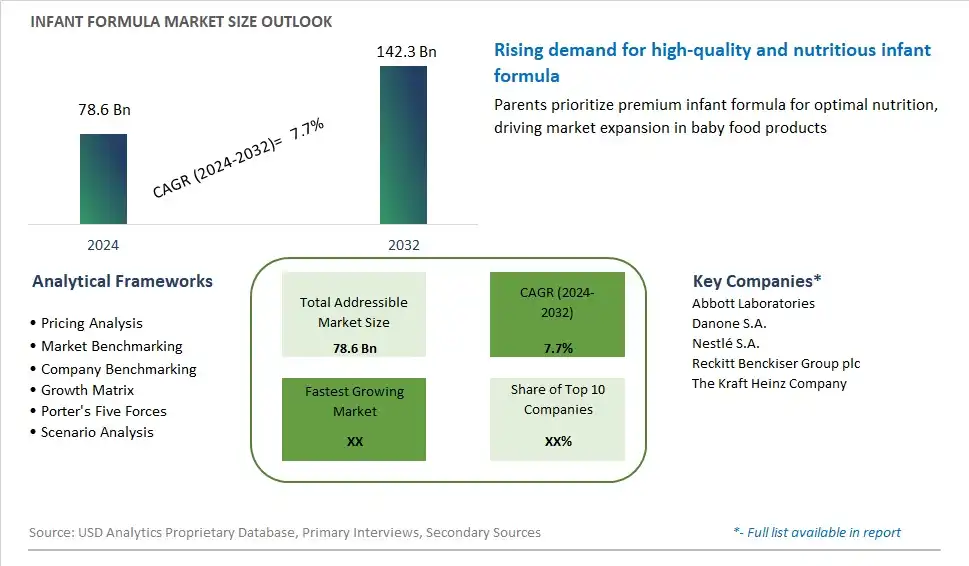
Global Infant Formula Market Size is valued at $78.6 Billion in 2024 and is forecast to register a growth rate (CAGR) of 7.7% to reach $142.3 Billion by 2032.
The global Infant Formula Market Comprehensive Study analyzes and forecasts the market size across 6 regions and 24 countries for diverse segments -By Product (Milk-based formula, Soy-based formula, Specialty formula), By Distribution Channel (Offline Retail, Online Retail), By Ingredient (Standard Formula, Organic Formula, GMO-Free Formula)
An Introduction to Infant Formula Market
In 2024, the infant formula market is experiencing robust growth, driven by the increasing demand for high-quality nutrition products for infants. Infant formula, designed to provide essential nutrients for growth and development, is a critical product for parents who cannot breastfeed or choose to supplement breastfeeding. The market benefits from the rising awareness of infant nutrition and the growing demand for specialized formulas, including organic, hypoallergenic, and fortified options. Innovations in formula formulations, including the incorporation of probiotics, prebiotics, and omega-3 fatty acids, have enhanced the nutritional profile and health benefits of infant formulas. Additionally, the trend towards clean-label and natural ingredients supports the adoption of premium infant formulas. As parents continue to prioritize the health and well-being of their infants, the demand for high-quality infant formula is set to grow robustly.
Infant Formula Competitive Landscape
The market report analyses the leading companies in the industry including Abbott Laboratories, Danone S.A., Nestlé S.A., Reckitt Benckiser Group plc, The Kraft Heinz Company, and Others.
Infant Formula Market Dynamics
Infant Formula Market Trend: Rising Demand for Organic and Clean Label Infant Formulas
A prominent trend in the infant formula market is the rising demand for organic and clean label infant formulas. As parents increasingly prioritize natural and organic ingredients for their infants, there's a growing preference for infant formulas that are free from artificial additives, preservatives, and genetically modified organisms (GMOs). This trend is driven by factors such as increasing awareness of health and wellness, concerns about the safety and purity of conventional infant formulas, and the desire for transparency and authenticity in infant feeding choices. Organic infant formulas, made from organic ingredients such as milk, soy, and plant-based oils, are becoming increasingly popular among parents seeking alternatives to conventional formulas. Additionally, clean label infant formulas, which feature simple and recognizable ingredients, are gaining traction as parents seek reassurance about the nutritional quality and safety of infant feeding products. As the demand for organic and clean label infant formulas continues to grow, driven by factors such as changing consumer preferences and lifestyle trends, the market is witnessing an increase in product innovation and development of natural and organic infant formula options.
Market Driver: Increasing Birth Rates and Working Mothers
An essential driver fueling the infant formula market is the increasing birth rates and the rising number of working mothers globally. With more women entering the workforce and pursuing careers, there's a growing demand for convenient and nutritionally balanced infant feeding solutions that complement busy lifestyles. This driver is reinforced by factors such as urbanization, changing family dynamics, and improvements in healthcare and nutrition leading to higher birth rates and infant survival rates. Working mothers often rely on infant formula as a convenient and reliable alternative to breastfeeding, providing essential nutrition for their infants while managing work and other responsibilities. Additionally, factors such as lactation challenges, returning to work, and lifestyle preferences contribute to the use of infant formula as a primary or supplementary feeding option for infants. As birth rates continue to rise globally and more women participate in the workforce, the demand for infant formula as a feeding solution for infants is expected to increase, driving market growth and innovation in infant formula formulations and packaging to meet the needs of modern families.
Market Opportunity: Development of Specialized and Functional Formulas
A significant opportunity within the infant formula market lies in the development of specialized and functional formulas tailored to specific infant health needs and dietary preferences. Beyond traditional infant formulas, there's potential to innovate and develop specialized formulas targeting infants with unique nutritional requirements or health conditions. This opportunity encompasses the development of hypoallergenic formulas for infants with food allergies or intolerances, lactose-free formulas for infants with lactose sensitivity, and specialty formulas for preterm infants or infants with specific medical conditions. Additionally, there's an opportunity to explore functional formulas enriched with vitamins, minerals, prebiotics, probiotics, and other bioactive compounds to support infant health and development. By offering specialized and functional formulas, infant formula manufacturers can address unmet needs in the market, cater to diverse infant health concerns, and provide parents with options that align with their infants' individual dietary requirements and preferences. As consumers seek out personalized and tailored nutrition solutions for their infants, the demand for specialized and functional infant formulas is expected to grow, driving market expansion and investment in research and development of innovative infant formula formulations and ingredients.
Infant Formula Market Share Analysis: Milk-based Formula held the dominant market share in 2024
The milk-based formula is the largest segment in the infant formula market due to its nutritional composition and widespread acceptance among infants worldwide. Milk-based formulas closely mimic the composition of breast milk, providing essential nutrients such as proteins, fats, carbohydrates, vitamins, and minerals necessary for healthy growth and development. This resemblance to breast milk makes milk-based formulas a preferred choice for infants who cannot be breastfed or when breastfeeding is insufficient. Additionally, milk-based formulas are generally well-tolerated by infants and are suitable for most babies unless they have specific dietary restrictions or allergies. The established reputation of milk-based formulas for nourishing infants coupled with ongoing research and development efforts to enhance their nutritional profile solidifies their position as the largest segment in the infant formula market.
Infant Formula Market Share Analysis: Online Retail market is poised to register the fastest growth rae over the forecast period to 2032
The online retail segment is the fastest-growing segment in the infant formula market, propelled by shifting consumer preferences, technological advancements, and the convenience offered by e-commerce platforms. With the increasing penetration of internet connectivity and smartphones, more parents are turning to online channels to purchase infant formula due to the convenience of doorstep delivery, extensive product variety, and competitive pricing. Further, online retailers often provide detailed product information, customer reviews, and subscription services, enhancing the shopping experience for parents and caregivers. Additionally, the ongoing COVID-19 pandemic has accelerated the adoption of online shopping for essential goods, including infant formula, as consumers prioritize safety and social distancing measures. As online retail continues to offer convenience, accessibility, and a personalized shopping experience, it is poised to sustain its rapid growth trajectory, reshaping the distribution landscape of the infant formula market.
Infant Formula Market Share Analysis: Standard Formula held the dominant market share in 2024
The standard formula is the largest segment in the infant formula market due to its wide availability, affordability, and established reputation for providing essential nutrition to infants. Standard formulas typically contain a balanced blend of proteins, carbohydrates, fats, vitamins, and minerals necessary for healthy growth and development. This segment caters to a broad consumer base, including parents who prioritize convenience and cost-effectiveness without specific dietary preferences or restrictions. Further, standard formulas often undergo rigorous quality control measures to ensure safety and compliance with regulatory standards, bolstering consumer trust. While organic and GMO-free formulas appeal to niche markets seeking natural and environmentally sustainable options, the broad appeal and accessibility of standard formulas solidify their dominance in the infant formula market.
Infant Formula Market Segmentation
By Product
Milk-based formula
Soy-based formula
Specialty formula
By Distribution Channel
Offline Retail
Online Retail
By Ingredient
Standard Formula
Organic Formula
GMO-Free Formula
Countries Analyzed
North America (US, Canada, Mexico)
Europe (Germany, UK, France, Spain, Italy, Russia, Rest of Europe)
Asia Pacific (China, India, Japan, South Korea, Australia, South East Asia, Rest of Asia)
South America (Brazil, Argentina, Rest of South America)
Middle East and Africa (Saudi Arabia, UAE, Rest of Middle East, South Africa, Egypt, Rest of Africa)
Infant Formula Companies Profiled in the Study
Abbott Laboratories
Danone S.A.
Nestlé S.A.
Reckitt Benckiser Group plc
The Kraft Heinz Company
*- List Not Exhaustive
Chapter 1. TABLE OF CONTENTS
Chapter 2. Introduction to Infant Formula Market
2.1. Market Overview
2.2. Key Statistics and Report Highlights
2.3. Scope of the Comprehensive Study
2.3.1. Market Definition
2.3.2 Countries and Regions Covered
2.3.3 Research Objective
2.3.4 Units, Currency, and Conversions
2.3.5 Industry Value Chain
2.4. Key Market Segments
2.5. Key Companies
2.6. Study Period
Chapter 3. Strategic Analysis Review
3.1. Infant Formula Pricing Analysis and Forecast
3.2. Porter’s Five Forces
3.3. Market Ecosystem
3.4. SWOT Analysis
3.5. Regulatory Scenario
3.3. Effects of Inflation, Russia-Ukraine War, moderating economic growth, and other macroeconomic factors
Chapter 4. Competitive Landscape
4.1. Market Share Analysis
4.1.1. Global Infant Formula Market Share by Company, 2023
4.1.2. Product Offerings of Leading Infant Formula Companies
4.2. Market Entropy
4.2.1. New Product Launches in the Industry
4.2.2. Mergers, Acquisitions, Joint ventures, and Partnerships
4.3. Key Strategies and Best Practices
Chapter 5. Global Market Projections: Best, Reference, and Low Case Scenarios
5.1. Growth Analysis- Case Scenario Definitions
5.2. Low Growth Case Scenario Forecasts
5.3. Reference Growth Case Scenario Forecasts
5.4. High Growth Case Scenario Forecasts
Chapter 6. Market Dynamics
6.1. Infant Formula Market Drivers
6.2. Infant Formula Market Challenges
6.6. Infant Formula Market Opportunities
6.4. Infant Formula Market Trends
Chapter 7. Global Infant Formula Market Outlook Trends
7.1. Global Infant Formula Revenue (USD Million) and CAGR (%) by Type (2021-2032)
7.2. Global Infant Formula Revenue (USD Million) and CAGR (%) by Application (2021-2032)
7.3. Global Infant Formula Revenue (USD Million) and CAGR (%) by Product (2021-2032)
By Product
Milk-based formula
Soy-based formula
Specialty formula
By Distribution Channel
Offline Retail
Online Retail
By Ingredient
Standard Formula
Organic Formula
GMO-Free Formula
Chapter 8. Global Infant Formula Regional Analysis and Outlook
8.1. Global Infant Formula Revenue (USD Million) By Regions (2021- 2032)
8.2. North America Infant Formula Revenue (USD Million) by Country (2021-2032)
8.2.1. United States Infant Formula Regional Analysis and Outlook
8.2.2. Canada Infant Formula Regional Analysis and Outlook
8.2.3. Mexico Infant Formula Regional Analysis and Outlook
8.3. Europe Infant Formula Revenue (USD Million), by Country (2021-2032)
8.3.1. Germany Infant Formula Regional Analysis and Outlook
8.3.2. France Infant Formula Regional Analysis and Outlook
8.3.3. United Kingdom Infant Formula Regional Analysis and Outlook
8.3.4. Spain Infant Formula Regional Analysis and Outlook
8.3.5. Italy Infant Formula Regional Analysis and Outlook
8.3.6. Russia Infant Formula Regional Analysis and Outlook
8.3.7. Rest of Europe Infant Formula Regional Analysis and Outlook
8.4. Asia Pacific Infant Formula Revenue (USD Million) by Country (2021-2032)
8.4.1. China Infant Formula Regional Analysis and Outlook
8.4.2. Japan Infant Formula Regional Analysis and Outlook
8.4.3. India Infant Formula Regional Analysis and Outlook
8.4.4. South Korea Infant Formula Regional Analysis and Outlook
8.4.5. Australia Infant Formula Regional Analysis and Outlook
8.4.6. South East Asia Infant Formula Regional Analysis and Outlook
8.4.7. Rest of Asia Pacific Infant Formula Regional Analysis and Outlook
8.5. South America Infant Formula Revenue (USD Million), by Country (2021-2032)
8.5.1. Brazil Infant Formula Regional Analysis and Outlook
8.5.2. Argentina Infant Formula Regional Analysis and Outlook
8.5.3. Rest of South America Infant Formula Regional Analysis and Outlook
8.6. Middle East and Africa Infant Formula Revenue (USD Million) by Country (2021-2032)
8.6.1. Middle East Infant Formula Regional Analysis and Outlook
8.6.2. Africa Infant Formula Regional Analysis and Outlook
Chapter 9. North America Infant Formula Analysis and Outlook
9.1. North America Infant Formula Revenue (USD Million) by Segments (2021-2032)
9.1.1. North America Infant Formula Revenue (USD Million) by Type (2021-2032)
9.1.2. North America Infant Formula Revenue (USD Million) by Application (2021-2032)
9.1.3. North America Infant Formula Revenue (USD Million) by Product (2021-2032)
By Product
Milk-based formula
Soy-based formula
Specialty formula
By Distribution Channel
Offline Retail
Online Retail
By Ingredient
Standard Formula
Organic Formula
GMO-Free Formula
Chapter 10. Europe Infant Formula Analysis and Outlook
10.1. Europe Infant Formula Revenue (USD Million), by Segments (USD Million) (2021-2032)
10.1.1. Europe Infant Formula Revenue (USD Million) by Type (2021-2032)
10.1.2. Europe Infant Formula Revenue (USD Million) by Application (2021-2032)
10.1.3. Europe Infant Formula Revenue (USD Million) by Product (2021-2032)
By Product
Milk-based formula
Soy-based formula
Specialty formula
By Distribution Channel
Offline Retail
Online Retail
By Ingredient
Standard Formula
Organic Formula
GMO-Free Formula
Chapter 11. Asia Pacific Infant Formula Analysis and Outlook
11.1. Asia Pacific Infant Formula Revenue (USD Million), and Revenue (USD Million) by Segments (2021-2032)
11.1.1. Asia Pacific Infant Formula Revenue (USD Million) by Type (2021-2032)
11.1.2. Asia Pacific Infant Formula Revenue (USD Million) by Application (2021-2032)
11.1.3. Asia Pacific Infant Formula Revenue (USD Million) by Product (2021-2032)
By Product
Milk-based formula
Soy-based formula
Specialty formula
By Distribution Channel
Offline Retail
Online Retail
By Ingredient
Standard Formula
Organic Formula
GMO-Free Formula
Chapter 12. South America Infant Formula Analysis and Outlook
12.1. South America Infant Formula Revenue (USD Million), by Segments (2021-2032)
12.1.1. South America Infant Formula Revenue (USD Million) by Type (2021-2032)
12.1.2. South America Infant Formula Revenue (USD Million) by Application (2021-2032)
12.1.3. South America Infant Formula Revenue (USD Million) by Product (2021-2032)
By Product
Milk-based formula
Soy-based formula
Specialty formula
By Distribution Channel
Offline Retail
Online Retail
By Ingredient
Standard Formula
Organic Formula
GMO-Free Formula
Chapter 13. Middle East and Africa Infant Formula Analysis and Outlook
13.1. Middle East and Africa Infant Formula Revenue (USD Million), by Segments (2021-2032)
13.1.1. Middle East and Africa Infant Formula Revenue (USD Million) by Type (2021-2032)
13.1.2. Middle East and Africa Infant Formula Revenue (USD Million) by Application (2021-2032)
13.1.3. Middle East and Africa Infant Formula Revenue (USD Million) by Product (2021-2032)
By Product
Milk-based formula
Soy-based formula
Specialty formula
By Distribution Channel
Offline Retail
Online Retail
By Ingredient
Standard Formula
Organic Formula
GMO-Free Formula
Chapter 14. Infant Formula Company Profiles
14.1 Business Overview
14.2 Product Profiles
14.3 SWOT Profiles
14.5 Recent Developments
14.6 Financial Profile
List of Companies
Abbott Laboratories
Danone S.A.
Nestlé S.A.
Reckitt Benckiser Group plc
The Kraft Heinz Company
15. Methodology and Data Sources
15.1 Customization Offerings
15.2 Subscription Services
15.3 Related Reports
15.4 Publisher Expertise
LIST OF TABLES
Table 1 Market Segmentation Analysis
Table 2 Global Infant Formula Market Share of Leading Companies, 2023
Table 3 Product Offerings of Leading Companies
Table 4 Low Growth Scenario Forecasts
Table 5 Reference Case Growth Scenario
Table 6 High Growth Case Scenario
Table 7 Global Infant Formula Revenue (USD Million) And CAGR (%) By Type (2021-2032)
Table 8 Global Infant Formula Revenue (USD Million) And CAGR (%) By Application (2021-2032)
Table 9 Global Infant Formula Revenue (USD Million) And CAGR (%) By Product (2021-2032)
Table 10 Global Infant Formula Market Revenue (USD Million) By Regions (2021-2032)
Table 11 Global Infant Formula Market Share (%) By Regions (2021-2032)
Table 12 North America Infant Formula Revenue (USD Million) By Country (2021-2032)
Table 13 Europe Infant Formula Revenue (USD Million) By Country (2021-2032)
Table 14 Asia Pacific Infant Formula Revenue (USD Million) By Country (2021-2032)
Table 15 South America Infant Formula Revenue (USD Million) By Country (2021-2032)
Table 16 Middle East and Africa Infant Formula Revenue (USD Million) By Region (2021-2032)
Table 17 North America Infant Formula Revenue (USD Million) By Type (2021-2032)
Table 18 North America Infant Formula Revenue (USD Million) By Application (2021-2032)
Table 19 North America Infant Formula Revenue (USD Million) By Product (2021-2032)
Table 20 Europe Infant Formula Revenue (USD Million) By Type (2021-2032)
Table 21 Europe Infant Formula Revenue (USD Million) By Application (2021-2032)
Table 22 Europe Infant Formula Revenue (USD Million) By Product (2021-2032)
Table 23 Asia Pacific Infant Formula Revenue (USD Million) By Type (2021-2032)
Table 24 Asia Pacific Infant Formula Revenue (USD Million) By Application (2021-2032)
Table 25 Asia Pacific Infant Formula Revenue (USD Million) By Product (2021-2032)
Table 26 South America Infant Formula Revenue (USD Million) By Type (2021-2032)
Table 27 South America Infant Formula Revenue (USD Million) By Application (2021-2032)
Table 28 South America Infant Formula Revenue (USD Million) By Product (2021-2032)
Table 29 Middle East and Africa Infant Formula Revenue (USD Million) By Type (2021-2032)
Table 30 Middle East and Africa Infant Formula Revenue (USD Million) By Application (2021-2032)
Table 31 Middle East and Africa Infant Formula Revenue (USD Million) By Product (2021-2032)
LIST OF FIGURES
Figure 1. Market Scope
Figure 2. Pricing Forecasts Per Unit, 2023- 2032
Figure 3. Porter’s Five Forces
Figure 4. Global Infant Formula Market Revenue (USD Million) By Regions (2021-2032)
Figure 5. Global Infant Formula Market Share (%) By Regions (2023)
Figure 6. North America Infant Formula Revenue (USD Million) By Country (2021-2032)
Figure 7. United States Infant Formula Revenue (USD Million) By Country (2021-2032)
Figure 8. Canada Infant Formula Revenue (USD Million) By Country (2021-2032)
Figure 9. Mexico Infant Formula Revenue (USD Million) By Country (2021-2032)
Figure 10. Europe Infant Formula Revenue (USD Million) By Country (2021-2032)
Figure 11. Germany Infant Formula Revenue (USD Million) By Country (2021-2032)
Figure 12. France Infant Formula Revenue (USD Million) By Country (2021-2032)
Figure 13. United Kingdom Infant Formula Revenue (USD Million) By Country (2021-2032)
Figure 14. Spain Infant Formula Revenue (USD Million) By Country (2021-2032)
Figure 15. Italy Infant Formula Revenue (USD Million) By Country (2021-2032)
Figure 16. Russia Infant Formula Revenue (USD Million) By Country (2021-2032)
Figure 17. Rest of Europe Infant Formula Revenue (USD Million) By Country (2021-2032)
Figure 11. Asia Pacific Infant Formula Revenue (USD Million) By Country (2021-2032)
Figure 12. China Infant Formula Revenue (USD Million) By Country (2021-2032)
Figure 13. Japan Infant Formula Revenue (USD Million) By Country (2021-2032)
Figure 14. India Infant Formula Revenue (USD Million) By Country (2021-2032)
Figure 15. South Korea Infant Formula Revenue (USD Million) By Country (2021-2032)
Figure 16. Australia Infant Formula Revenue (USD Million) By Country (2021-2032)
Figure 17. South East Asia Infant Formula Revenue (USD Million) By Country (2021-2032)
Figure 18. South America Infant Formula Revenue (USD Million) By Country (2021-2032)
Figure 19. Brazil Infant Formula Revenue (USD Million) By Country (2021-2032)
Figure 20. Argentina Infant Formula Revenue (USD Million) By Country (2021-2032)
Figure 21. Rest of Asia Pacific Infant Formula Revenue (USD Million) By Country (2021-2032)
Figure 22. Middle East and Africa Infant Formula Revenue (USD Million) By Region (2021-2032)
Figure 23. Saudi Arabia Infant Formula Revenue (USD Million) By Region (2021-2032)
Figure 24. The UAE Infant Formula Revenue (USD Million) By Region (2021-2032)
Figure 25. Rest of Middle East Infant Formula Revenue (USD Million) By Region (2021-2032)
Figure 26. South Africa Infant Formula Revenue (USD Million) By Region (2021-2032)
Figure 27. Africa Infant Formula Revenue (USD Million) By Region (2021-2032)
Figure 28. North America Infant Formula Revenue (USD Million) By Type (2021-2032)
Figure 29. North America Infant Formula Revenue (USD Million) By Application (2021-2032)
Figure 30. North America Infant Formula Revenue (USD Million) By Product (2021-2032)
Figure 31. Europe Infant Formula Revenue (USD Million) By Type (2021-2032)
Figure 32. Europe Infant Formula Revenue (USD Million) By Application (2021-2032)
Figure 33. Europe Infant Formula Revenue (USD Million) By Product (2021-2032)
Figure 34. Asia Pacific Infant Formula Revenue (USD Million) By Type (2021-2032)
Figure 35. Asia Pacific Infant Formula Revenue (USD Million) By Application (2021-2032)
Figure 36. Asia Pacific Infant Formula Revenue (USD Million) By Product (2021-2032)
Figure 37. South America Infant Formula Revenue (USD Million) By Type (2021-2032)
Figure 38. South America Infant Formula Revenue (USD Million) By Application (2021-2032)
Figure 39. South America Infant Formula Revenue (USD Million) By Product (2021-2032)
Figure 40. Middle East and Africa Infant Formula Revenue (USD Million) By Type (2021-2032)
Figure 41. Middle East and Africa Infant Formula Revenue (USD Million) By Application (2021-2032)
Figure 42. Middle East and Africa Infant Formula Revenue (USD Million) By Product (2021-2032)
By Product
Milk-based formula
Soy-based formula
Specialty formula
By Distribution Channel
Offline Retail
Online Retail
By Ingredient
Standard Formula
Organic Formula
GMO-Free Formula
Countries Analyzed
North America (US, Canada, Mexico)
Europe (Germany, UK, France, Spain, Italy, Russia, Rest of Europe)
Asia Pacific (China, India, Japan, South Korea, Australia, South East Asia, Rest of Asia)
South America (Brazil, Argentina, Rest of South America)
Middle East and Africa (Saudi Arabia, UAE, Rest of Middle East, South Africa, Egypt, Rest of Africa)
