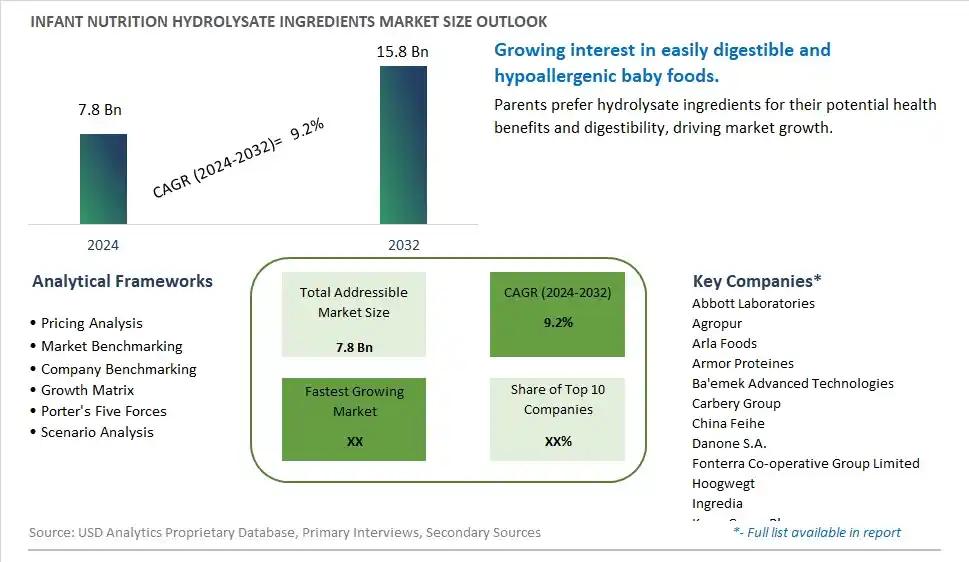
Global Infant Nutrition Hydrolysate Ingredients Market Size is valued at $7.8 Billion in 2024 and is forecast to register a growth rate (CAGR) of 9.2% to reach $15.8 Billion by 2032.
The global Infant Nutrition Hydrolysate Ingredients Market Comprehensive Study analyzes and forecasts the market size across 6 regions and 24 countries for diverse segments -By Type (General Paediatric, Paediatric FSMP), By Application (0 to 6 months, 6 to 12 months, 12 to 24 months)
An Introduction to Infant Nutrition Hydrolysate Ingredients Market
In 2024, the infant nutrition hydrolysate ingredients market is expanding rapidly, driven by the increasing demand for hypoallergenic and easily digestible infant formulas. Hydrolysate ingredients, which are proteins broken down into smaller peptides, reduce the risk of allergic reactions and improve nutrient absorption. The market is benefiting from advancements in hydrolysis technologies and the rising prevalence of food allergies among infants. Innovations in ingredient formulations and regulatory support are enhancing the development and adoption of hydrolysate-based infant nutrition products.
Infant Nutrition Hydrolysate Ingredients Competitive Landscape
The market report analyses the leading companies in the industry including Abbott Laboratories, Agropur, Arla Foods, Armor Proteines, Ba'emek Advanced Technologies, Carbery Group, China Feihe, Danone S.A., Fonterra Co-operative Group Limited, Hoogwegt, Ingredia, Kerry Group Plc, Mead Johnson & Company, Nestlé SA, Royal FrieslandCampina N.V., Tatua, and Others.
Infant Nutrition Hydrolysate Ingredients Market Dynamics
Infant Nutrition Hydrolysate Ingredients Market Trend: Increasing Use of Hydrolysates in Hypoallergenic Formulas
The most prominent trend in the Infant Nutrition Hydrolysate Ingredients Market is the increasing use of hydrolysates in hypoallergenic formulas. Hydrolysates, which are proteins that have been broken down into smaller peptides, are gaining popularity as a key ingredient in infant formulas designed for infants with cow's milk protein allergies or intolerances. This trend is driven by the growing awareness of the benefits of hydrolyzed proteins in reducing allergenic potential and improving digestibility. The demand for hypoallergenic and easily digestible formulas is encouraging manufacturers to incorporate hydrolysates into their products.
Infant Nutrition Hydrolysate Ingredients Market Driver: Rising Incidence of Food Allergies and Intolerances in Infants
A key driver for the Infant Nutrition Hydrolysate Ingredients Market is the rising incidence of food allergies and intolerances in infants. As more infants are diagnosed with allergies to cow's milk proteins and other common allergens, there is a growing need for specialized nutrition solutions that minimize allergic reactions. Hydrolysate ingredients, known for their reduced allergenicity, are being increasingly used to formulate hypoallergenic infant formulas. This rising prevalence of food allergies and intolerances is significantly driving the market for hydrolysate ingredients as parents and healthcare providers seek safe and effective nutritional options for affected infants.
Infant Nutrition Hydrolysate Ingredients Market Opportunity: Development of Specialized Hydrolysate-Based Products
One potential opportunity in the Infant Nutrition Hydrolysate Ingredients Market lies in the development of specialized hydrolysate-based products. By focusing on creating targeted nutritional solutions that cater to specific health needs, such as preterm infants, infants with severe allergies, and those with digestive disorders, manufacturers can address a growing market demand. The development of hydrolysate-based products that offer tailored benefits and support the unique nutritional requirements of vulnerable infants can drive market growth and improve the quality of life for affected children.
Infant Nutrition Hydrolysate Ingredients Market Share Analysis: General Paediatric segment generated the highest revenue share in the industry
Among the types in the Infant Nutrition Hydrolysate Ingredients Market, the General Paediatric segment is the largest. This segment includes hydrolysate ingredients used in infant nutrition products designed for general pediatric use across various age groups. These ingredients are extensively utilized in formulas and specialized products aimed at meeting the nutritional needs of infants and young children who may have specific dietary requirements or digestive sensitivities. General paediatric hydrolysate ingredients are formulated to be easily digestible and hypoallergenic, making them suitable for a broad range of pediatric applications.
Infant Nutrition Hydrolysate Ingredients Market Share Analysis: 0 to 6 months is the fastest growing segment over the forecast period to 2032
The 0 to 6 months application segment is anticipated to be the fastest-growing in the Infant Nutrition Hydrolysate Ingredients Market through 2032. This growth is driven by the increasing global birth rates and the rising adoption of infant formula and nutritional products during the first six months of life. Infants in this age group require specialized nutrition that supports their rapid growth and development, including hydrolysate ingredients that provide essential nutrients in a digestible form. Manufacturers are focusing on developing innovative formulations with hydrolysate ingredients that mimic the composition of human breast milk, promoting optimal infant health outcomes. The demand for infant nutrition products tailored for newborns and infants is expected to fuel significant growth in this market segment.
Infant Nutrition Hydrolysate Ingredients Market Segmentation
By Type
General Paediatric
Paediatric FSMP
By Application
0 to 6 months
6 to 12 months
12 to 24 months
Countries Analyzed
North America (US, Canada, Mexico)
Europe (Germany, UK, France, Spain, Italy, Russia, Rest of Europe)
Asia Pacific (China, India, Japan, South Korea, Australia, South East Asia, Rest of Asia)
South America (Brazil, Argentina, Rest of South America)
Middle East and Africa (Saudi Arabia, UAE, Rest of Middle East, South Africa, Egypt, Rest of Africa)
Infant Nutrition Hydrolysate Ingredients Companies Profiled in the Study
Abbott Laboratories
Agropur
Arla Foods
Armor Proteines
Ba'emek Advanced Technologies
Carbery Group
China Feihe
Danone S.A.
Fonterra Co-operative Group Limited
Hoogwegt
Ingredia
Kerry Group Plc
Mead Johnson & Company
Nestlé SA
Royal FrieslandCampina N.V.
Tatua
*- List Not Exhaustive
Chapter 1. TABLE OF CONTENTS
Chapter 2. Introduction to Infant Nutrition Hydrolysate Ingredients Market
2.1. Market Overview
2.2. Key Statistics and Report Highlights
2.3. Scope of the Comprehensive Study
2.3.1. Market Definition
2.3.2 Countries and Regions Covered
2.3.3 Research Objective
2.3.4 Units, Currency, and Conversions
2.3.5 Industry Value Chain
2.4. Key Market Segments
2.5. Key Companies
2.6. Study Period
Chapter 3. Strategic Analysis Review
3.1. Infant Nutrition Hydrolysate Ingredients Pricing Analysis and Forecast
3.2. Porter’s Five Forces
3.3. Market Ecosystem
3.4. SWOT Analysis
3.5. Regulatory Scenario
3.3. Effects of Inflation, Russia-Ukraine War, moderating economic growth, and other macroeconomic factors
Chapter 4. Competitive Landscape
4.1. Market Share Analysis
4.1.1. Global Infant Nutrition Hydrolysate Ingredients Market Share by Company, 2023
4.1.2. Product Offerings of Leading Infant Nutrition Hydrolysate Ingredients Companies
4.2. Market Entropy
4.2.1. New Product Launches in the Industry
4.2.2. Mergers, Acquisitions, Joint ventures, and Partnerships
4.3. Key Strategies and Best Practices
Chapter 5. Global Market Projections: Best, Reference, and Low Case Scenarios
5.1. Growth Analysis- Case Scenario Definitions
5.2. Low Growth Case Scenario Forecasts
5.3. Reference Growth Case Scenario Forecasts
5.4. High Growth Case Scenario Forecasts
Chapter 6. Market Dynamics
6.1. Infant Nutrition Hydrolysate Ingredients Market Drivers
6.2. Infant Nutrition Hydrolysate Ingredients Market Challenges
6.6. Infant Nutrition Hydrolysate Ingredients Market Opportunities
6.4. Infant Nutrition Hydrolysate Ingredients Market Trends
Chapter 7. Global Infant Nutrition Hydrolysate Ingredients Market Outlook Trends
7.1. Global Infant Nutrition Hydrolysate Ingredients Revenue (USD Million) and CAGR (%) by Type (2021-2032)
7.2. Global Infant Nutrition Hydrolysate Ingredients Revenue (USD Million) and CAGR (%) by Application (2021-2032)
7.3. Global Infant Nutrition Hydrolysate Ingredients Revenue (USD Million) and CAGR (%) by Product (2021-2032)
By Type
General Paediatric
Paediatric FSMP
By Application
0 to 6 months
6 to 12 months
12 to 24 months
Chapter 8. Global Infant Nutrition Hydrolysate Ingredients Regional Analysis and Outlook
8.1. Global Infant Nutrition Hydrolysate Ingredients Revenue (USD Million) By Regions (2021- 2032)
8.2. North America Infant Nutrition Hydrolysate Ingredients Revenue (USD Million) by Country (2021-2032)
8.2.1. United States Infant Nutrition Hydrolysate Ingredients Regional Analysis and Outlook
8.2.2. Canada Infant Nutrition Hydrolysate Ingredients Regional Analysis and Outlook
8.2.3. Mexico Infant Nutrition Hydrolysate Ingredients Regional Analysis and Outlook
8.3. Europe Infant Nutrition Hydrolysate Ingredients Revenue (USD Million), by Country (2021-2032)
8.3.1. Germany Infant Nutrition Hydrolysate Ingredients Regional Analysis and Outlook
8.3.2. France Infant Nutrition Hydrolysate Ingredients Regional Analysis and Outlook
8.3.3. United Kingdom Infant Nutrition Hydrolysate Ingredients Regional Analysis and Outlook
8.3.4. Spain Infant Nutrition Hydrolysate Ingredients Regional Analysis and Outlook
8.3.5. Italy Infant Nutrition Hydrolysate Ingredients Regional Analysis and Outlook
8.3.6. Russia Infant Nutrition Hydrolysate Ingredients Regional Analysis and Outlook
8.3.7. Rest of Europe Infant Nutrition Hydrolysate Ingredients Regional Analysis and Outlook
8.4. Asia Pacific Infant Nutrition Hydrolysate Ingredients Revenue (USD Million) by Country (2021-2032)
8.4.1. China Infant Nutrition Hydrolysate Ingredients Regional Analysis and Outlook
8.4.2. Japan Infant Nutrition Hydrolysate Ingredients Regional Analysis and Outlook
8.4.3. India Infant Nutrition Hydrolysate Ingredients Regional Analysis and Outlook
8.4.4. South Korea Infant Nutrition Hydrolysate Ingredients Regional Analysis and Outlook
8.4.5. Australia Infant Nutrition Hydrolysate Ingredients Regional Analysis and Outlook
8.4.6. South East Asia Infant Nutrition Hydrolysate Ingredients Regional Analysis and Outlook
8.4.7. Rest of Asia Pacific Infant Nutrition Hydrolysate Ingredients Regional Analysis and Outlook
8.5. South America Infant Nutrition Hydrolysate Ingredients Revenue (USD Million), by Country (2021-2032)
8.5.1. Brazil Infant Nutrition Hydrolysate Ingredients Regional Analysis and Outlook
8.5.2. Argentina Infant Nutrition Hydrolysate Ingredients Regional Analysis and Outlook
8.5.3. Rest of South America Infant Nutrition Hydrolysate Ingredients Regional Analysis and Outlook
8.6. Middle East and Africa Infant Nutrition Hydrolysate Ingredients Revenue (USD Million) by Country (2021-2032)
8.6.1. Middle East Infant Nutrition Hydrolysate Ingredients Regional Analysis and Outlook
8.6.2. Africa Infant Nutrition Hydrolysate Ingredients Regional Analysis and Outlook
Chapter 9. North America Infant Nutrition Hydrolysate Ingredients Analysis and Outlook
9.1. North America Infant Nutrition Hydrolysate Ingredients Revenue (USD Million) by Segments (2021-2032)
9.1.1. North America Infant Nutrition Hydrolysate Ingredients Revenue (USD Million) by Type (2021-2032)
9.1.2. North America Infant Nutrition Hydrolysate Ingredients Revenue (USD Million) by Application (2021-2032)
9.1.3. North America Infant Nutrition Hydrolysate Ingredients Revenue (USD Million) by Product (2021-2032)
By Type
General Paediatric
Paediatric FSMP
By Application
0 to 6 months
6 to 12 months
12 to 24 months
Chapter 10. Europe Infant Nutrition Hydrolysate Ingredients Analysis and Outlook
10.1. Europe Infant Nutrition Hydrolysate Ingredients Revenue (USD Million), by Segments (USD Million) (2021-2032)
10.1.1. Europe Infant Nutrition Hydrolysate Ingredients Revenue (USD Million) by Type (2021-2032)
10.1.2. Europe Infant Nutrition Hydrolysate Ingredients Revenue (USD Million) by Application (2021-2032)
10.1.3. Europe Infant Nutrition Hydrolysate Ingredients Revenue (USD Million) by Product (2021-2032)
By Type
General Paediatric
Paediatric FSMP
By Application
0 to 6 months
6 to 12 months
12 to 24 months
Chapter 11. Asia Pacific Infant Nutrition Hydrolysate Ingredients Analysis and Outlook
11.1. Asia Pacific Infant Nutrition Hydrolysate Ingredients Revenue (USD Million), and Revenue (USD Million) by Segments (2021-2032)
11.1.1. Asia Pacific Infant Nutrition Hydrolysate Ingredients Revenue (USD Million) by Type (2021-2032)
11.1.2. Asia Pacific Infant Nutrition Hydrolysate Ingredients Revenue (USD Million) by Application (2021-2032)
11.1.3. Asia Pacific Infant Nutrition Hydrolysate Ingredients Revenue (USD Million) by Product (2021-2032)
By Type
General Paediatric
Paediatric FSMP
By Application
0 to 6 months
6 to 12 months
12 to 24 months
Chapter 12. South America Infant Nutrition Hydrolysate Ingredients Analysis and Outlook
12.1. South America Infant Nutrition Hydrolysate Ingredients Revenue (USD Million), by Segments (2021-2032)
12.1.1. South America Infant Nutrition Hydrolysate Ingredients Revenue (USD Million) by Type (2021-2032)
12.1.2. South America Infant Nutrition Hydrolysate Ingredients Revenue (USD Million) by Application (2021-2032)
12.1.3. South America Infant Nutrition Hydrolysate Ingredients Revenue (USD Million) by Product (2021-2032)
By Type
General Paediatric
Paediatric FSMP
By Application
0 to 6 months
6 to 12 months
12 to 24 months
Chapter 13. Middle East and Africa Infant Nutrition Hydrolysate Ingredients Analysis and Outlook
13.1. Middle East and Africa Infant Nutrition Hydrolysate Ingredients Revenue (USD Million), by Segments (2021-2032)
13.1.1. Middle East and Africa Infant Nutrition Hydrolysate Ingredients Revenue (USD Million) by Type (2021-2032)
13.1.2. Middle East and Africa Infant Nutrition Hydrolysate Ingredients Revenue (USD Million) by Application (2021-2032)
13.1.3. Middle East and Africa Infant Nutrition Hydrolysate Ingredients Revenue (USD Million) by Product (2021-2032)
By Type
General Paediatric
Paediatric FSMP
By Application
0 to 6 months
6 to 12 months
12 to 24 months
Chapter 14. Infant Nutrition Hydrolysate Ingredients Company Profiles
14.1 Business Overview
14.2 Product Profiles
14.3 SWOT Profiles
14.5 Recent Developments
14.6 Financial Profile
List of Companies
Abbott Laboratories
Agropur
Arla Foods
Armor Proteines
Ba'emek Advanced Technologies
Carbery Group
China Feihe
Danone S.A.
Fonterra Co-operative Group Limited
Hoogwegt
Ingredia
Kerry Group Plc
Mead Johnson & Company
Nestlé SA
Royal FrieslandCampina N.V.
Tatua
15. Methodology and Data Sources
15.1 Customization Offerings
15.2 Subscription Services
15.3 Related Reports
15.4 Publisher Expertise
LIST OF TABLES
Table 1 Market Segmentation Analysis
Table 2 Global Infant Nutrition Hydrolysate Ingredients Market Share of Leading Companies, 2023
Table 3 Product Offerings of Leading Companies
Table 4 Low Growth Scenario Forecasts
Table 5 Reference Case Growth Scenario
Table 6 High Growth Case Scenario
Table 7 Global Infant Nutrition Hydrolysate Ingredients Revenue (USD Million) And CAGR (%) By Type (2021-2032)
Table 8 Global Infant Nutrition Hydrolysate Ingredients Revenue (USD Million) And CAGR (%) By Application (2021-2032)
Table 9 Global Infant Nutrition Hydrolysate Ingredients Revenue (USD Million) And CAGR (%) By Product (2021-2032)
Table 10 Global Infant Nutrition Hydrolysate Ingredients Market Revenue (USD Million) By Regions (2021-2032)
Table 11 Global Infant Nutrition Hydrolysate Ingredients Market Share (%) By Regions (2021-2032)
Table 12 North America Infant Nutrition Hydrolysate Ingredients Revenue (USD Million) By Country (2021-2032)
Table 13 Europe Infant Nutrition Hydrolysate Ingredients Revenue (USD Million) By Country (2021-2032)
Table 14 Asia Pacific Infant Nutrition Hydrolysate Ingredients Revenue (USD Million) By Country (2021-2032)
Table 15 South America Infant Nutrition Hydrolysate Ingredients Revenue (USD Million) By Country (2021-2032)
Table 16 Middle East and Africa Infant Nutrition Hydrolysate Ingredients Revenue (USD Million) By Region (2021-2032)
Table 17 North America Infant Nutrition Hydrolysate Ingredients Revenue (USD Million) By Type (2021-2032)
Table 18 North America Infant Nutrition Hydrolysate Ingredients Revenue (USD Million) By Application (2021-2032)
Table 19 North America Infant Nutrition Hydrolysate Ingredients Revenue (USD Million) By Product (2021-2032)
Table 20 Europe Infant Nutrition Hydrolysate Ingredients Revenue (USD Million) By Type (2021-2032)
Table 21 Europe Infant Nutrition Hydrolysate Ingredients Revenue (USD Million) By Application (2021-2032)
Table 22 Europe Infant Nutrition Hydrolysate Ingredients Revenue (USD Million) By Product (2021-2032)
Table 23 Asia Pacific Infant Nutrition Hydrolysate Ingredients Revenue (USD Million) By Type (2021-2032)
Table 24 Asia Pacific Infant Nutrition Hydrolysate Ingredients Revenue (USD Million) By Application (2021-2032)
Table 25 Asia Pacific Infant Nutrition Hydrolysate Ingredients Revenue (USD Million) By Product (2021-2032)
Table 26 South America Infant Nutrition Hydrolysate Ingredients Revenue (USD Million) By Type (2021-2032)
Table 27 South America Infant Nutrition Hydrolysate Ingredients Revenue (USD Million) By Application (2021-2032)
Table 28 South America Infant Nutrition Hydrolysate Ingredients Revenue (USD Million) By Product (2021-2032)
Table 29 Middle East and Africa Infant Nutrition Hydrolysate Ingredients Revenue (USD Million) By Type (2021-2032)
Table 30 Middle East and Africa Infant Nutrition Hydrolysate Ingredients Revenue (USD Million) By Application (2021-2032)
Table 31 Middle East and Africa Infant Nutrition Hydrolysate Ingredients Revenue (USD Million) By Product (2021-2032)
LIST OF FIGURES
Figure 1. Market Scope
Figure 2. Pricing Forecasts Per Unit, 2023- 2032
Figure 3. Porter’s Five Forces
Figure 4. Global Infant Nutrition Hydrolysate Ingredients Market Revenue (USD Million) By Regions (2021-2032)
Figure 5. Global Infant Nutrition Hydrolysate Ingredients Market Share (%) By Regions (2023)
Figure 6. North America Infant Nutrition Hydrolysate Ingredients Revenue (USD Million) By Country (2021-2032)
Figure 7. United States Infant Nutrition Hydrolysate Ingredients Revenue (USD Million) By Country (2021-2032)
Figure 8. Canada Infant Nutrition Hydrolysate Ingredients Revenue (USD Million) By Country (2021-2032)
Figure 9. Mexico Infant Nutrition Hydrolysate Ingredients Revenue (USD Million) By Country (2021-2032)
Figure 10. Europe Infant Nutrition Hydrolysate Ingredients Revenue (USD Million) By Country (2021-2032)
Figure 11. Germany Infant Nutrition Hydrolysate Ingredients Revenue (USD Million) By Country (2021-2032)
Figure 12. France Infant Nutrition Hydrolysate Ingredients Revenue (USD Million) By Country (2021-2032)
Figure 13. United Kingdom Infant Nutrition Hydrolysate Ingredients Revenue (USD Million) By Country (2021-2032)
Figure 14. Spain Infant Nutrition Hydrolysate Ingredients Revenue (USD Million) By Country (2021-2032)
Figure 15. Italy Infant Nutrition Hydrolysate Ingredients Revenue (USD Million) By Country (2021-2032)
Figure 16. Russia Infant Nutrition Hydrolysate Ingredients Revenue (USD Million) By Country (2021-2032)
Figure 17. Rest of Europe Infant Nutrition Hydrolysate Ingredients Revenue (USD Million) By Country (2021-2032)
Figure 11. Asia Pacific Infant Nutrition Hydrolysate Ingredients Revenue (USD Million) By Country (2021-2032)
Figure 12. China Infant Nutrition Hydrolysate Ingredients Revenue (USD Million) By Country (2021-2032)
Figure 13. Japan Infant Nutrition Hydrolysate Ingredients Revenue (USD Million) By Country (2021-2032)
Figure 14. India Infant Nutrition Hydrolysate Ingredients Revenue (USD Million) By Country (2021-2032)
Figure 15. South Korea Infant Nutrition Hydrolysate Ingredients Revenue (USD Million) By Country (2021-2032)
Figure 16. Australia Infant Nutrition Hydrolysate Ingredients Revenue (USD Million) By Country (2021-2032)
Figure 17. South East Asia Infant Nutrition Hydrolysate Ingredients Revenue (USD Million) By Country (2021-2032)
Figure 18. South America Infant Nutrition Hydrolysate Ingredients Revenue (USD Million) By Country (2021-2032)
Figure 19. Brazil Infant Nutrition Hydrolysate Ingredients Revenue (USD Million) By Country (2021-2032)
Figure 20. Argentina Infant Nutrition Hydrolysate Ingredients Revenue (USD Million) By Country (2021-2032)
Figure 21. Rest of Asia Pacific Infant Nutrition Hydrolysate Ingredients Revenue (USD Million) By Country (2021-2032)
Figure 22. Middle East and Africa Infant Nutrition Hydrolysate Ingredients Revenue (USD Million) By Region (2021-2032)
Figure 23. Saudi Arabia Infant Nutrition Hydrolysate Ingredients Revenue (USD Million) By Region (2021-2032)
Figure 24. The UAE Infant Nutrition Hydrolysate Ingredients Revenue (USD Million) By Region (2021-2032)
Figure 25. Rest of Middle East Infant Nutrition Hydrolysate Ingredients Revenue (USD Million) By Region (2021-2032)
Figure 26. South Africa Infant Nutrition Hydrolysate Ingredients Revenue (USD Million) By Region (2021-2032)
Figure 27. Africa Infant Nutrition Hydrolysate Ingredients Revenue (USD Million) By Region (2021-2032)
Figure 28. North America Infant Nutrition Hydrolysate Ingredients Revenue (USD Million) By Type (2021-2032)
Figure 29. North America Infant Nutrition Hydrolysate Ingredients Revenue (USD Million) By Application (2021-2032)
Figure 30. North America Infant Nutrition Hydrolysate Ingredients Revenue (USD Million) By Product (2021-2032)
Figure 31. Europe Infant Nutrition Hydrolysate Ingredients Revenue (USD Million) By Type (2021-2032)
Figure 32. Europe Infant Nutrition Hydrolysate Ingredients Revenue (USD Million) By Application (2021-2032)
Figure 33. Europe Infant Nutrition Hydrolysate Ingredients Revenue (USD Million) By Product (2021-2032)
Figure 34. Asia Pacific Infant Nutrition Hydrolysate Ingredients Revenue (USD Million) By Type (2021-2032)
Figure 35. Asia Pacific Infant Nutrition Hydrolysate Ingredients Revenue (USD Million) By Application (2021-2032)
Figure 36. Asia Pacific Infant Nutrition Hydrolysate Ingredients Revenue (USD Million) By Product (2021-2032)
Figure 37. South America Infant Nutrition Hydrolysate Ingredients Revenue (USD Million) By Type (2021-2032)
Figure 38. South America Infant Nutrition Hydrolysate Ingredients Revenue (USD Million) By Application (2021-2032)
Figure 39. South America Infant Nutrition Hydrolysate Ingredients Revenue (USD Million) By Product (2021-2032)
Figure 40. Middle East and Africa Infant Nutrition Hydrolysate Ingredients Revenue (USD Million) By Type (2021-2032)
Figure 41. Middle East and Africa Infant Nutrition Hydrolysate Ingredients Revenue (USD Million) By Application (2021-2032)
Figure 42. Middle East and Africa Infant Nutrition Hydrolysate Ingredients Revenue (USD Million) By Product (2021-2032)
By Type
General Paediatric
Paediatric FSMP
By Application
0 to 6 months
6 to 12 months
12 to 24 months
Countries Analyzed
North America (US, Canada, Mexico)
Europe (Germany, UK, France, Spain, Italy, Russia, Rest of Europe)
Asia Pacific (China, India, Japan, South Korea, Australia, South East Asia, Rest of Asia)
South America (Brazil, Argentina, Rest of South America)
Middle East and Africa (Saudi Arabia, UAE, Rest of Middle East, South Africa, Egypt, Rest of Africa)
